

EQUITY RISK MONITOR HIGHLIGHTS
WEEK ENDED SEPTEMBER 11, 2026
- Were the reports of Momentum’s demise greatly exaggerated?
- Just how bad were the drawdowns by region?
- Whipsawing sector preferences underlie Momentum’s poor performance
- Volatile stocks mean shifting Momentum exposures
Were the reports of Momentum’s demise greatly exaggerated?
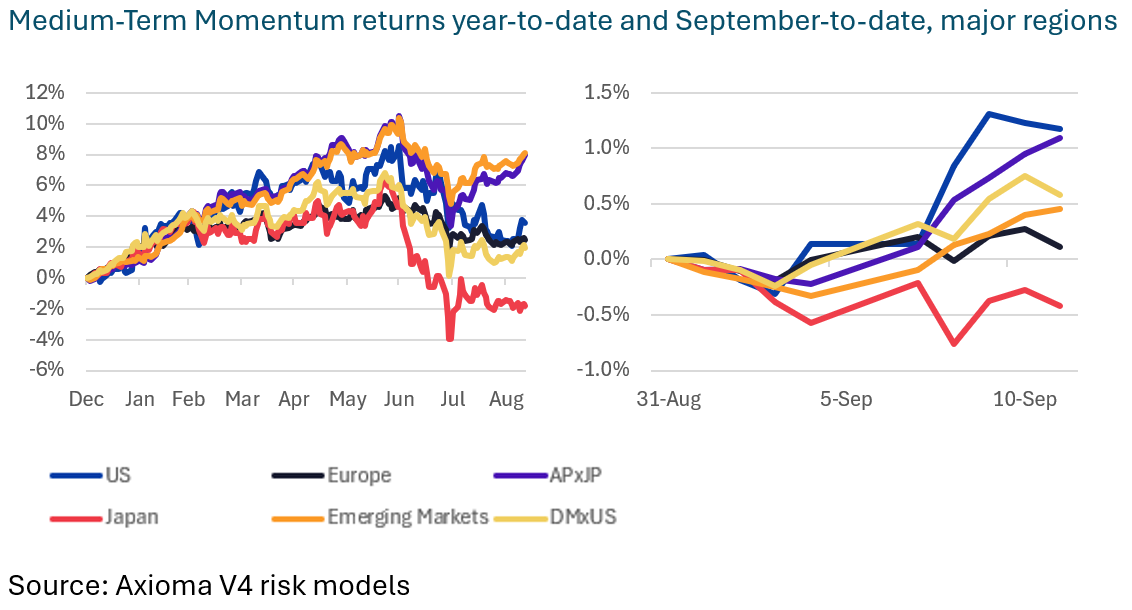
In this week’s Equity Highlights we focus once again on the performance of Medium-Term Momentum, which has seen some extreme returns so far this quarter. The bottom line is that Momentum has struggled, seeing some of its biggest two-month drawdowns in model history in several regions, and is staging a wobbly, but seemingly real, recovery this month.
The ups and downs of the AI trade, combined with oscillating optimism/pessimism about long rates and oil prices have wreaked havoc on Momentum’s performance. Back in July we wrote about the sharp drawdown in Medium-Term Momentum (see the analysis here).
July and August saw Momentum’s returns in the first and second percentiles, respectively, for the US model. The quarter-to-date return of -4.56% falls in the bottom percentile so far as well. However, September has seen a rebound starting on the 4th of the month, with returns for three of the days among the top 5% of daily return for the model, and the eight-day return since the beginning of the month in the 95th percentile.
In Europe, July (3rd percentile) and August (17th) Momentum returns were clearly disappointing as well. September so far has seen some good days but also some that were quite poor, and if the factor return doesn’t improve Q3 is likely to fall into the bottom 5% of historical quarterly returns.
July’s Momentum performance in Japan (-6.57%) was one of the worst monthly showings in the history of the model, but performance recovered in August (to 0.79%, which was at least positive), only to disappoint again so far in September. Asia Pacific ex Japan had similar rankings to Japan in July and August (July was the worst month ever with a return of -5.58%, followed by a 94th-percentile return of 2.38% in August) but here, unlike in Japan, Momentum has held up well in September so far.
For Developed Markets ex US as a whole July was also one of the worst months ever (-4.02%, 1st percentile), but the return was negative again in August. September has been better, but closer to average than a true rebound.
Finally, for Emerging Markets, with a return of -4.32% July was the second-worst in model history (April 2009’s return was slightly lower), the rebound in August was strong at 1.88%, and September has been about average so far.
The following charts do not appear in the Equity Risk Monitors but are available on request:
Just how bad were the drawdowns by region?
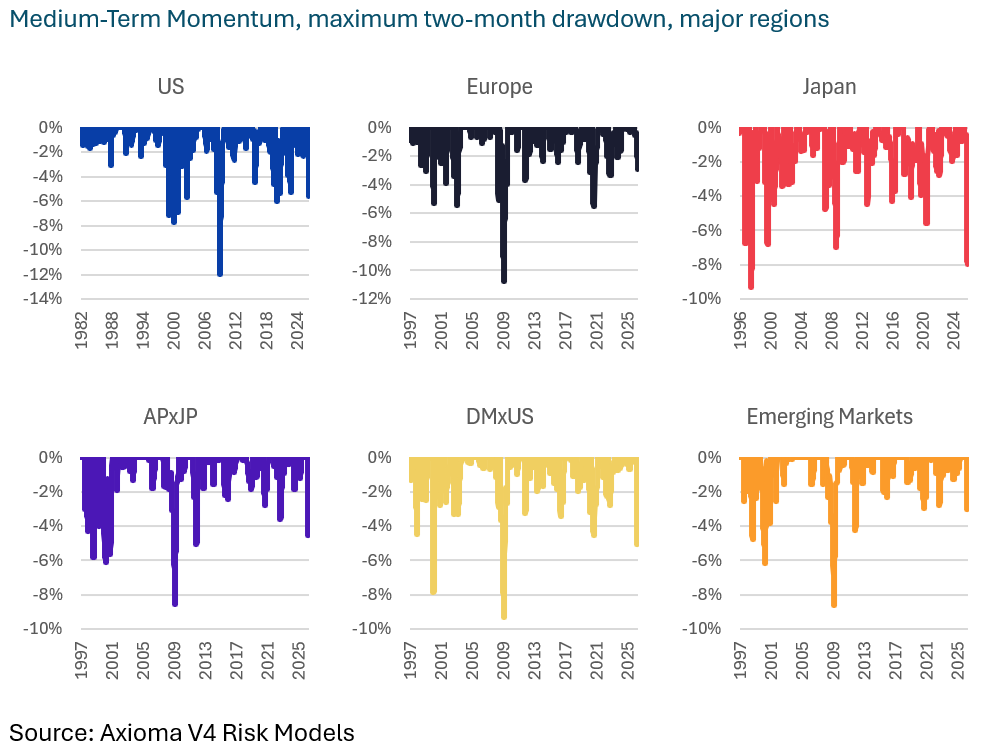
Drawdown charts show how big the two-month drawdown was relative to history. The US reached its maximum two-month (42 day) drawdown on August 31, Europe on August 28, Japan on August 24, Asia Pacific ex-Japan and Emerging Markets on July 30, and Developed Markets ex-US on July 29. Those are thus the dates that the factor’s recovery started but none of the regions have seen return back to its high water mark yet, while most still have a long way to go.
The most recent drawdown was a big one for all regions, although not the worst ever for any of them (although Japan is close, with this drawdown exceeded only in early March 1998 amid a severe recession in the aftermath of the Asian financial crisis – so not great company to be in). Other regions saw their biggest drawdowns tied to the early recovery from the Global Financial Crisis when market leadership changed suddenly and sharply.
The good news from these charts is that we have seen big shortfalls in Momentum performance in the past, and the factor has always recovered. So to answer the title question, the “demise” of Momentum may have been exaggerated, but the recent pain has been real.
The following charts do not appear in the Equity Risk Monitors but are available on request:
Whipsawing sector preferences underlie Momentum’s poor performance
The market has clearly had trouble making up its mind, as we wrote about in our August 28 highlights (see here). We wrote then about a number of competing narratives and their impact on correlations, which in turn kept overall risk low. Those competing – and changing - narratives have also been one reason for Momentum’s whipsawing, as the stocks with good or bad scores are not necessarily the same from one day to the next. We see this in the sector returns in all regions we cover, and show two examples below.
If oil prices are up and Energy is faring well one day, then oil and Energy stock prices fall the next day, it is difficult to get a read on what is truly good Momentum and what is just a knee-jerk market reaction.
See charts from the STOXX US and STOXX International Developed Markets Equity Risk Monitors as of September 11, 2026
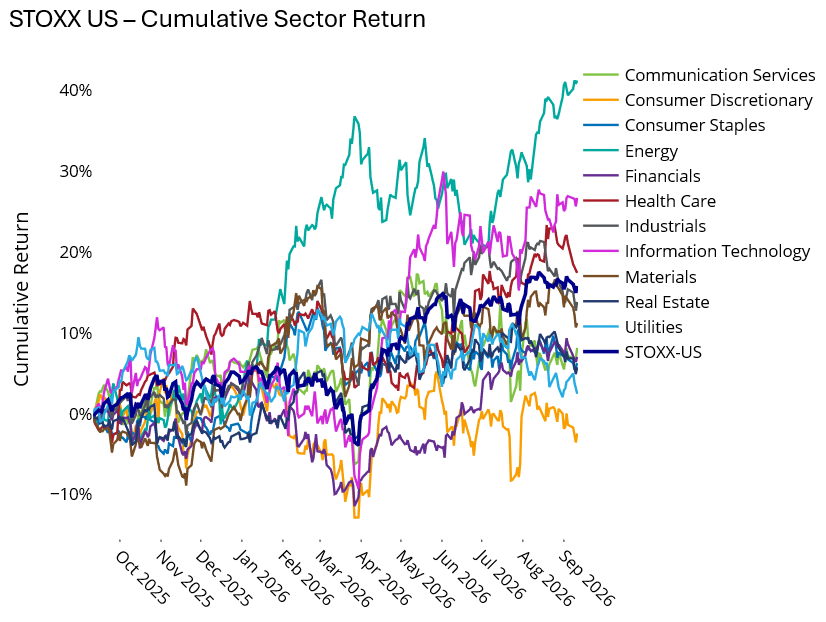
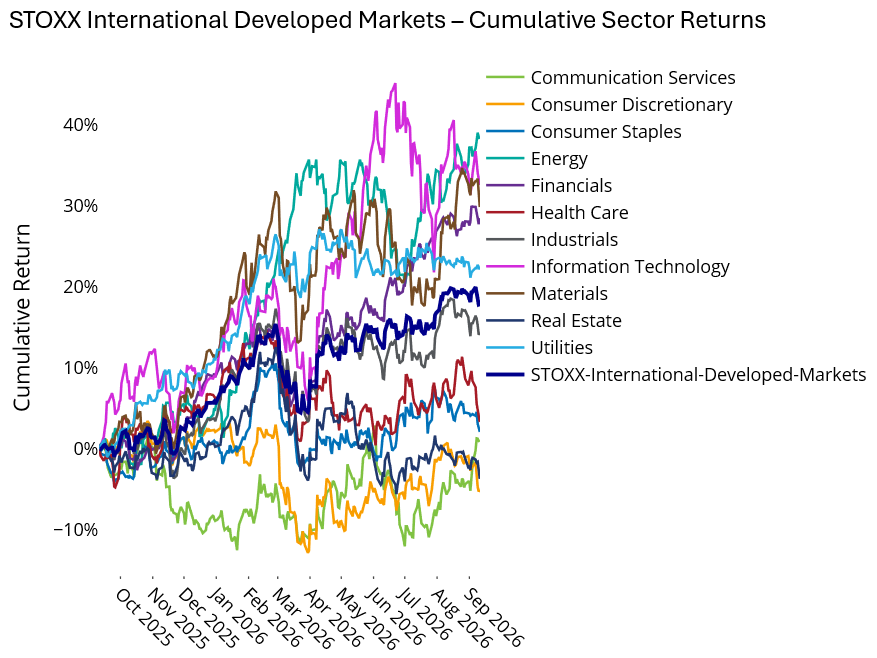
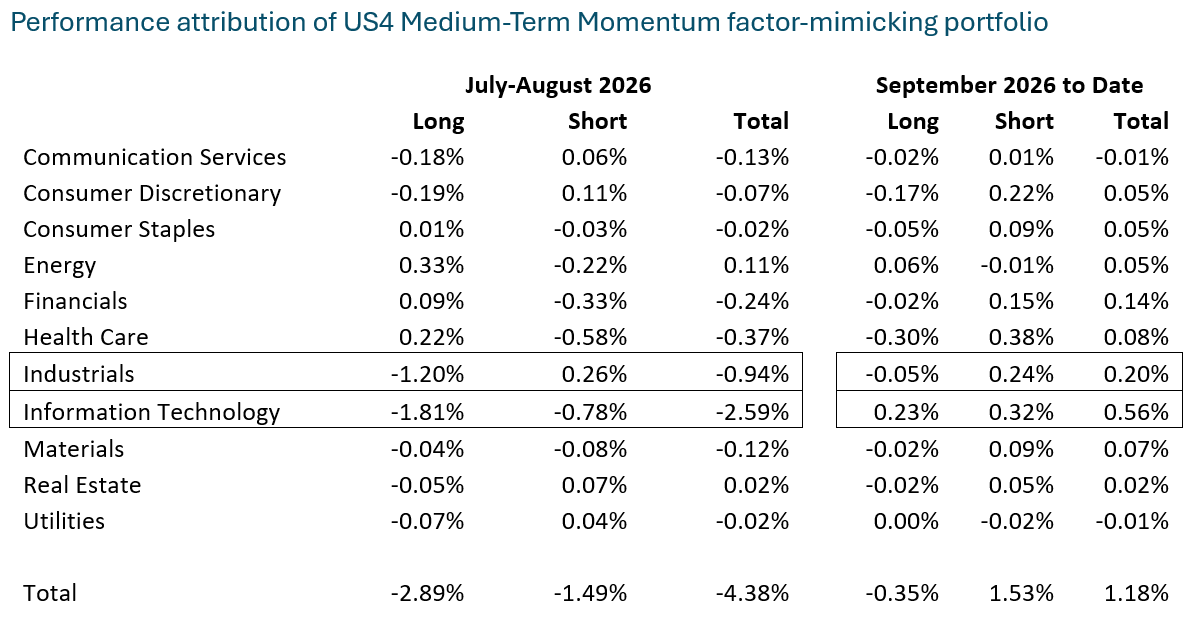
Attribution of US Momentum performance by sector shows what many might already suspect – Technology stocks had the biggest impact on returns, both for the drawdown in July and August and the beginnings of a recovery in September. Narrowing down the attribution further reveals that Semiconductors and Software together drove about half of the Technology detraction. Industrials’ contribution of -94 basis points was more of a surprise. However, given the small weights of every asset in the factor-mimicking portfolio (FMP) used to create these results, there was no one name that stood out as a return driver.
In addition, for the July-August period the Long positions in the FMP accounted for about two-thirds of the performance, whereas it was the short positions that have driven the recent recovery.
The following table does not appear in the Equity Risk Monitors but are available on request:
Volatile stocks mean shifting Momentum exposures
Finally, we note that the shifting narratives combined with the performance volatility led to some big changes in sector exposures to Momentum (which of course is calculated based on each company’s performance over the last year, excluding the last month). There are more nuances to the calculation, but this is the gist.
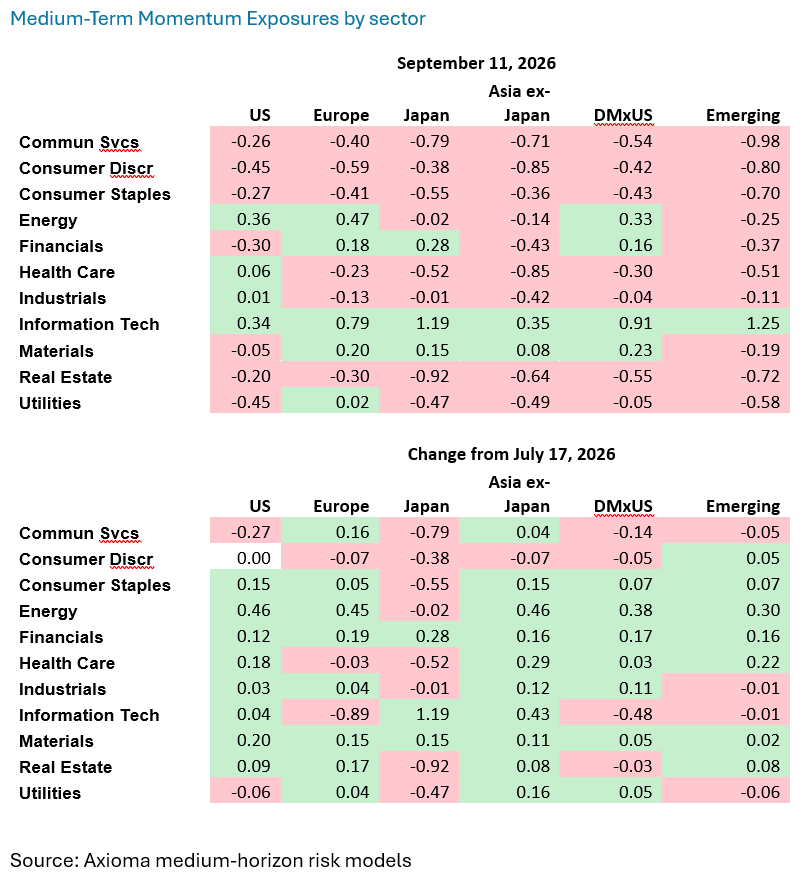
We looked at the change in exposures from our last discussion of this topic on July 17. Changes in exposures over this period were bigger for Momentum than they were for any other factor across the major regions. Current positive exposures to Momentum remain concentrated in Technology, where the exposure increased substantially in Japan and Asia ex-Japan but decreased by quite a bit in Europe and Developed Markets ex-US.
Energy in the US, Europe and Developed Markets ex-US also has a positive exposure, and the exposure has increased in all regions except Japan, although it remains negative in the others.
These highly positive exposures mean that most other exposures are negative. (Note that model exposures are calculated over a broad universe of stocks, while the tables below are based on the narrower STOXX benchmarks; therefore they do not add to zero as they do in the broader factor definition.)
The big change in exposures likely led to substantial rebalancing requirements for managers tilting on Momentum. Given the continued competing narratives and the accompany asset volatility noted above we do not see this need for added rebalancing for managers targeting price-based factors abating any time soon.
The following tables do not appear in the Equity Risk Monitors but are available on request, and available for all factors in each monitor:
You may also like


