

EQUITY RISK MONITOR HIGHLIGHTS
WEEK ENDED JULY 17, 2026
- A broad pullback, led by Emerging Markets and Japan, while breadth widened
- Risk cools in EM and APxJP, but ticks up in the US
- A defensive rotation beneath the surface told by style factor returns
- Momentum’s reversal means some of its worst returns ever
A broad pullback, led by Emerging Markets and Japan, while breadth widened
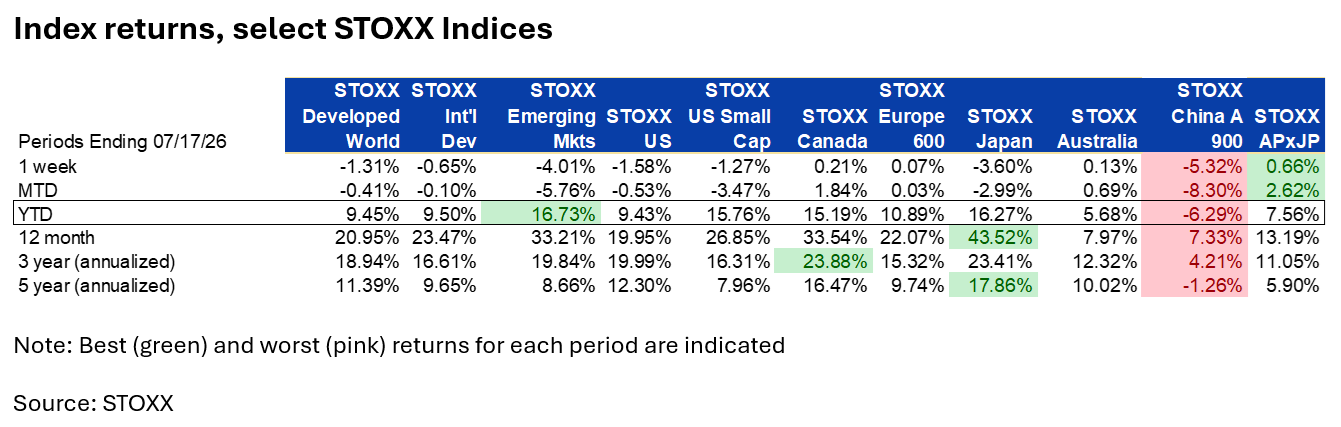
After several weeks of divergence, last week brought nearly every major market down together. Emerging Markets fell the hardest, down roughly 4.0%, followed by Japan with a return of -3.6%. Losses were more contained elsewhere: US Small Cap and the STOXX Developed World Index each fell around 1.3%, the STOXX US Index was down roughly 1.6%, and Europe was essentially flat. The STOXX Asia Pacific ex-Japan 600 had the highest return of the benchmarks we track closely, at +0.7%. The STOXX China A 900 Index continued its slide, losing more than 5% for the week and with a return of -6.3%, the only major index we track closely to be down year to date.
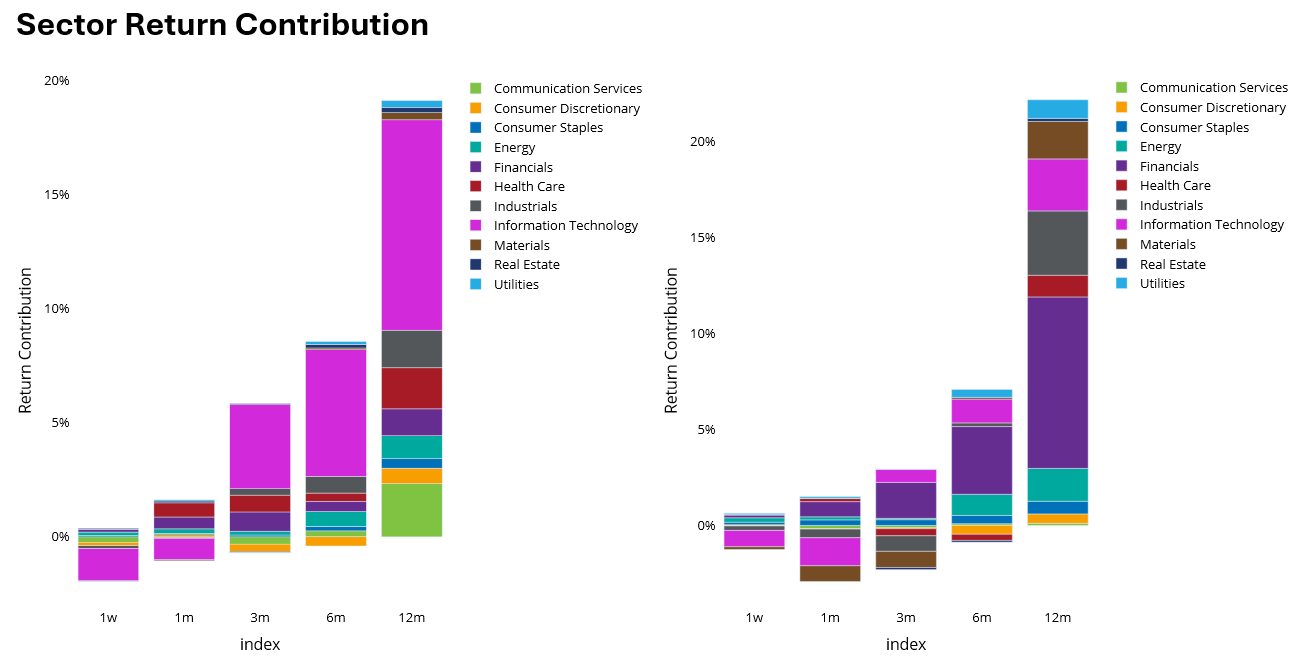
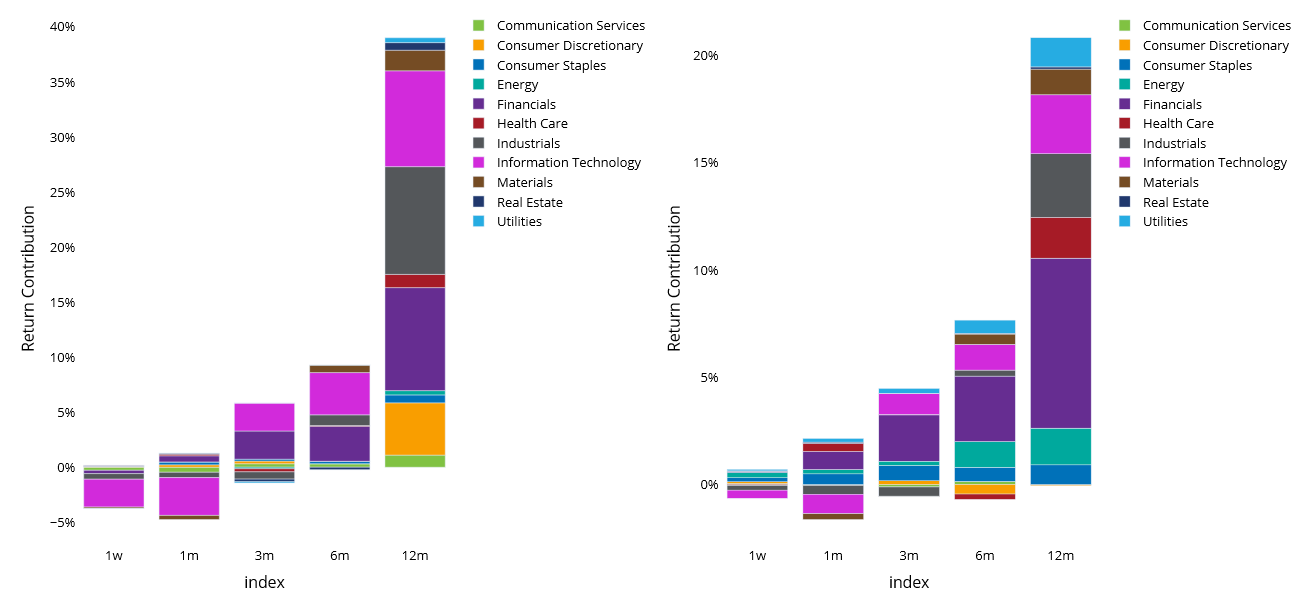
It is clear that most of the index declines last week could be traced to the reversal of the Tech trade we were seeing for most of this year, with the exception of Europe, where Technology’s weight, although recently increased, is relatively low.
The following table does not appear in the Equity Risk Monitors but is available on request.
See charts from STOXX US (Top Left) and STOXX International Developed Markets (Top Right), from STOXX Japan (Bottom Left) and STOXX Europe 600 (Bottom Right) Equity Risk Monitors as of July 17, 2026
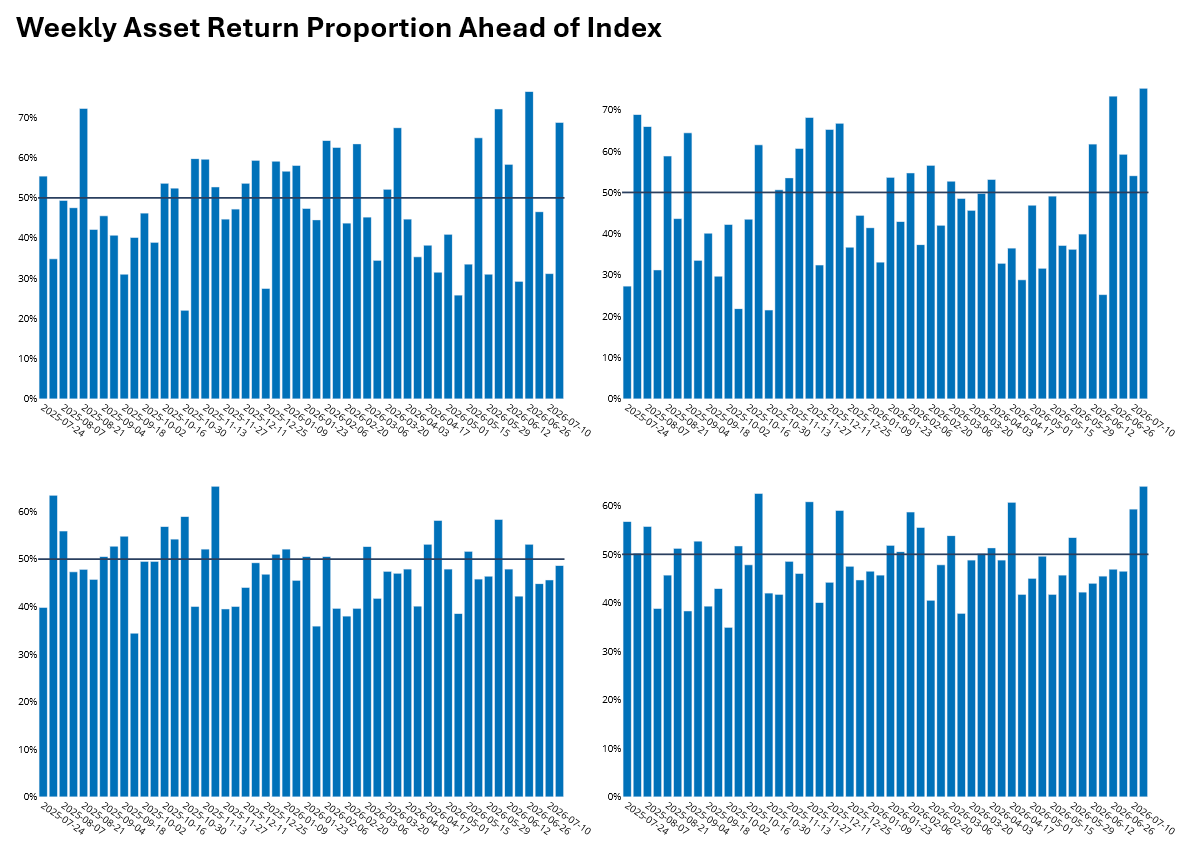
At the same time, breadth widened substantially almost everywhere—Almost 70% of US stocks beat the index last week versus just 31% the week before, and Japan's breadth reached 75.2%. That combination, a falling index alongside improving breadth, points to a decline led by the largest and most tech-heavy names (e.g. the hyperscalers) rather than a broad deterioration across the market. About 60% of European stocks managed to outpace the STOXX Europe 600, even without the heavy Tech weighting. Asia Pacific ex-Japan was the exception, with breadth narrowing to 48.6%, suggesting its pullback was more evenly distributed across the index. The good news is that many investors were likely able to beat the index last week,
See charts from US (Top Left), Japan (Top Right) Asia ex-Japan (Bottom Left) And Europe (Bottom Right) Equity Risk Monitors
Risk cools in EM and APxJP, but ticks up in the US
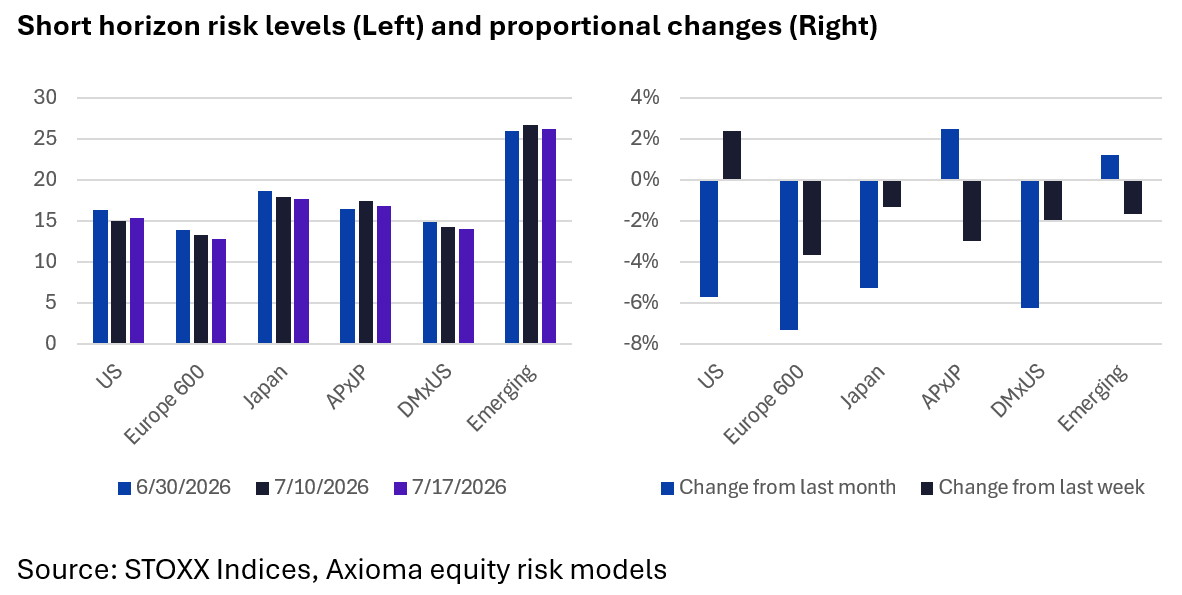
For the first time in over a month, short-horizon fundamental predicted risk in Emerging Markets moved lower rather than higher, easing from 26.7% to 26.2%. Asia Pacific ex-Japan saw a larger decline, from 17.4% to 16.8%, while Europe (13.3% to 12.8%), Developed Markets ex-US (14.3% to 14.0%) and Japan (17.9% to 17.6%) all continued the gradual cooling trend already underway. The STOXX US Index was the outlier, with short-horizon risk edging up slightly, from 15.0% to 15.4%.
The following table does not appear in the Equity Risk Monitors but is available on request.
A defensive rotation beneath the surface told by style factor returns
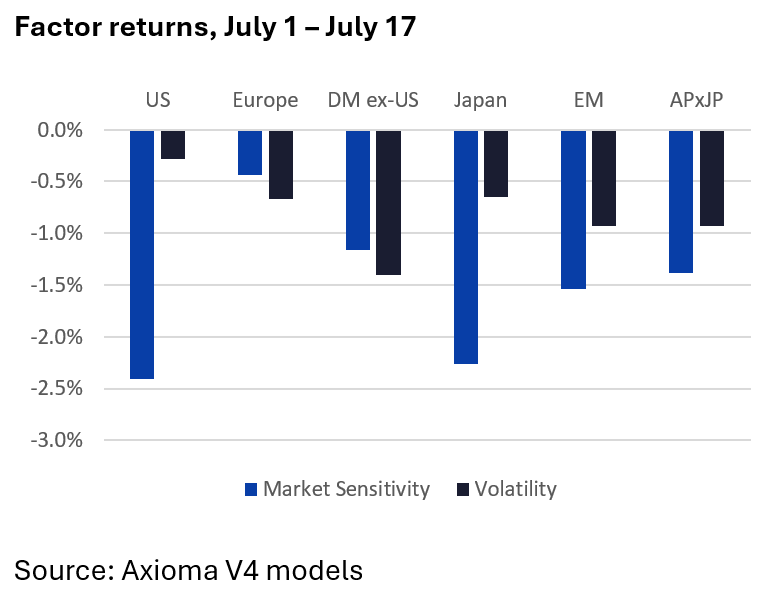
Style factor returns tell a clear story about what kind of week this was. Market Sensitivity, which captures a stock's beta to the broader market, logged a sharply negative return in the US (-2.41%) and Japan (-2.26%), and was also notably negative in Emerging Markets (-1.54%). That's a classic signature of a risk-off week, in which higher-beta, more volatile names underperformed while calmer, more defensive stocks held up better and reflects the continued rotation from Technology. Consistent with that read, Volatility's return was negative in the US (-0.28%) and more sharply so in EM (-0.93%), while Value posted modest gains in the US (+0.81%), EM (+0.12%) and Japan (+0.71%).
The following table does not appear in the Equity Risk Monitors but is available on request.
Info Tech's risk keeps climbing in several regions, even as headline risk falls
One thread carries over from recent weeks: Information Technology's predicted volatility continued to rise in several regions even as overall index risk eased. Info Tech sector risk increased in Europe (+2.4%), Developed Markets ex-US (+2.4%) and Emerging Markets (+1.4%) over the week, despite each region's overall risk moving lower. In other words, the sector most responsible for driving risk higher across regions over the past month hasn't fully cooled off, it has simply been offset by faster-easing risk elsewhere in those indices. Asia Pacific ex-Japan broke from this pattern, with Info Tech risk falling alongside the rest of the market (-2.2%), suggesting last week's pullback there was more broad-based than sector-specific.
Momentum’s reversal means some of its worst returns ever
After weeks of rising, EM and APxJP risk reversed last week amid a broad, defensively skewed pullback led by EM and Japan. This development is worth watching closely. If it proves to be a genuine turn rather than a one-week wobble, we'd expect to see Market Sensitivity and Volatility factor returns remain negative and breadth stay wide in the coming weeks. Conversely, if the risk of EM and APxJP resumes climbing while returns recover, last week may turn out to be no more than a pause in the broader story of tech-driven risk concentration we've been tracking.
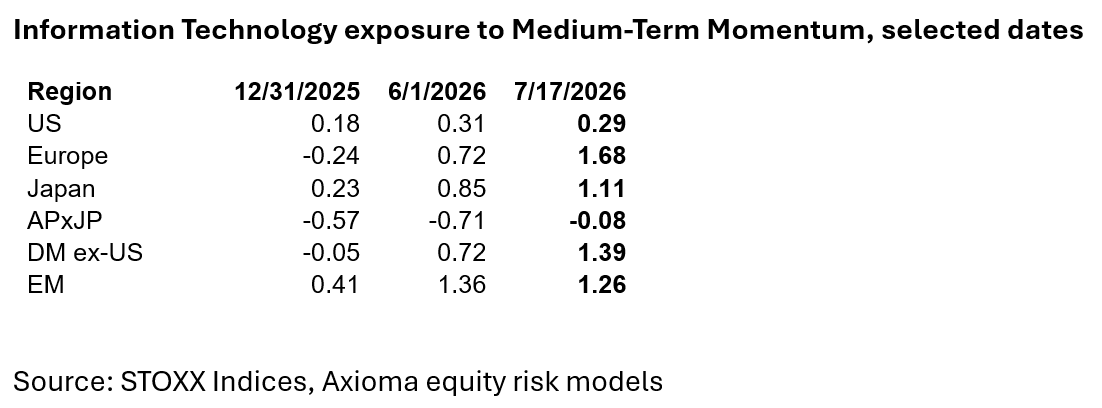
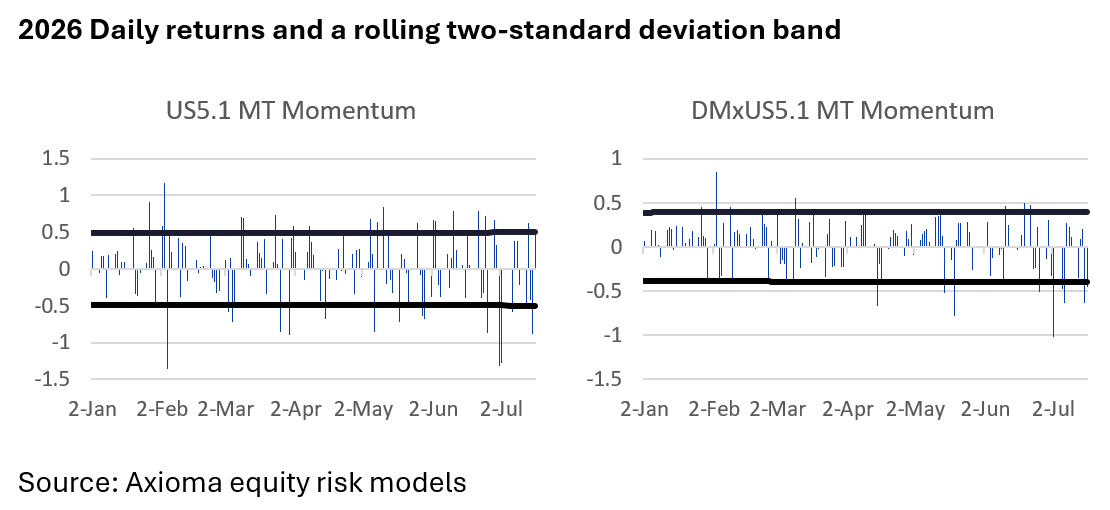
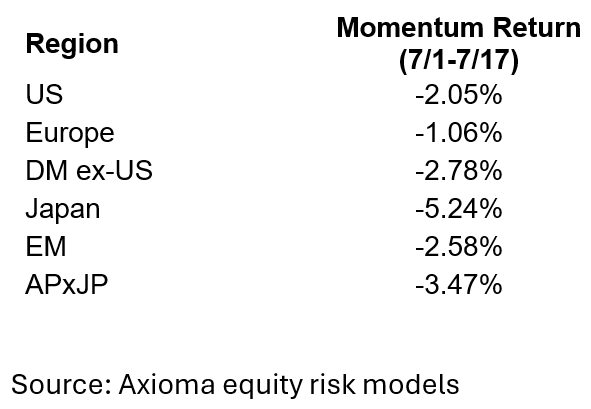
Through the first half of the year, Medium-Term Momentum produced unusually strong returns in most regions. The realized return was more than two standard deviations above the long-term average in the US, Asia ex-Japan, Japan, China, Developed Markets ex-US, Emerging Markets and in the Worldwide model (see our Quarterly Insight presentation for more detail). Its strength was largely fueled by the Tech trade. At the end of last year, Technology’s Momentum exposure was negative in Europe and Asia ex-Japan, and therefore Developed Markets ex-US followed suit. By the beginning of June, the exposure had increased substantially in every major region except Asia ex-Japan. That is also when Technology started to slide, bringing Momentum’s return down with it. The damage was largest in Japan, with a Medium-Term Momentum return of -5% from July 1 to July 17, but even the return of -3% in the US (using the Axioma US5.1 model) was among the worst of all 12-day periods since the model’s inception in 1982, (timespan chosen because there were 12 trading days in the US so far this month and since Momentum’s turnaround). This return falls into the bottom 0.5 percent. The daily return also fell outside a two-standard-deviation range in six of the 12 trading days in July, with most of those days among the 15% worst days.
Similarly, Momentum sank in the 13 trading days of July in the Developed Markets ex-US model, producing a return in the bottom 0.6 percent. The daily return fell in the bottom decile in five of the 13 days. And outside the US, Technology’s Momentum exposure continued to climb—it was negative at the end of 2025, 0.72 at the beginning of June, and 1.4 as of the end of last week. Momentum’s shortfall outside the US has an even stronger connection to the reversal of the Tech trade.
Since the most recent month is excluded from the calculation of Medium-Term Momentum, once we are through July— assuming the poor Momentum performance continue— we expect to see Momentum exposures in Technology fall as well, and possibly the return to profitability of investing in the factor.
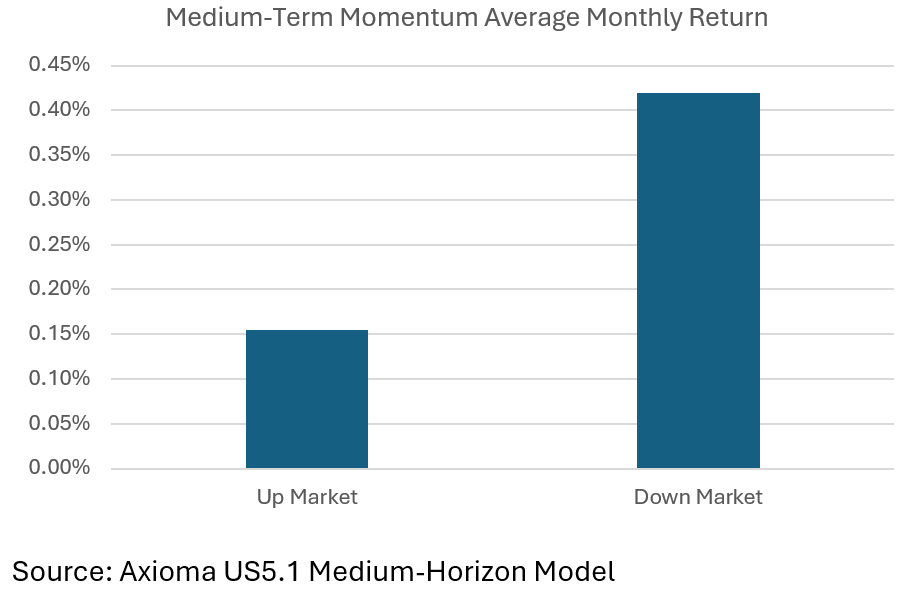
Finally, a feature (or possibly bug) of Momentum is that it is actually a better down-market strategy. While the US5.1 return has been positive on average regardless of market direction, its return has been almost three times higher when the market was falling. The difference in monthly returns is statistically significant. This is a concept we hope to explore further in the near future.
The following tables do not appear in the Equity Risk Monitors but is available on request.
You may also like


