

EQUITY RISK MONITOR HIGHLIGHTS
WEEK ENDED AUGUST 28, 2026
Clarity and Low Correlations
If nothing else, 2026 has been a year of competing narratives: AI capex vs. Software, Donald Trump vs. Abbas Araghchi, IT vs. Health Care, Rate cuts vs. Rate Hikes, DSA vs. everyone. Last week gave us some clarity on a few of these:
- NVIDIA’s earnings on Wednesday showed that for the most part, the AI capex story is alive and well- the earnings beat aside, the important number was the forward guidance for 70% revenue growth when the consensus was closer to 45%.
- Salesforce beat estimates by a mile, showing that enterprise software firms may actually be one of the biggest beneficiaries of the AI buildout, because they have the profitable applications that AI can enhance.
- Kevin Warsh’s Friday speech at Jackson Hole made clear that while he may take a more traditional, less interventionist approach than his immediate predecessors, he is very much keen on the long-run 2% inflation target, and while he won’t play games with “forward guidance”, probabilities of a rate increase before the end of the year shot up and the short end of the curve rose while the long end came down somewhat.
As far as the electoral and war narratives, we didn’t get much last week, but in general, markets around the world reacted positively as oil prices eased by about 5% on what looked like increased traffic through the Strait of Hormuz.
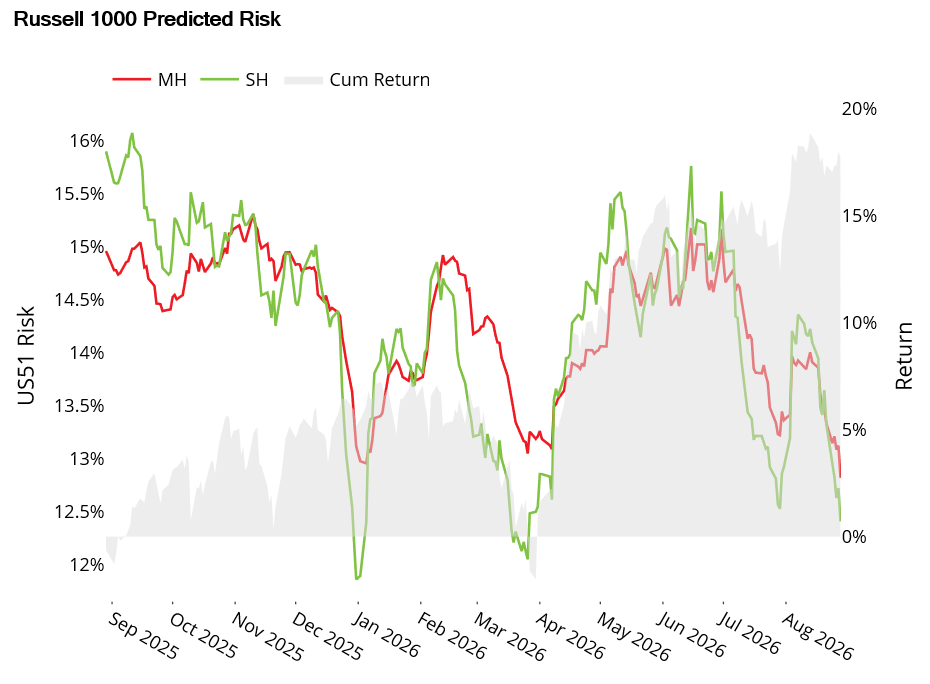
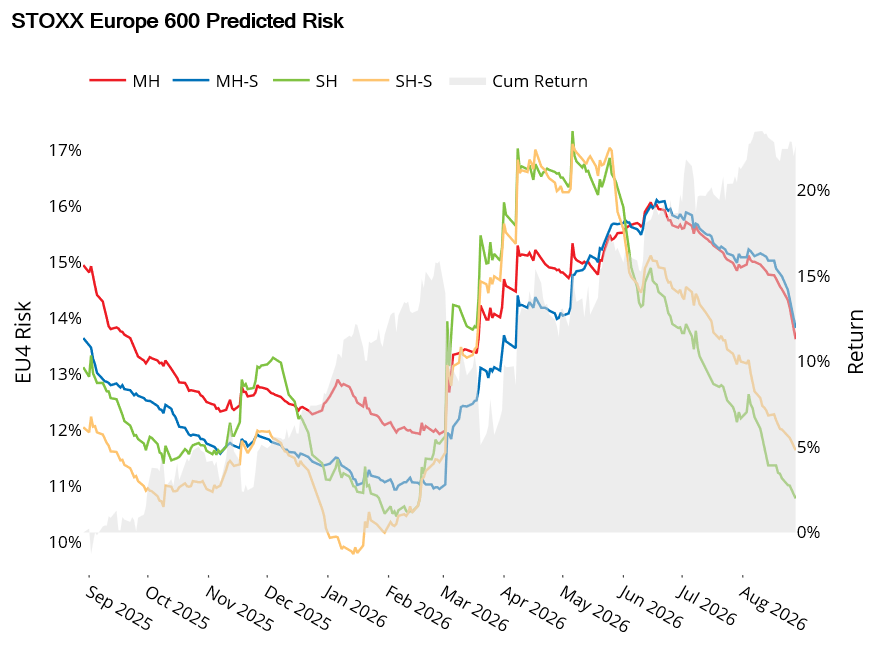
What isn’t so clear is what the risk models are telling us; as we’ve noted in these monitors the last few weeks, factor volatilities are at 12-month, and in some cases, historical highs, but the market risk forecasts remain subdued, even tracking lower:
See the following chart from the Russell 1000, STOXX Europe 600, STOXX Japan and STOXX Asia Pacific ex-Japan risk monitors as of August 28, 2026
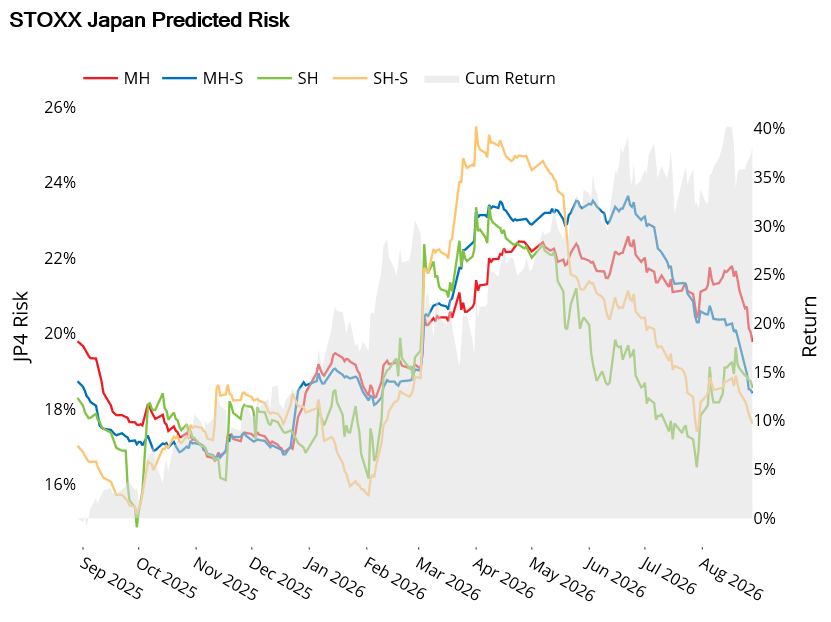
Japan is a bit apart from the rest of the developed world as they are actively reflating and the leadership there is in the financial sector as bank investors anticipate better net interest margins.
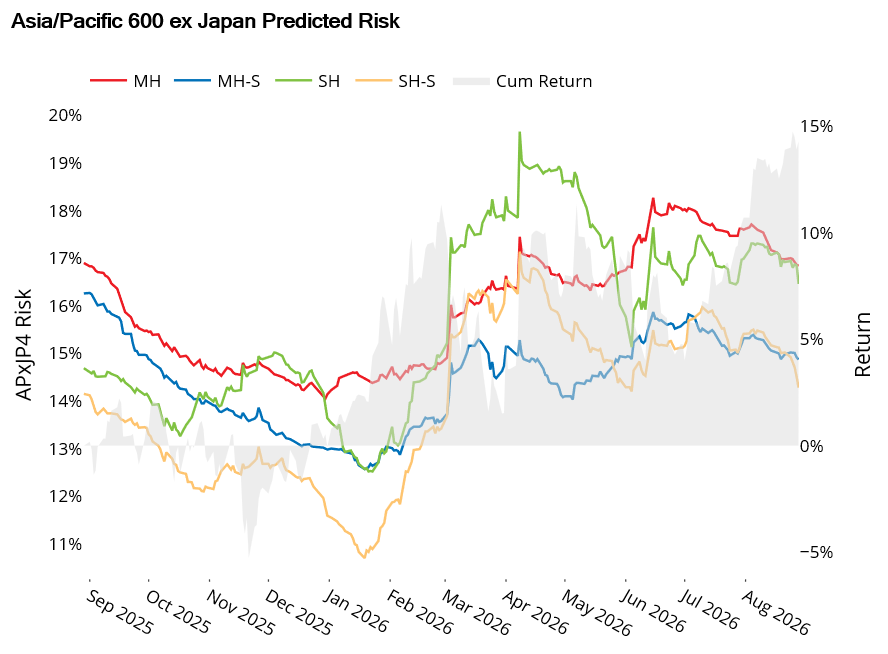
AP ex-Japan shows a milder risk downtrend, but it was quite significant last week.
So how is it that market volatility is going down or at least staying level as factor volatilities go higher and higher? The answer is that correlations are trending lower around the world- asset return correlations, that is, within each market:
The following charts do not appear in the risk monitors but are available upon request:
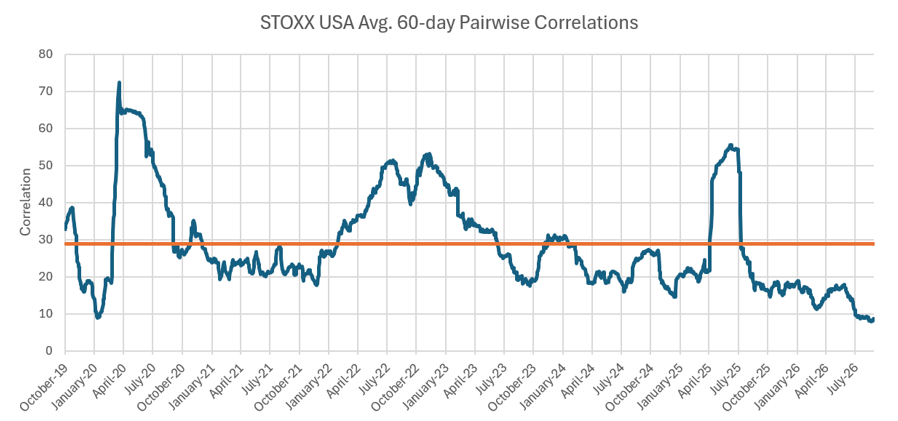
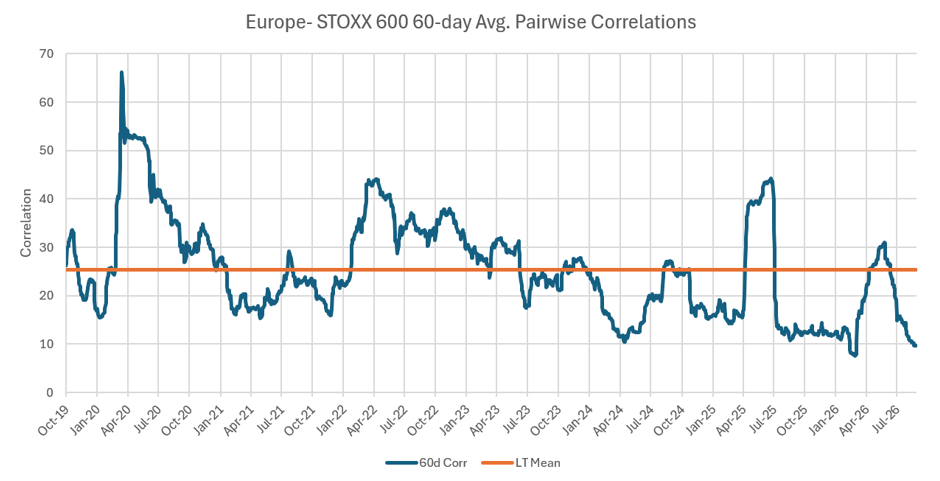
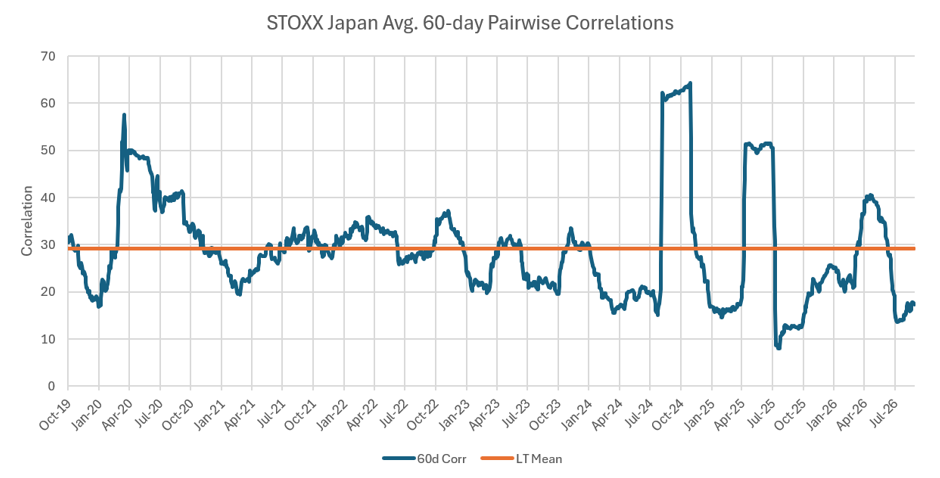
We track these pairwise 60 day (and 20 day) correlations in our equity risk monitors, usually shown in chart #12 with a 1-year trailing history for comparison. These charts above simply extend back to the beginning of the series and compare the levels over time with the long-term mean. This has a structural feel to it, as if something has meaningfully shifted in the way these businesses relate to one another. The long-term means for 60-day pairwise correlations are 0.29 in the US, 0.26 in Europe, and 0.29 in Japan, respectively. All within a reasonable range, and it’s even easy to understand why the European index would be slightly lower, since it is really an agglomeration of several national markets. But even with the somewhat frequent spikes in correlation around crises such as COVID, Ukraine, the 2022 interest rate shocks, “Liberation Day”, and the Iran conflict, the trend is clearly towards lower and lower correlations. The average pairwise correlation in the STOXX USA index over the last 60 days is just 0.085.
This means that dispersion is high- volatilities are high and correlations are low. It could be that the entire global economy is realigning in several different ways at once, with axes that have poles pulling in opposite directions. The sharp moves in one direction are cancelled by other companies going in the opposite direction. We won’t venture to put labels on these axes at this point, although we did find a significant one in our recent paper, “We Found the AI Factor, (and it was there along)”.The net effect, if one holds the market portfolio or something like it is relatively low overall volatility with high cross-sectional dispersion.
You may also like


