

The AI bubble: to be or not to be? That is not the question
Authors
Diana R. Baechle, Ph.D., Senior Principal, Investment Decision Research, SimCorp
Jordan Francis, Principal Solutions Engineer, Axioma Solutions, SimCorp
Why investors are asking the wrong AI bubble question
Throughout the spring of 2026, AI stocks have been the main market drivers, leading investors to ask the familiar question: are we in a bubble? However, the question that investors should ask is not binary but continuous: to what extent do I participate? To make an informed decision, managers must understand where returns are coming from and how risky that participation may be.
Mapping the AI ecosystem
To capture the breadth of participation in the “AI bubble,” we constructed a portfolio representing the broader AI ecosystem extending beyond high‑flying mega‑cap tech stocks. This portfolio includes companies whose returns move together due to direct or indirect exposure to AI developments, despite operating across different industries and lacking shared fundamental factor exposures.
We began by creating a universe of 80 Russell 3000 stocks that strongly outperformed in 2025 and have identifiable links to AI investment including AI software, hardware such as chips and GPUs, machine learning platforms, data analytics tools, and AI-driven enterprise solutions. Our set of names also includes businesses that support AI indirectly by providing power generation for data centers, networking and cooling equipment, semiconductor infrastructure, cloud and telecom providers, and REITs owning AI-related infrastructure.
We next systematically identified a clique of stocks within our 80-name universe whose idiosyncratic returns displayed the strongest rolling 30-day correlations since 2023. ¹ In short, our method procedurally adds names one at a time until our cohort’s mean correlation dropped below an 80 percent threshold. We chose our threshold so that our portfolio held a minimum of 30 names.
This process produced a basket of stocks concentrated across a handful of industries. The resulting “AI ecosystem” portfolio comprises 36 equally weighted names across 14 GICS industries, led by Semiconductors at 25 percent and Software at 17 percent. The portfolio was constructed as of November 2025 and our results beyond that date are out of sample.
Figure 1: AI ecosystem portfolio holdings across industries
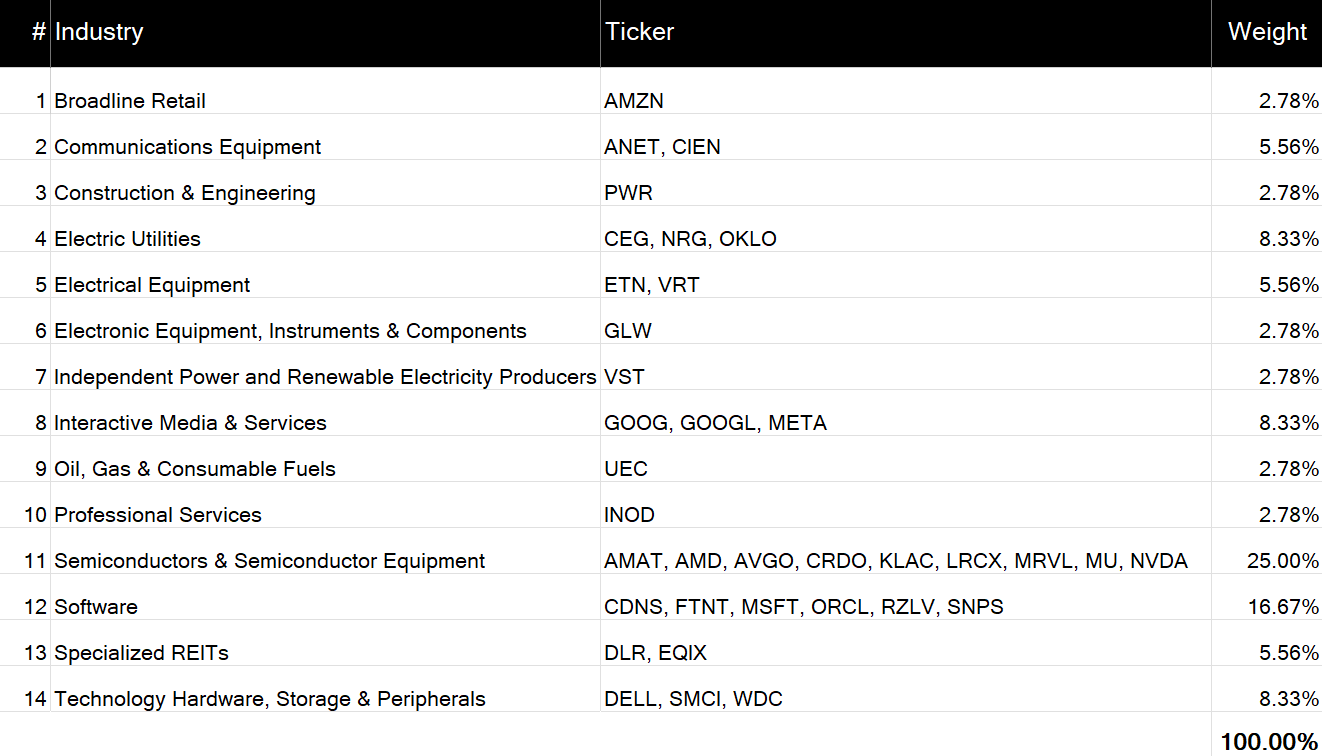
Source: Axioma
How the AI ecosystem portfolio delivered
Having established a coherent AI ecosystem, the next step is to evaluate how participation in this theme has translated into realized performance.
Since the beginning of 2026, participation in our AI ecosystem portfolio would have resulted in remarkable gains. The portfolio has delivered a 34 percent year-to-date (YTD) gain, outperforming the Russell 3000 by 28 percentage points so far this year.2 Since January 2023, cumulative gains exceeded 550 percent, outpacing the benchmark by nearly 470 percentage points.
Figure 2. AI ecosystem portfolio’s cumulative total vs. active YTD return
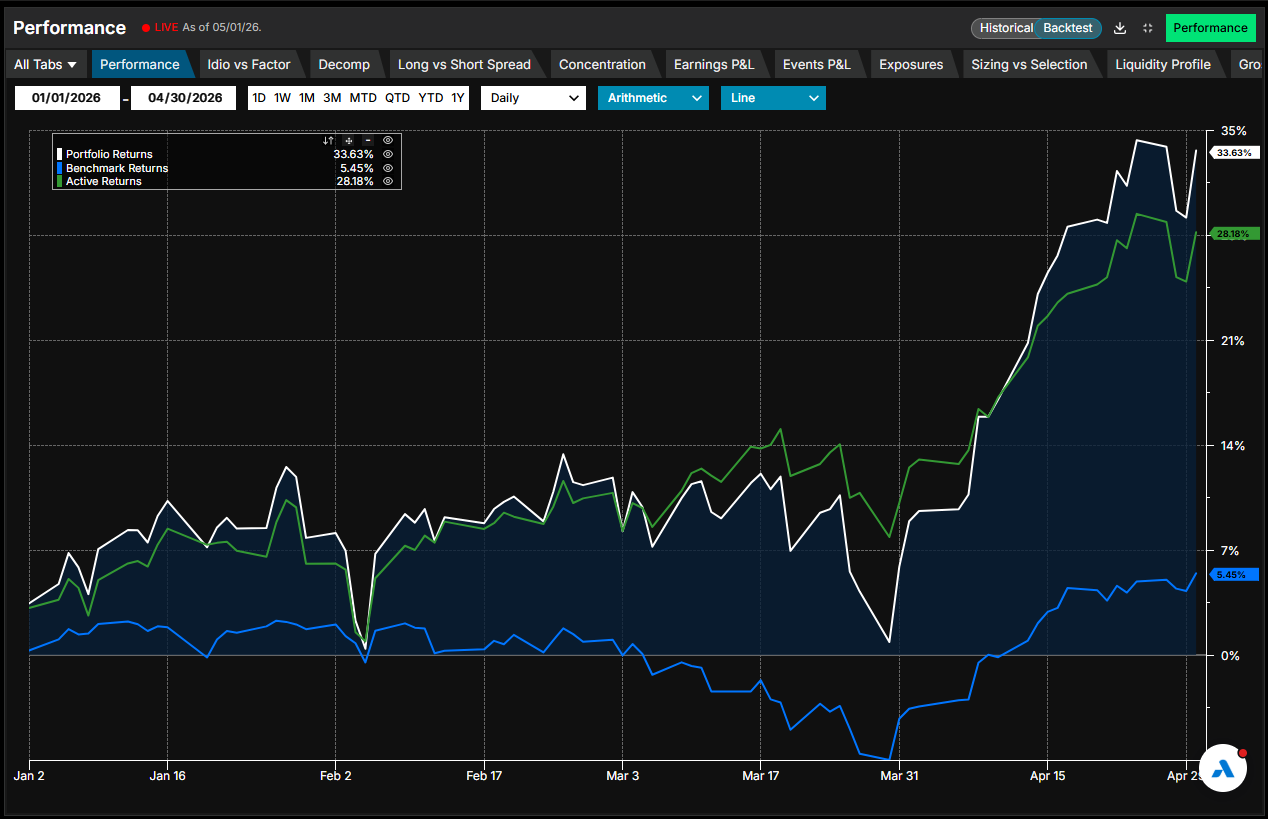
Source: Arcana, Axioma
This result should change how to think about ‘AI leadership’ since the largest proportion of the YTD return has not come from the mega caps generally associated with AI, but from companies with market capitalizations between $10B and $200B.
In both return and risk space, the AI theme is broader and more distributed than the size of the headline names might suggest.
Figure 3. Market capitalization group contribution to AI ecosystem YTD active return
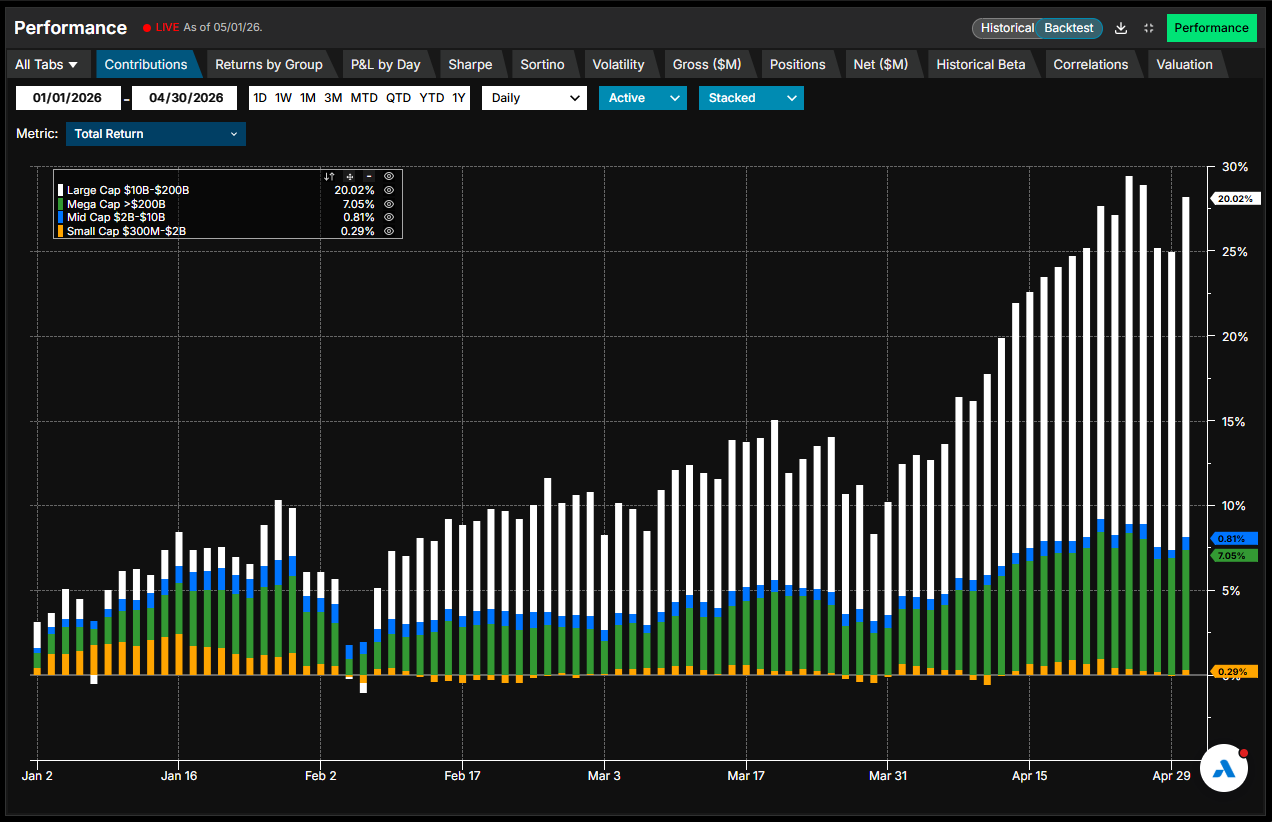
Source: Arcana, Axioma
Understanding the AI ecosystem portfolio’s return engine
Strong returns raise a more important question: what is actually driving them? We must ask if this portfolio is being rewarded for systematic exposures, idiosyncratic stock selection, or something else. In order to answer this question, we decomposed returns using the Axioma US fundamental trading-horizon risk model (US5.1-TH). Year-to-date, about 44 percent of the portfolio’s active return is attributable to residual returns, which is reasonable for an active portfolio.
Industry effects accounted for about 40 percent of the portfolio’s YTD active return, and style factors contributed roughly 16 percent. Semiconductors delivered the strongest positive contribution year-to-date, consistent with robust demand for chips and related components used in AI development.
However, Software was the main detractor. After providing consistently positive contributions over the prior three years, the industry factor’s performance reversed beginning in April 2025.
The Software factor’s reversal is important to note because it demonstrates that even within a powerful theme, leadership and tailwinds can rotate sharply. Thus, returns of the theme can remain strong even while one of the largest conceptual pillars of the narrative flips sign.
Figure 4. Factor return decomposition of AI ecosystem portfolio’s YTD active return
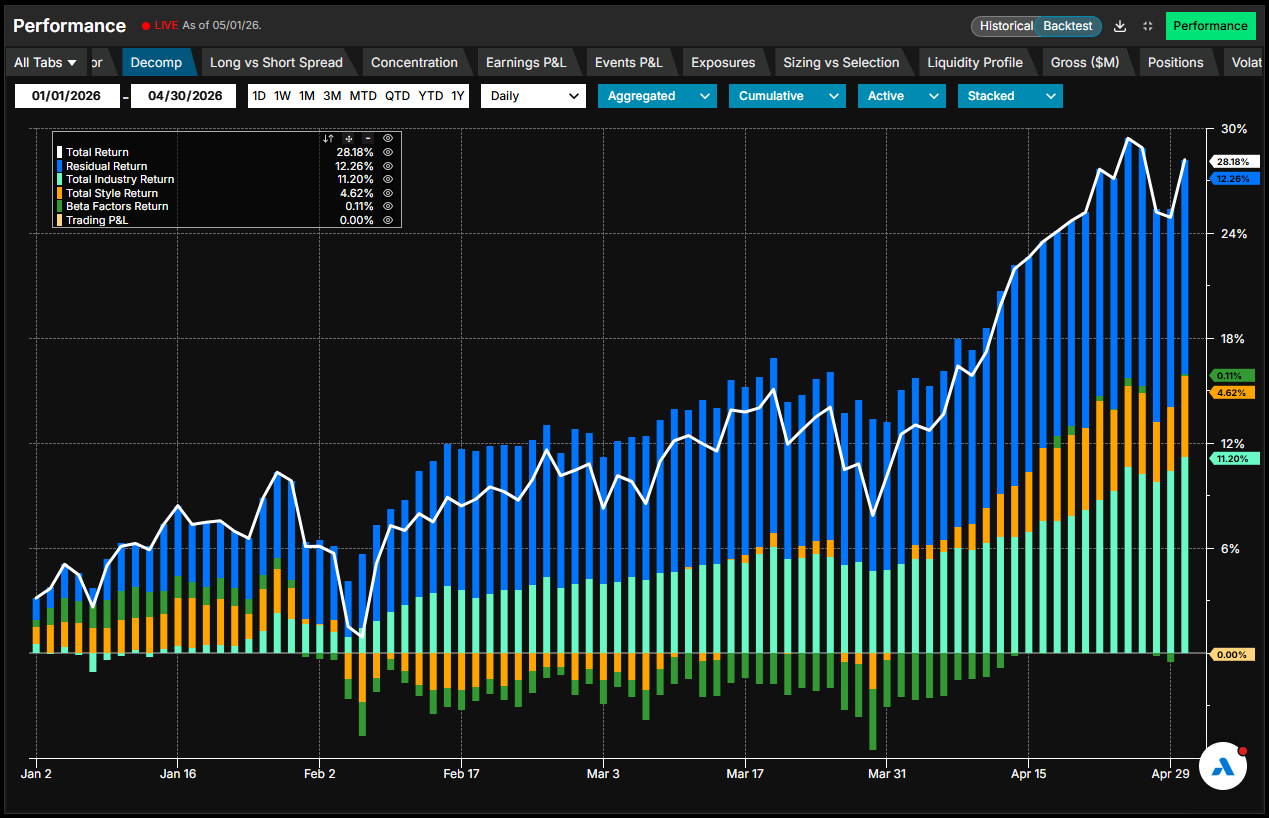
Source: Arcana, Axioma US Fundamental Trading Horizon Equity Factor Risk Model (US5.1 TH)
Stepping back to a longer horizon since 2023, a clearer pattern emerges. Despite Software’s reversal, the aggregate industry factor contributions have consistently added to portfolio outperformance. In contrast, aggregate style factor contributions have oscillated between negative and positive, reflecting rapid shifts in factor returns.
Within this shifting backdrop, style factors have exhibited particularly unusual behavior so far this year. The largest positive contributions to AI ecosystem’s YTD return have come from the positive exposures to Medium‑Term Momentum, Downside Risk, 1‑Day Reversal, and Short‑Term Momentum. However, the latter three factors generally carry negative risk premiums, so this tailwind may not persist.
Short‑Term Momentum, 1‑Day Reversal, and Downside Risk have something else in common, the idea of “reversal”, pointing to high underlying short-term volatility. This is the best the fundamental model can do at capturing the portfolio’s “excess” volatility, which would otherwise be diversified away in the residual.
Figure 5. AI ecosystem portfolio’s style factor exposures
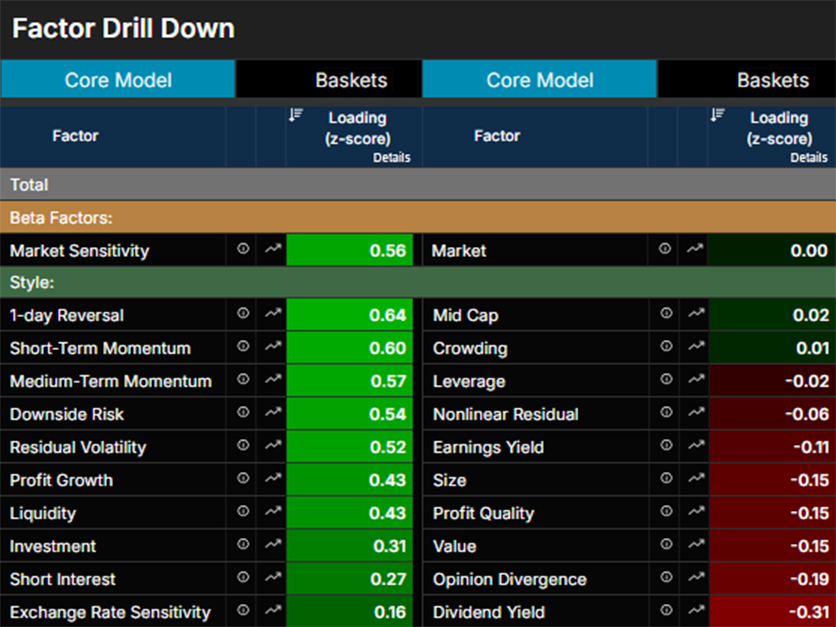
Source: Arcana, Axioma US Fundamental Trading Horizon Equity Factor Risk Model (US5.1 TH)
Identifying the theme beneath the AI ecosystem portfolio's returns
Understanding returns is only one side of the equation. The more difficult question is whether these shared dynamics represent a true “theme.”
Colloquially, investors refer to temporary drivers of returns like the AI bubble as “themes.” The idea of themes has existed for a long time without a formal definition and mostly has served as a term to describe a subset of investment products (e.g. portfolios of stocks) that show some commonalities. Unlike factors in a risk model which are broad and persistent, themes tend to be narrower in scope and transient in nature.3
In terms of a fundamental risk model, themes are temporarily reflected in excess idiosyncratic returns. This is consistent with our earlier observation that a substantial portion of the AI ecosystem’s return has been driven by idiosyncratic effects.
Nonetheless, what shows up as idiosyncratic risk in a fundamental risk model for a thematic portfolio could be captured by the dynamic factors of a statistical model. Analyzing the spread in model forecasts can help investors identify and quantify the volatility and correlation characteristics of a thematic portfolio that the fundamental model isn’t designed to capture.
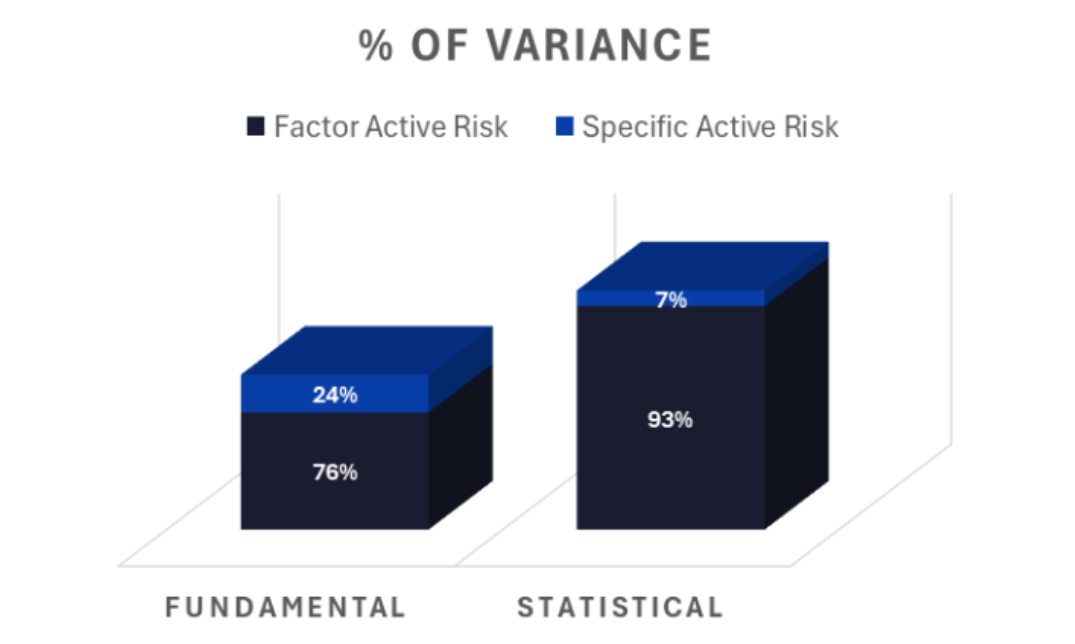
Indeed, as of April 30, 2026, the Axioma US statistical trading-horizon risk model (US5.1 TH-S) projected substantially higher active risk for the AI ecosystem portfolio than its fundamental counterpart (US5.1 TH).
More compellingly, statistical factors captured far more of the shared behavior across these companies. Aggregate factor contributions account for 93 percent of the statistical active risk forecast, leaving just 7 percent attributable to specific risk.
By contrast, the fundamental model estimates that only 76 percent of portfolio risk stems from common factors, with about a quarter of total variance driven by stock-specific risk. This divergence highlights the “theme” embedded in the portfolio being picked up by the statistically derived factors.
Figure 6. Specific Active Risk vs. Factor Active Risk (% of variance) as of April 30, 2026
Source: FTSE Rusell, Axioma US Fundamental and Statistical Trading-Horizon Equity Factor Risk Models (US5.1 TH, US5.1 TH-S)
To pinpoint where this difference originates, we drill down to the asset level, by comparing each active position’s contribution to active factor risk in both the fundamental and statistical models.
The table in Figure 7 is sorted in descending order by “Spread Contribution” and reveals that, crucially, the bulk of this hidden commonality comes not from the largest mega-cap names, which contribute negatively to the statistical‑fundamental factor spread, but from smaller companies dispersed across industries.
Figure 7. Asset-Level Active Factor Risk Spread Decomposition as of April 30, 2026
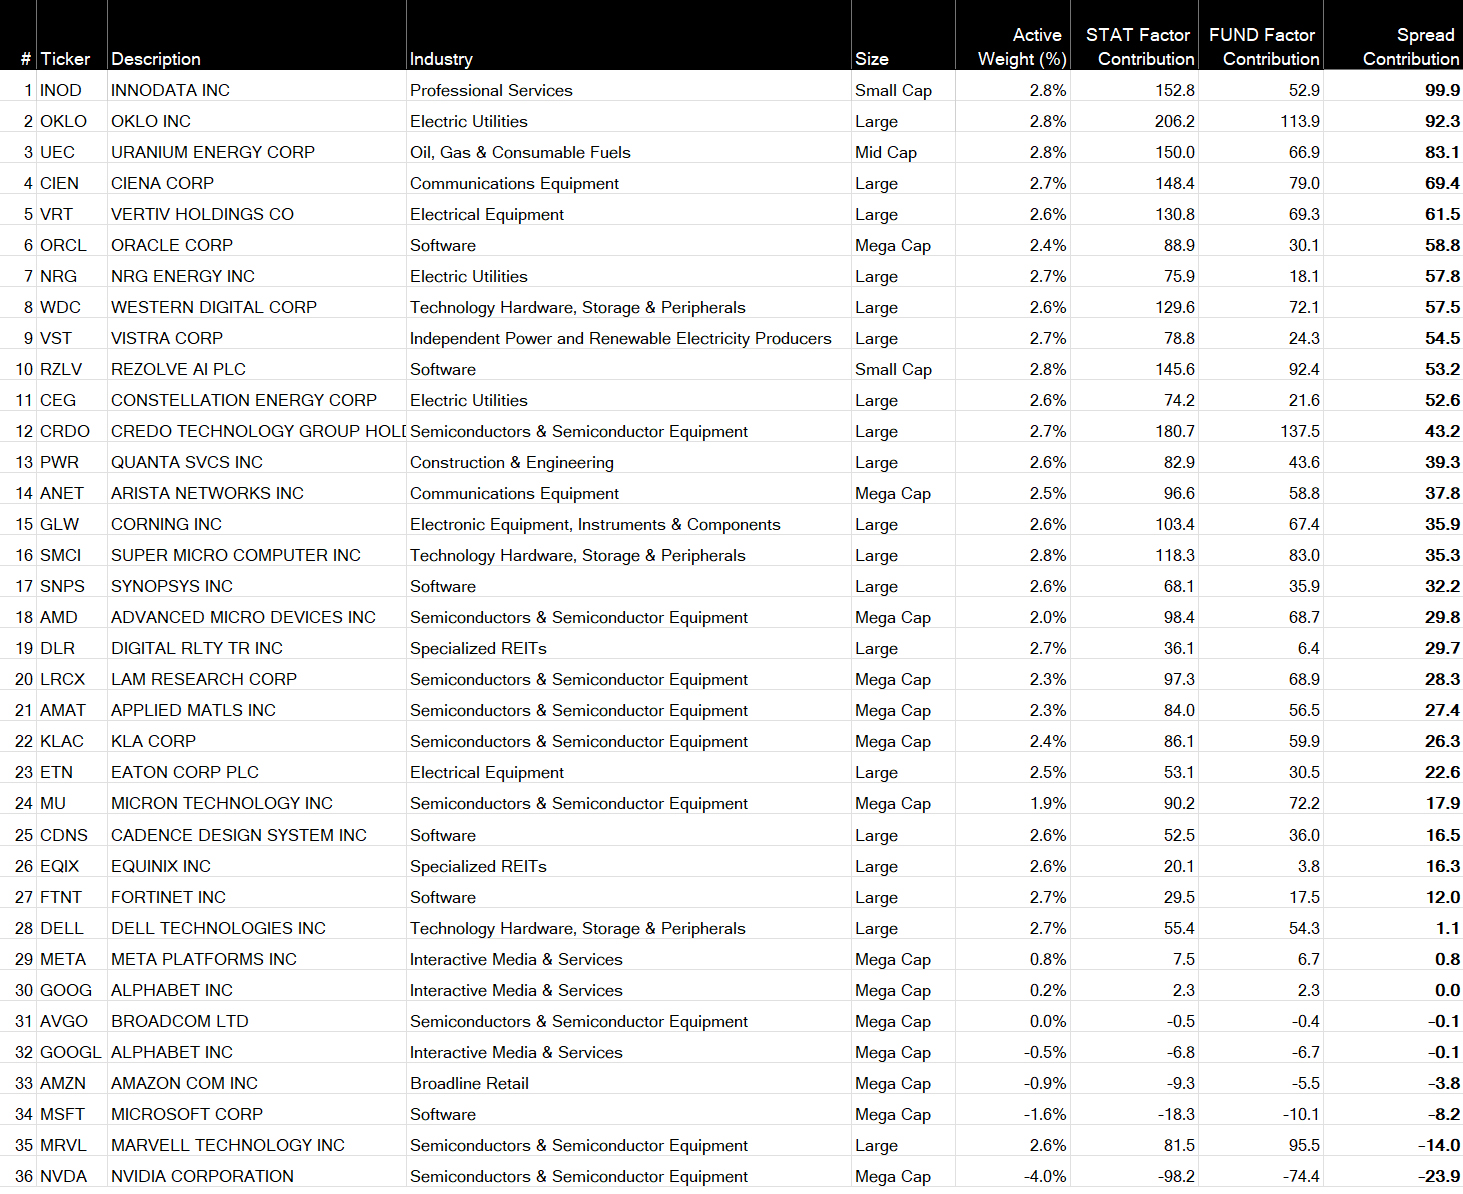
Source: FTSE Rusell, Axioma US Fundamental and Statistical Trading Horizon Equity Factor Risk Models (US5.1 TH, US5.1 TH-S)
A persistent risk model gap that points to a theme
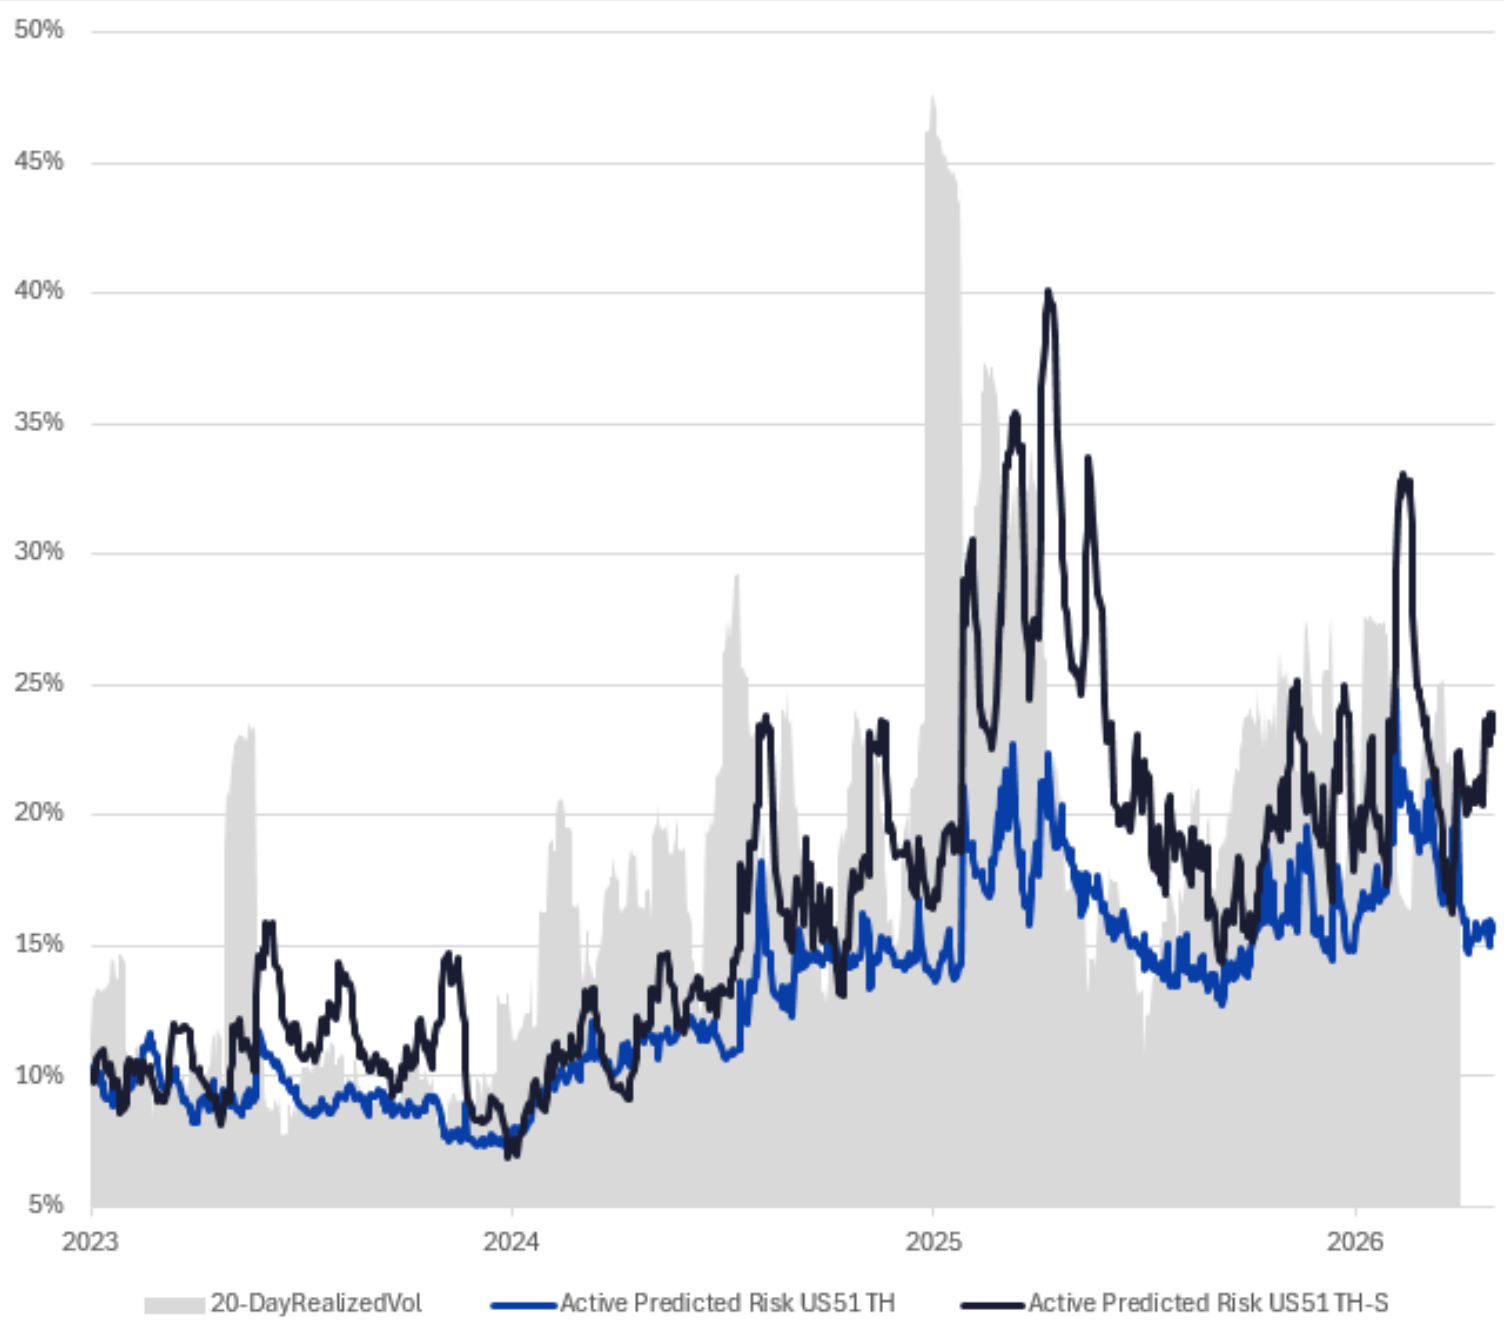
Over the past three years, statistical risk forecasts were consistently higher than the fundamental ones, indicating that for this portfolio, there is a common theme that the statistical model is picking up.
Additionally, the statistical model had better tracked the 20-day realized volatility of active returns, thus capturing the realized higher volatility of the portfolio.
The divergence becomes most pronounced during stress periods. In April 2025, the statistical forecasts spiked much higher than the fundamental forecasts, peaking around “Liberation Day,” when higher US tariffs were announced. This difference likely reflected the outsized implications of proposed tariffs for AI-related companies, including potential supply chain disruptions, constrained access to rare minerals, and limitations on advanced chip availability.
In 2026, we observe similar dynamics triggered by the Middle East crisis, with the spread peaking in March before moderating.
Figure 8. Active Predicted Risk
Source: FTSE Russell, Axioma US Fundamental and Statistical Trading Horizon Equity Factor Risk Models (US5.1 TH, US5.1 TH-S)
“Investors who replace binary bubble calls with a disciplined framework, one that separates participation, return drivers, and true diversification, are better equipped to navigate whatever comes next.”
From AI bubble debate to disciplined participation
The actionable question for investors is not whether AI is a bubble, but how to participate in the opportunity it presents especially as its influence widens to even more companies. As a result, investors must clearly identify and understand the risks involved. Viewing this participation via the AI Ecosystem portfolio offers several instructive lessons:
First, the AI trade is broader than headlines suggest from both a return and risk perspective. What appears diversified across industries is, in practice, a tightly linked exposure to common AI‑related forces.
Since 2023, AI returns have been powerful and persistent, with gains driven by a broad and distributed set of companies of various sizes rather than a narrow group of familiar mega‑cap tech leaders.
In terms of fundamental factor decomposition, the return drivers have evolved in unexpected ways, with style factor exposures pointing to likely reversals.
The existence of a coherent theme across the AI Ecosystem portfolio is evidenced by the persistent positive risk spread between statistical and fundamental forecasts, as well as by the higher share of factor risk captured by the statistical model.
The central challenge of the AI era is not avoiding participation but avoiding complacency. Themes this powerful rarely unwind in straight lines, and leadership can rotate even as the narrative remains intact. Investors who replace binary bubble calls with a disciplined framework, one that separates participation, return drivers, and true diversification, are better equipped to navigate whatever comes next.
Footnotes
- We begin the analysis in 2023 because ChatGPT launched in late 2022 and 2023 marks the first year AI adoption began scaling more broadly.
- Analysis as of March 30, 2026.
- Candès et. al (2025)
Related content


.png%3Fh%3D810%26iar%3D0%26w%3D1080&w=3840&q=75)