
the factors fueling small cap strength
From overlooked to overperforming
The decisive market rotation out of crowded large caps and into long neglected small caps may be more than a temporary rally and could mark the beginning of a structural shift.

Author
Diana Baechle
Senior Principal Investment Decision Research, SimCorp
The factors fueling small cap strength
- Four sectors – Financials, Industrials, Information Technology, and Consumer Discretionary – drove most of the outperformance of small caps.
- This was supported by attractive valuations, strong momentum, and reversals in the Size and Short Interest factors.
- Large caps, by contrast, were weighed down by idiosyncratic setbacks among several heavyweight names and a broad loss of momentum across sectors, not just within megacap tech.
- Meanwhile, the Russell 2000’s relative risk remains close to its long-term norm.
Small caps are making headlines, but understanding the structural drivers behind their outperformance – and whether it is sustainable – requires a deeper look.
In this study, we begin by examining the macroeconomic environment in which small cap companies are operating – and, in many cases, benefiting. We then analyze which sectors have driven the Russell 2000’s year-to-date outperformance using Brinson attribution. In particular, we assess whether stronger gains within certain small cap sectors relative to their large cap counterparts were the primary driver, or whether index holding differences, namely the distinct sector weightings of the Russell 2000 versus the Russell 1000 played a larger role. (Spoiler: it was both.)
Next, we evaluate the underlying economic conditions supporting the key sectors that contributed most to the Small Cap index’s strength.
We then turn to what risk models reveal about the contribution of Industry, Style, and Residual factors to the Russell 2000’s active return, where we find model-based confirmation of significant industry contributions to return.
We also drill into the style factor effects that were particularly impactful for small caps: the reversals of the Size and Short Interest factors, the emerging upside trajectory of Value, and strong momentum within specific small cap sectors, all of which contributed meaningfully to performance.
On the risk side, we compare the current risk characteristics of small caps versus large caps to assess whether they align with expectations (and indeed, they do). Finally, we take a deeper look at factor versus residual contributions to risk in both the Russell 2000 and Russell 1000, examining whether the statistical model is capturing trends that the fundamental model may be overlooking, particularly within the large cap universe.
Why macro favored small caps
The macro backdrop meaningfully advantaged small caps. They have heavier exposure to the resilient US domestic economy, greater sensitivity to the Federal Reserve’s three rate cuts in 2025, and entered 2026 at deep valuation discounts that encouraged rotation out of expensive large caps. Policy tailwinds from 2025-2026 fiscal and regulatory shifts further favored smaller, US-focused firms.
Where the performance came from
Year-to-date1, the Russell 2000 has outperformed the Russell 1000 index by roughly 6 percentage points, with about 2 percentage points from sector allocation and 4 percentage points from stock selection. The most influential sectors were Financials, Industrials, Information Technology, and Consumer Discretionary. Notably, Financials, Info Tech, and Consumer Discretionary delivered gains in the Russell 2000 while posting losses in the Russell 1000.
Materials and Energy also helped, as they not only outperformed inside the small cap index but also carried higher relative weights that amplified the Russell 2000’s year-to-date advantage. Industrials delivered the single largest sector contribution, due to both stronger gains and heavier representation in the Russell 2000.
Sector YTD Performance
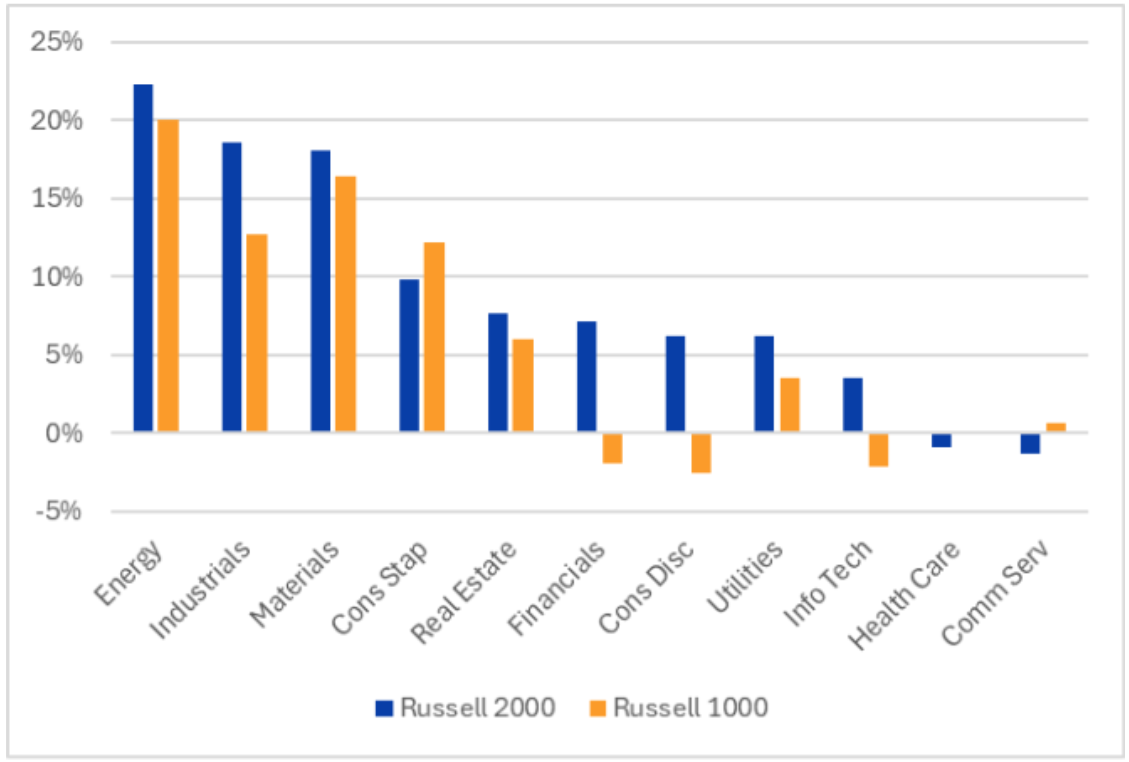
Source: FTSE Russell, Axioma Portfolio Analytics
Sector Contribution to Russell 2000 Outperformance
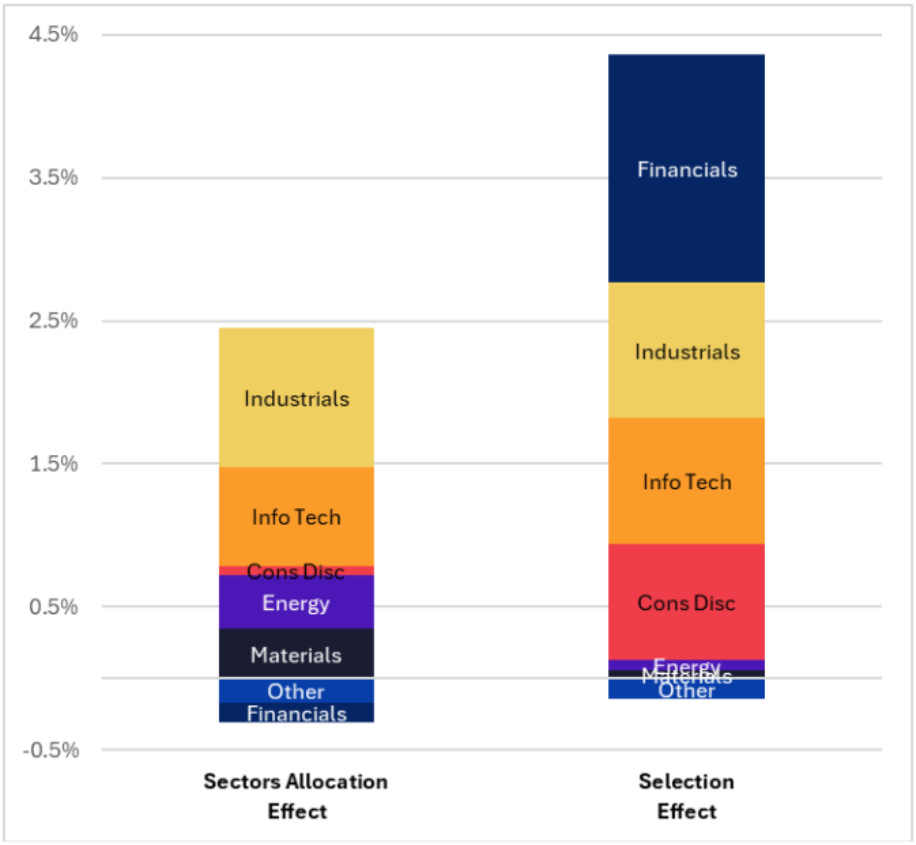
Source: FTSE Russell, Axioma Portfolio Analytics
Deep dives on sector economics
Financials
The gap between Russell 2000 and Russell 1000 Financials reflects differences in business mix, rate sensitivity, and policy exposure. Small cap Financials, dominated by regional and community banks, niche lenders, and smaller insurers, benefited quickly from late-2025 rate cuts, which reduced funding costs and improved net interest margins. Their fortunes are closely tied to domestic activity and small business lending, both of which strengthened in 2026.
Large cap Financials rely more on global banking, asset management, and capital markets, areas that recovered more slowly. Weak M&A and IPO pipelines, challenges among megacap card issuers, and declines in major crypto-exposed firms further weighed on the large cap cohort, pressures that were less relevant for small cap lenders.
Industrials and Materials
Small cap Industrials and Materials outperformed large caps due to direct exposure to a US manufacturing upturn, policy incentives, and rate relief. The late-2025 OBBB Act delivered targeted subsidies, tax advantages, and streamlined permitting that disproportionately benefited smaller firms tied to reshoring, infrastructure, and AI-related construction. Specialty contractors, equipment makers, and pureplay materials producers sit at the center of new factory builds, datacenter expansion, and regional infrastructure projects.
With higher operational leverage and more floating-rate debt, small caps saw faster margin expansion as rates fell, while global, fixed-rate peers captured less of the domestic demand surge. M&A activity also accelerated, as large industrials sought to “buy growth,” lifting premiums for innovative small cap manufacturers.
The Materials sector in the Russell 2000 benefited from stronger domestic demand in aggregates, metals, and chemicals, aligning more closely with reshoring and infrastructure than globally oriented large caps.
Information Technology
Small cap tech led partly because it entered 2026 at materially cheaper valuations with a mix better suited to the market environment. As investors rotated away from expensive megacap software and the “Magnificent 7” in the Russell 1000, small cap tech experienced less drag due to lighter software exposure and higher weights in hardware, equipment, and niche services.
As the AI investment cycle matured, attention shifted from megacap infrastructure providers toward specialized enablers of AI deployment. The Russell 2000 hosts more of these firms, including hardware subsystems, power management, and data center adjacent technologies. M&A further buoyed small cap valuations as larger companies acquired innovative IP at attractive prices, often at notable premiums.
Consumer Discretionary
Small cap Consumer Discretionary, composed of more traditional businesses such as restaurants, specialty retail, and home improvement, benefited from reshoring and infrastructure activity catalyzed by the 2025 fiscal policy.
Tariffs have been a headwind for US Consumer Discretionary broadly, as it is one of the sectors most affected in terms of higher cost structures. Tariffs and trade policy disproportionately hurt large, globally sourced discretionary companies, pulling down the Russell 1000 sector through margin pressure and weaker tariff-sensitive subindustries.
While not entirely insulated, the Russell 2000 discretionary cohort is made up of more domestically focused and less import-intensive companies, enabling many to avoid some of these cost pressures or even benefit from import substitution. As a result, their stock performance tends to be driven more by domestic growth and interest rate dynamics than by tariff risk.
Energy
Global tensions and protectionist undercurrents created uncertainty for large cap integrated energy firms, while small cap producers benefited from stable US demand and localized supply chains.
Onshore shale operators, regional pipelines, and US natural gas infrastructure faced fewer international and regulatory pressures than large global peers. Mixed results among integrated majors in early 2026 contrasted with nimble small cap producers that capitalized on short-term price spikes and regional dislocations. Winter Storm Fern, which spurred a surge in residential natural gas demand, disproportionately aided regional suppliers rather than global firms focused on refining and longer cycle LNG projects.
Relative risk is typical
From a risk perspective, forecasted volatility for Russell 2000 and Russell 1000 indices nearly converged last May, based on the Axioma US5.1 fundamental short-horizon model. While predicted volatility has declined for both, small caps have become relatively riskier. The Russell 2000 is now about 23% riskier than the Russell 1000, a typical level of relative riskiness, situated near the long-term median of the ratio between small and large cap forecasted risk.
Ratio of Russell 2000 to Russell 1000 US5.1 Fundamental Short-Horizon Risk
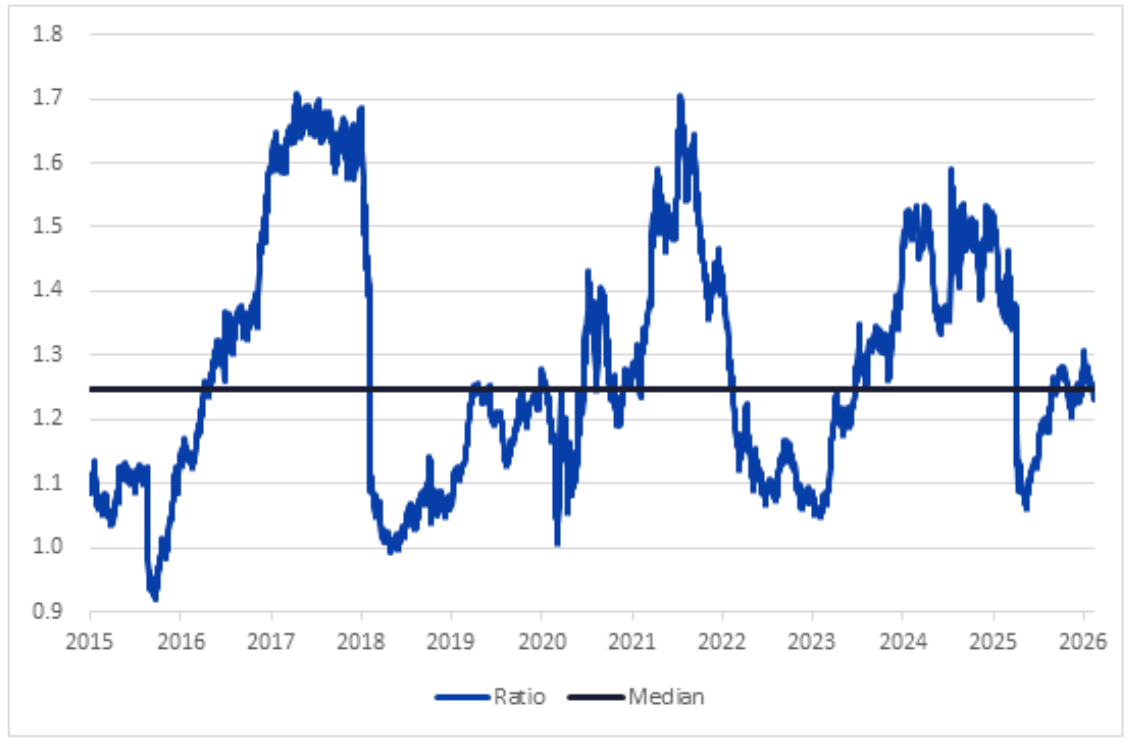
Source: FTSE Russell, Axioma US5.1 Factor Risk Model
What the models reveal – beyond the headlines
Using the Axioma US5.1 fundamental short-horizon model, we can parse the year-to-date drivers of the Russell 2000’s active return across the Style, Industry, and Residual factors.
The largest contributing factors to the Russell 2000’s outperformance have been: Industry (1.9 %), Residual (1.5 %), and the following Style factors: Size (1.8 %), Value (1 %), Short Interest (1 %), and Momentum (0.7 %).
In aggregate, Industry contributions were positive for both indexes, but much larger in the Russell 2000 (about 2 %) than in the Russell 1000 (about 0.2 %).
Idiosyncratic stock movements (firm-specific news and events) made a surprisingly large negative contribution to Russell 1000 returns. This is reflected in the strongly positive contribution of the Residual factor to the Russell 2000’s relative return. A typical interpretation of the negative Residual Return contribution for large caps is that several heavyweight names, including Apple (AAPL), Nvidia (NVDA), Broadcom (AVGO), JPMorgan Chase (JPM), and Qualcomm (QCOM), declined due to company specific developments rather than macroeconomic conditions. As we will see in the analysis below, some portion of this contribution may in fact reflect a trend not captured by the fundamental factors.
Style factors had a large aggregate positive effect on the Russell 2000 (3%) and essentially zero effect on the Russell 1000. Size, Value, Short Interest, and Momentum style factors produced the largest positive contributions for the Russell 2000 and the largest negative contributions for the Russell 1000.
Factor Contribution to Russell 2000’s YTD Active Return
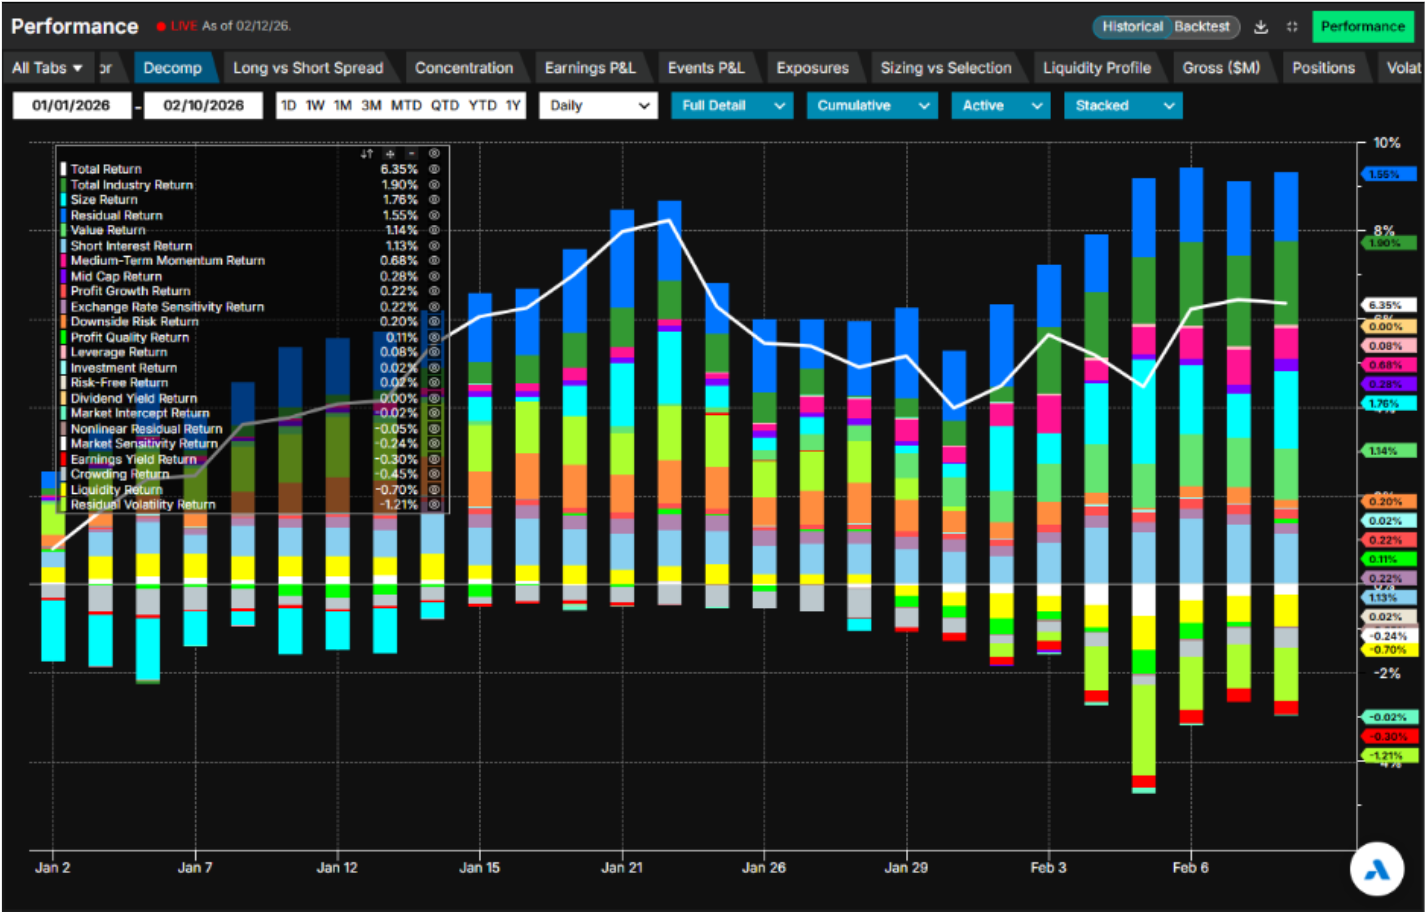
Source: Arcana, Axioma US5.1 Factor Risk Model
"While large caps face idiosyncratic headwinds and mounting global economic, geopolitical, and regulatory pressures, small caps are benefiting from a “Goldilocks” mix of domestic growth, improving credit conditions, and rising acquisition interest."
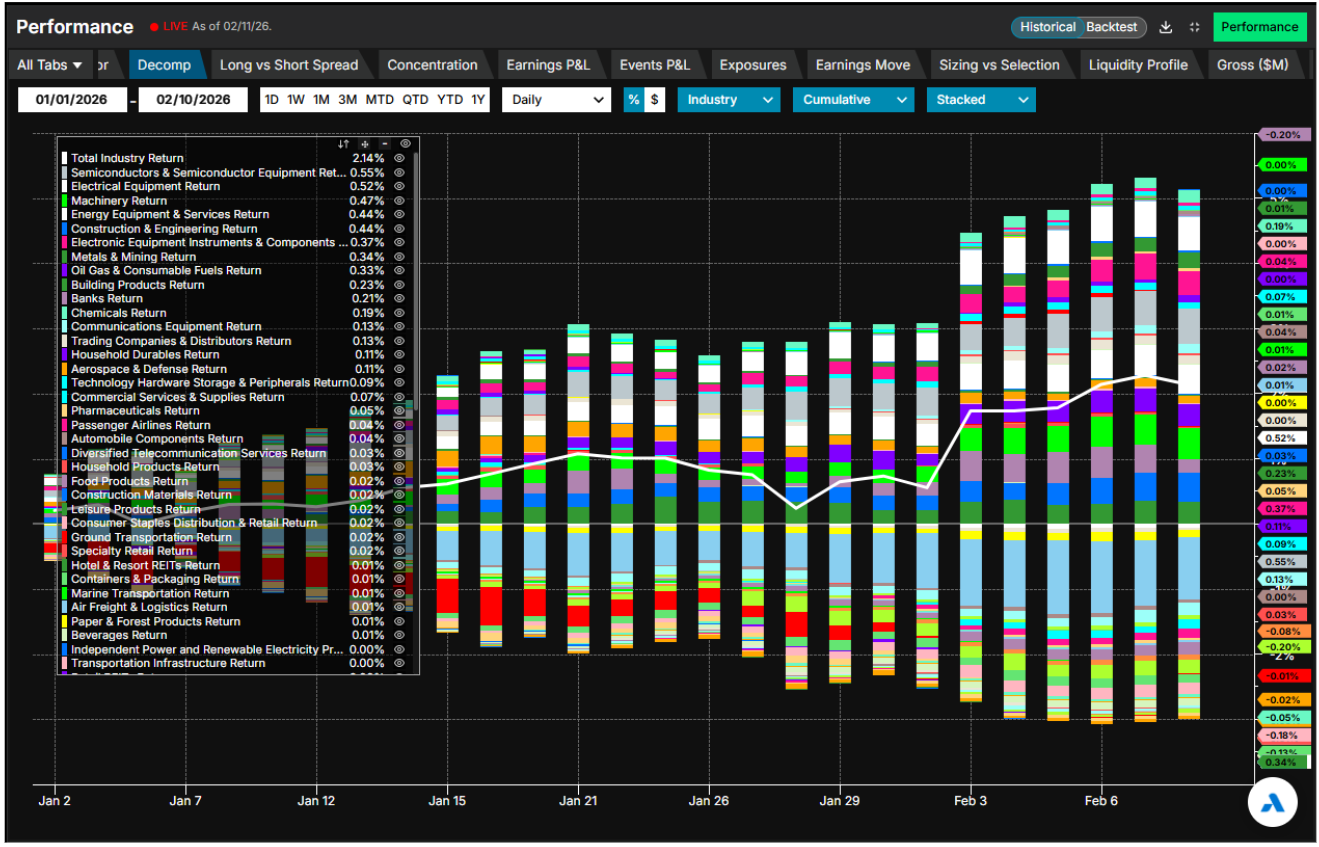
Industry effects
Within the Russell 2000, smaller declines in Software were more than offset by strength in Semiconductors and Electronic Equipment (part of Information Technology) and in Electrical Equipment and Machinery (Industrials).
In contrast, in the Russell 1000, large declines in Software and in Interactive Media & Services (Communication Services) were just barely offset by Semiconductors and Technology Hardware (both part of Info Tech), leaving industry’s contribution near zero in aggregate.
Industry Contribution to YTD Return: Russell 2000
Industry Contribution to YTD Return: Russell 1000
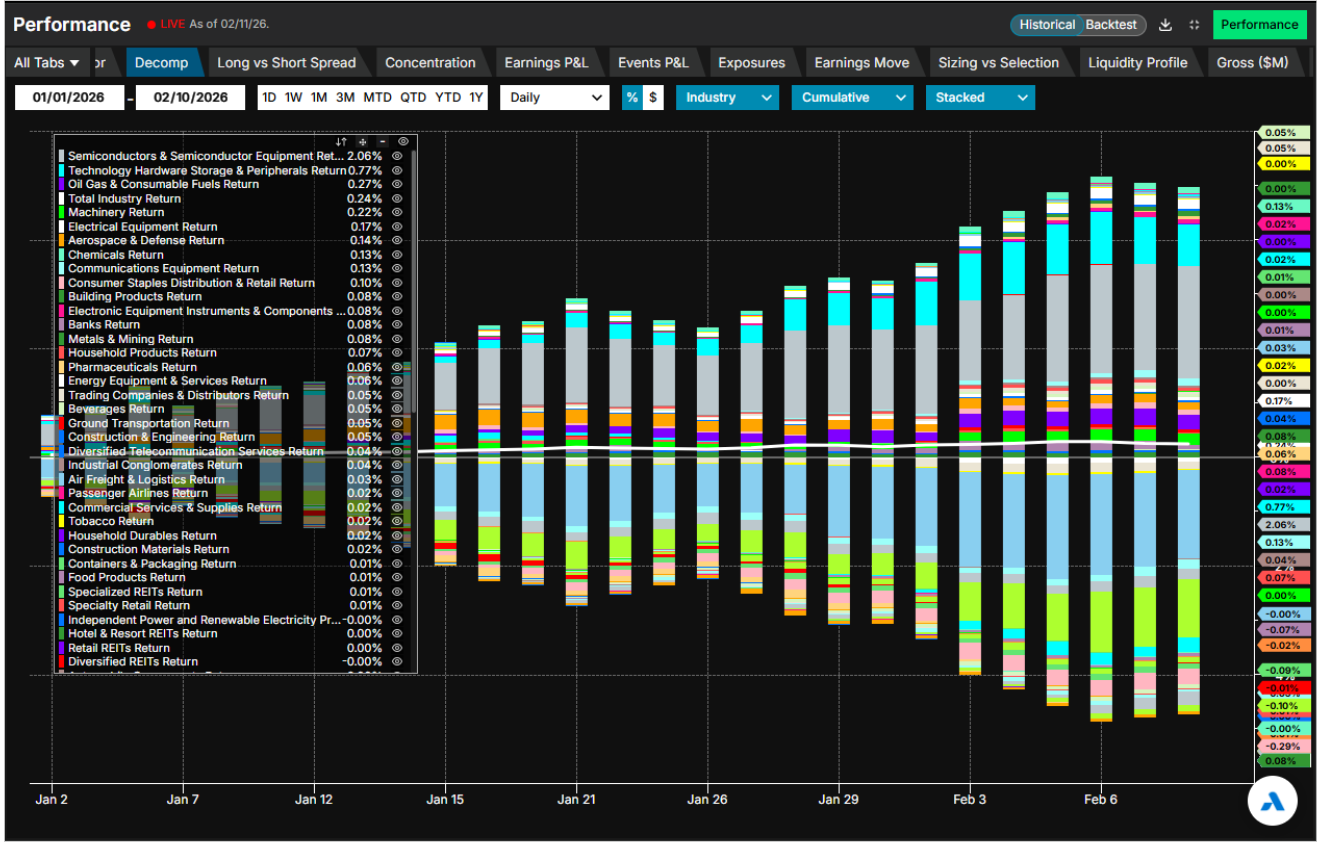
Source: Arcana, Axioma US5.1 Factor Risk Model
Style factor effects
Size
After three years of exceptionally strong positive returns, Size is finally showing a reversal back toward its typical negative return, reflecting investors’ renewed preference for smaller companies. The reversal is especially striking given that in 2025 alone Size posted a positive annual return nearly four standard deviations in the opposite direction.
It is worth noting that the Russell 2000’s positive return was not necessarily driven by the negative return of the Size factor. Rather, the Size factor likely showed a negative return because the Russell 2000 performed well for the macroeconomic reasons discussed earlier.
Size 3-Year Return vs YTD Return
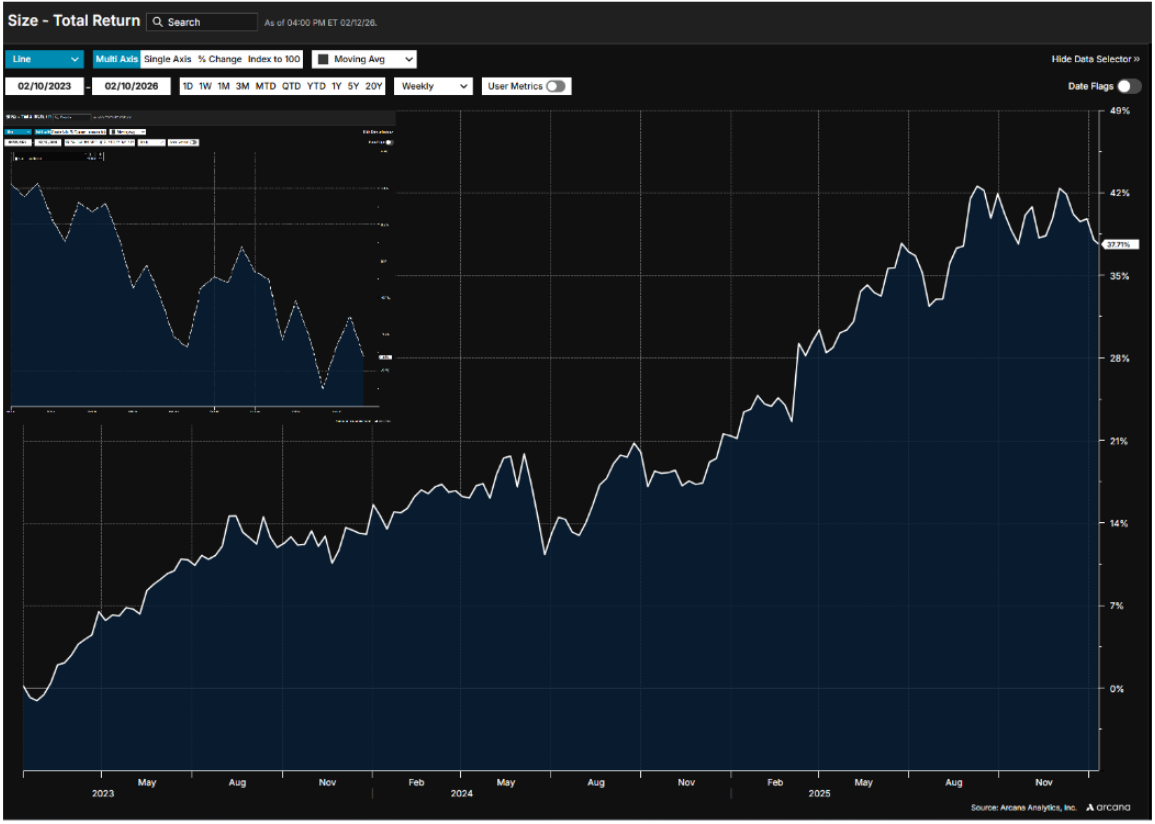
Source: Arcana, Axioma US5.1 Factor Risk Model
Size Historical Return
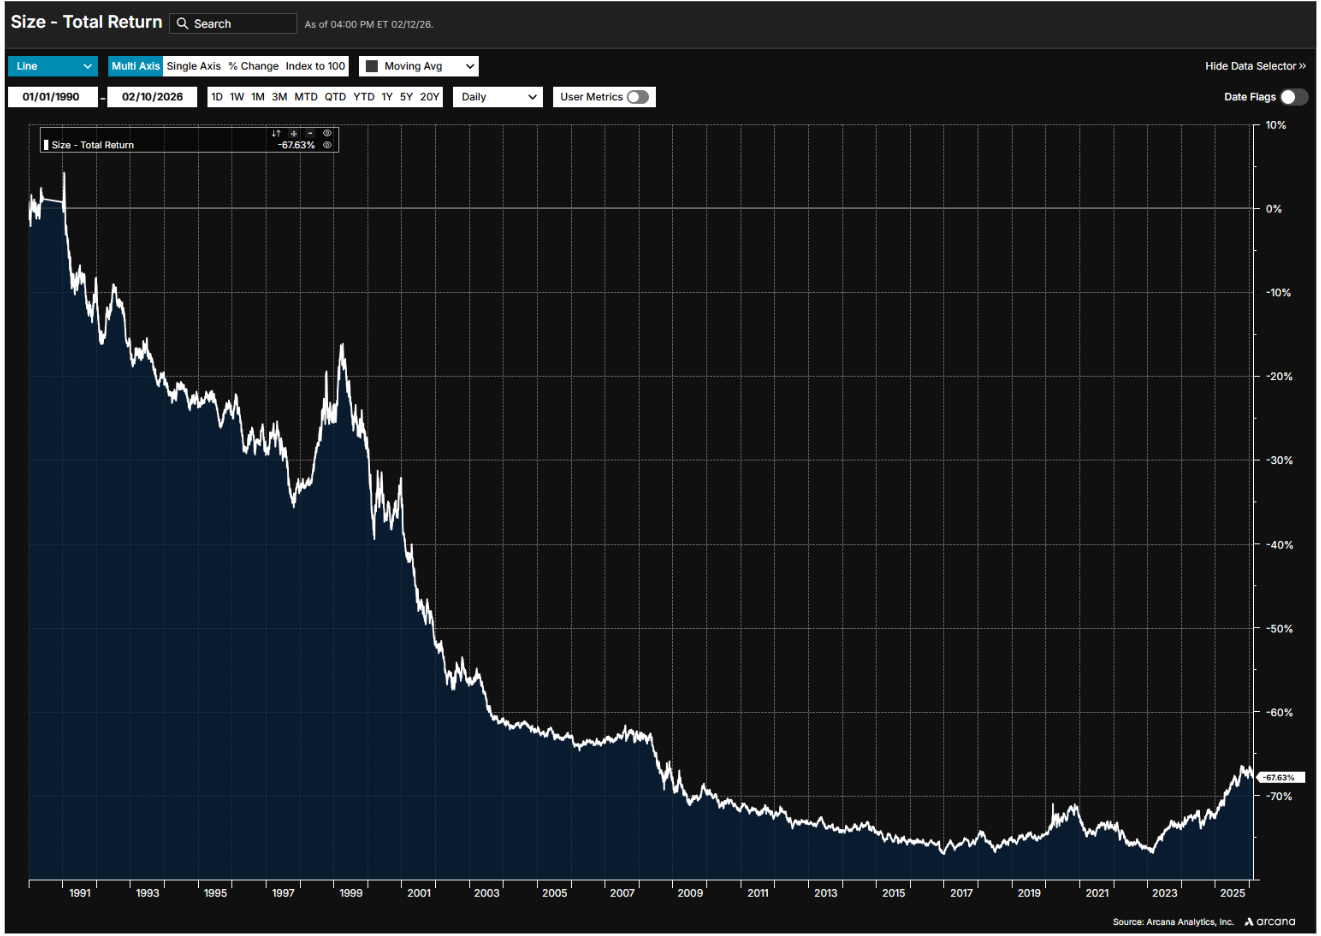
Source: Arcana, Axioma US5.1 Factor Risk Model
Value
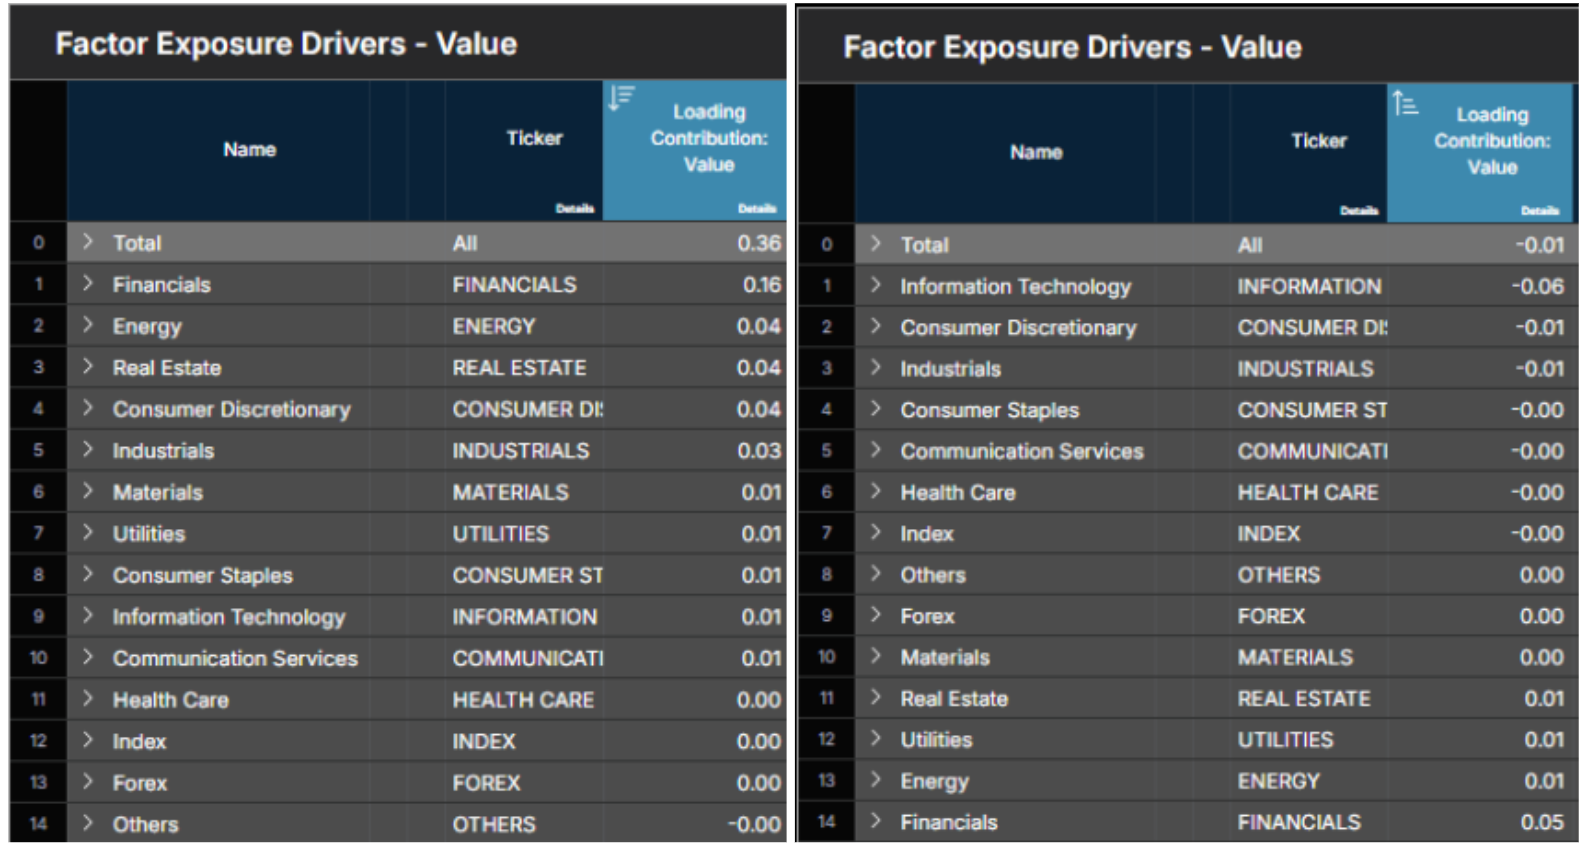
The Russell 2000’s positive Value exposure, driven by Financials and Energy, added roughly 1% to the index total return in 2026. The Russell 1000’s negative Value tilt, concentrated in Information Technology and Consumer Discretionary, detracted.
Since the two indices together account for nearly the entire model estimation universe, one would expect that if one has a positive exposure, the other would exhibit a negative exposure.
Value Exposures by Sector: Russell 2000 (left), Russell 1000 (right)
Source: Arcana, Axioma US5.1 Factor Risk Model
Momentum
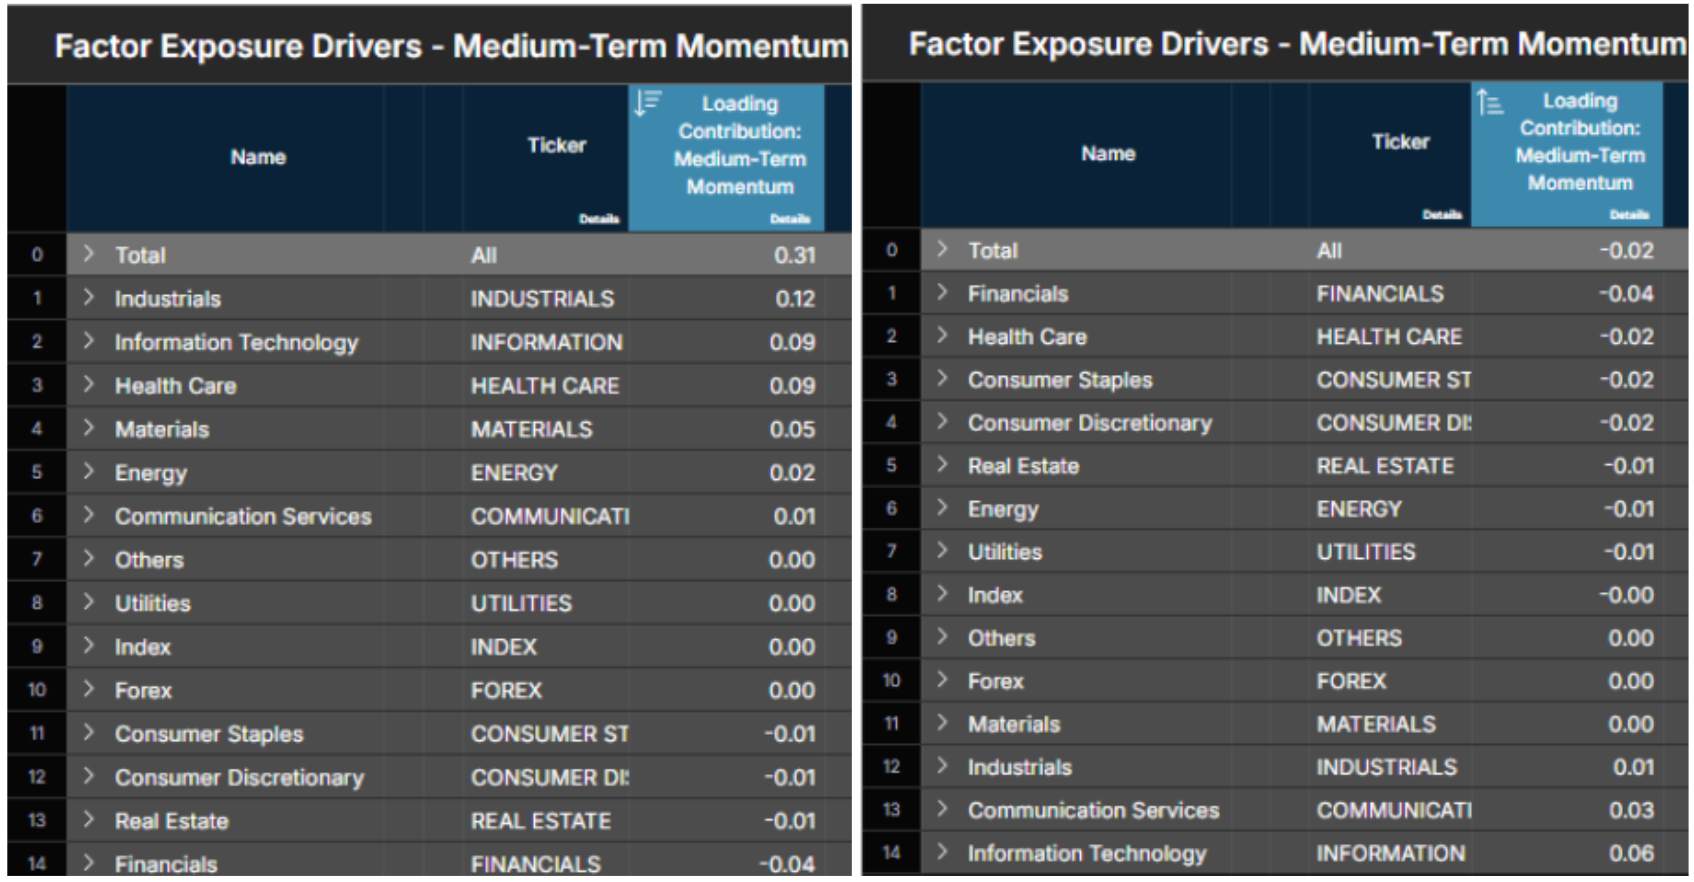
Small cap Industrials, Information Technology, Materials, and Energy carried the highest Momentum loadings, adding nearly 1% to Russell 2000 total return. Momentum weakened in large caps, especially across Information Technology, Consumer Discretionary, and Industrials, and reduced Russell 1000 performance.
Momentum Exposures by Sector: Russell 2000 (left), Russell 1000 (right)
Source: Arcana, Axioma US5.1 Factor Risk Model
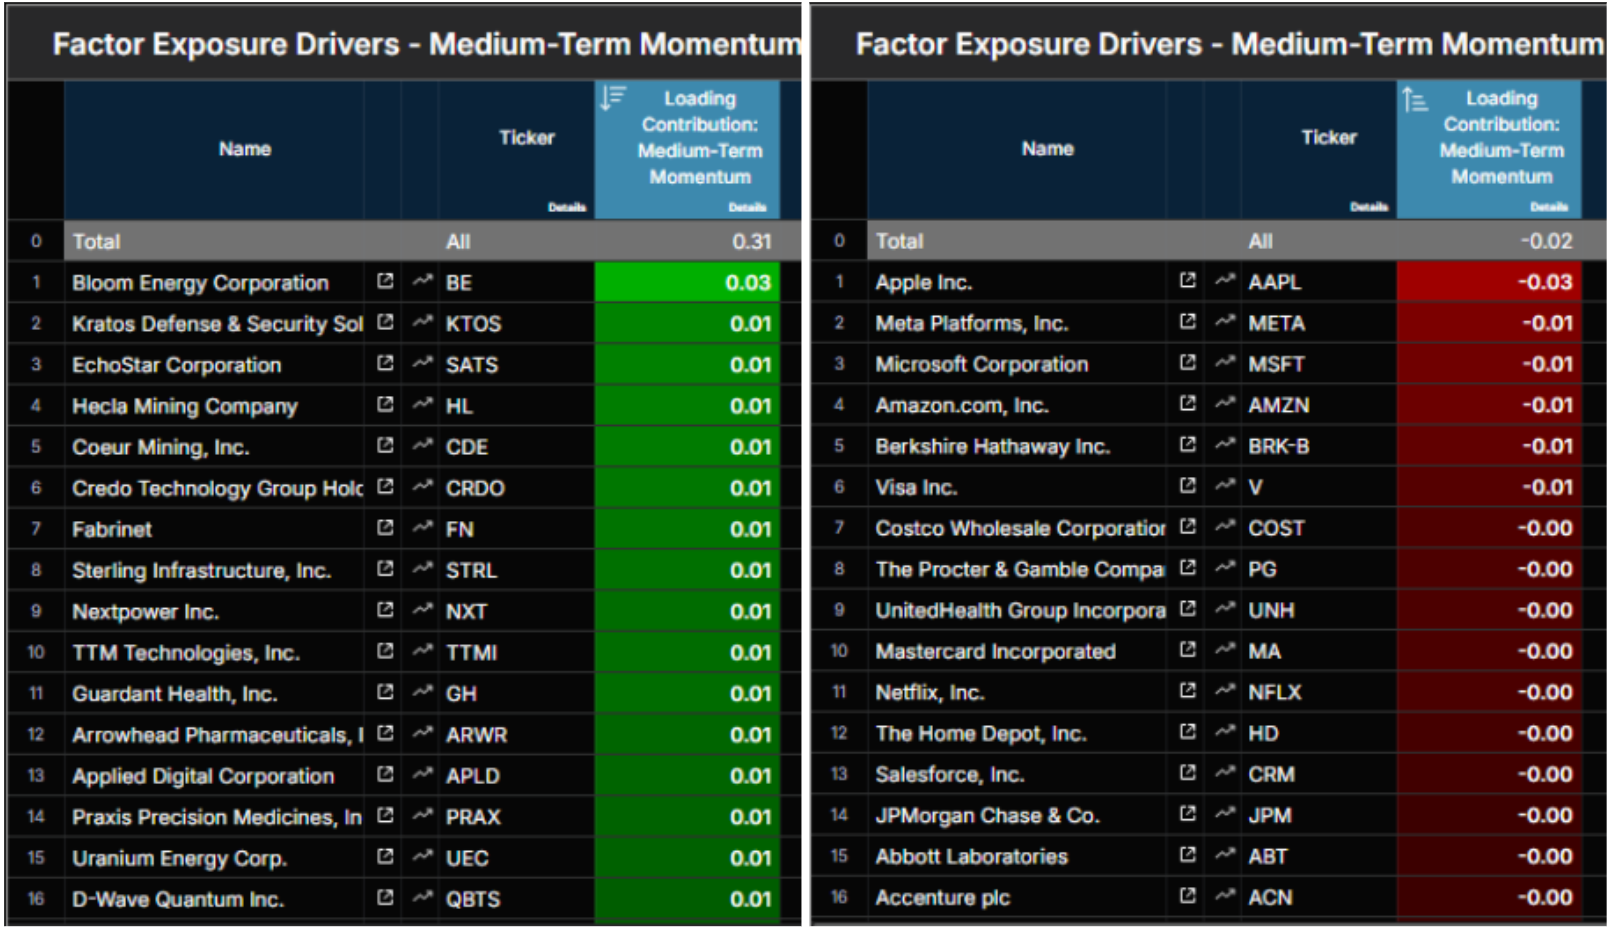
Diving deeper at a stock level, several of the largest US names have been doing poorly over the trailing 11 months relative to other stocks (showing negative momentum). Surprisingly, this group includes not only megacap tech companies such as Apple, Meta, Microsoft, and Amazon (all of which had some of the most negative loadings), but also Berkshire Hathaway, Visa, Costco, and Procter & Gamble.
Momentum Exposures by Stock: Russell 2000 (left), Russell 1000 (right)
Source: Arcana, Axioma US5.1 Factor Risk Model
Short Interest
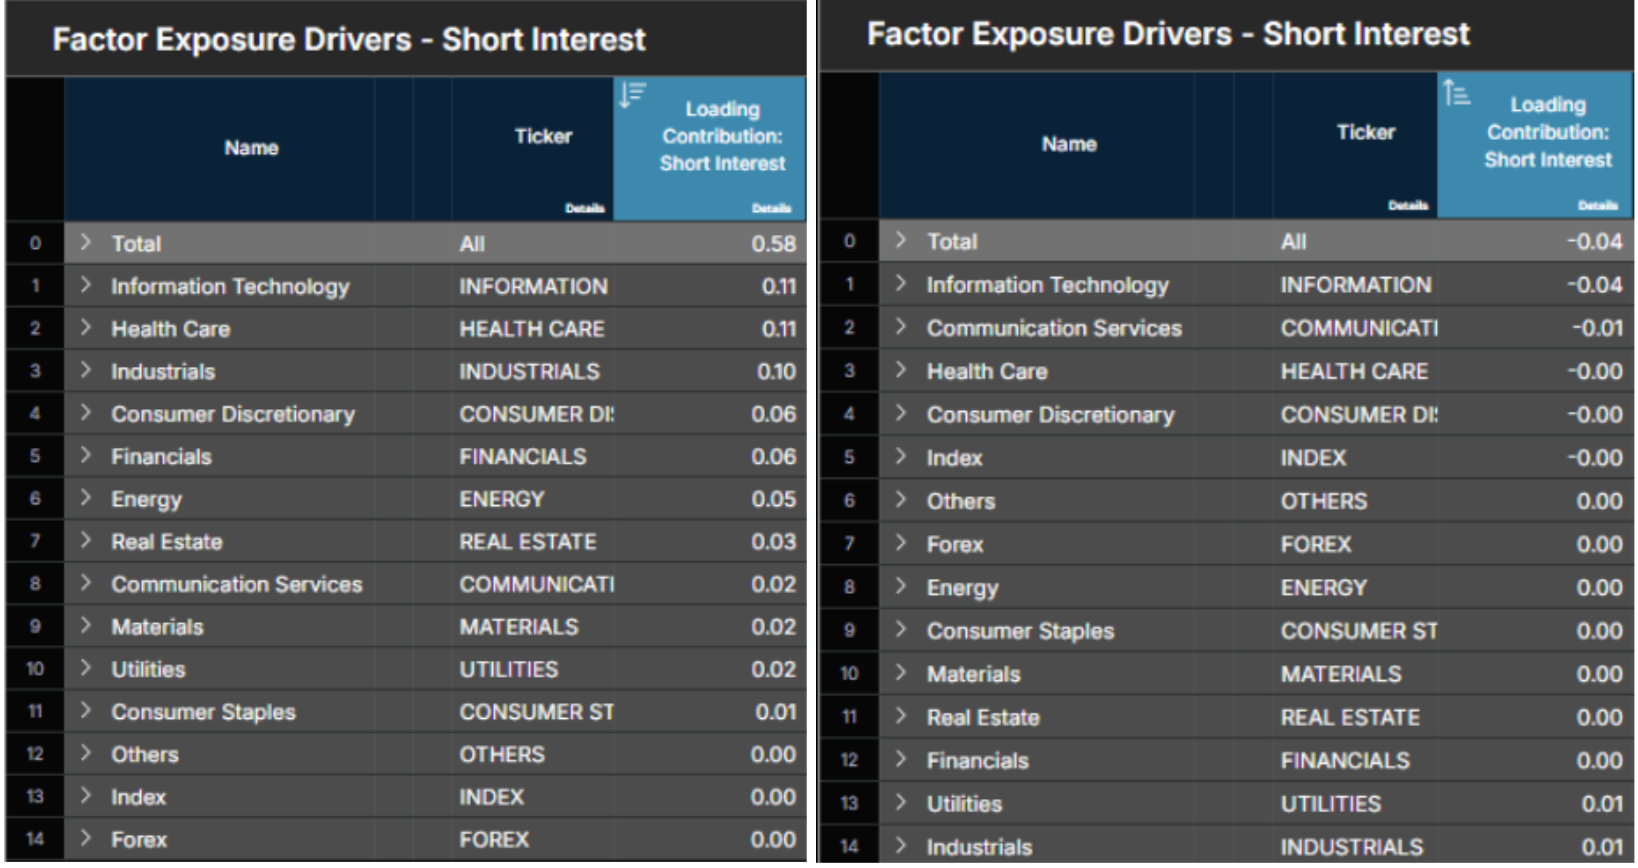
The Russell 2000 typically exhibits positive exposure to the Short Interest factor, which usually carries a negative premium and therefore would be expected to detract from returns. Year-to-date, however, as investors’ preferences are changing, the Short Interest factor has posted a positive return, contributing about 1% to the index’s total return.
This reversal could signal several possibilities. It may reflect a meme-like dynamic in the small cap space, where companies with weaker fundamentals that are commonly shorted become targets of renewed investor interest. It could also indicate a structural shift, similar to patterns observed during the Global Financial Crisis and the COVID period. Another explanation is a renewed investor appetite for smaller companies with improving narratives, innovative technologies, or potential M&A appeal.
These rotations are typically sharp and short lived, as neglected companies attract buyers and short positions are squeezed. Within the Russell 2000, Information Technology, Industrials, and Consumer Discretionary showed some of the largest positive exposures to the Short Interest factor and benefited accordingly. By contrast, Information Technology’s negative Short Interest exposure in the Russell 1000 acted as a drag on large cap performance.
Short Interest Exposures by Sector: Russell 2000 (left), Russell 1000 (right)
Source: Arcana, Axioma US5.1 Factor Risk Model
Short Interest Historical Return vs YTD Return
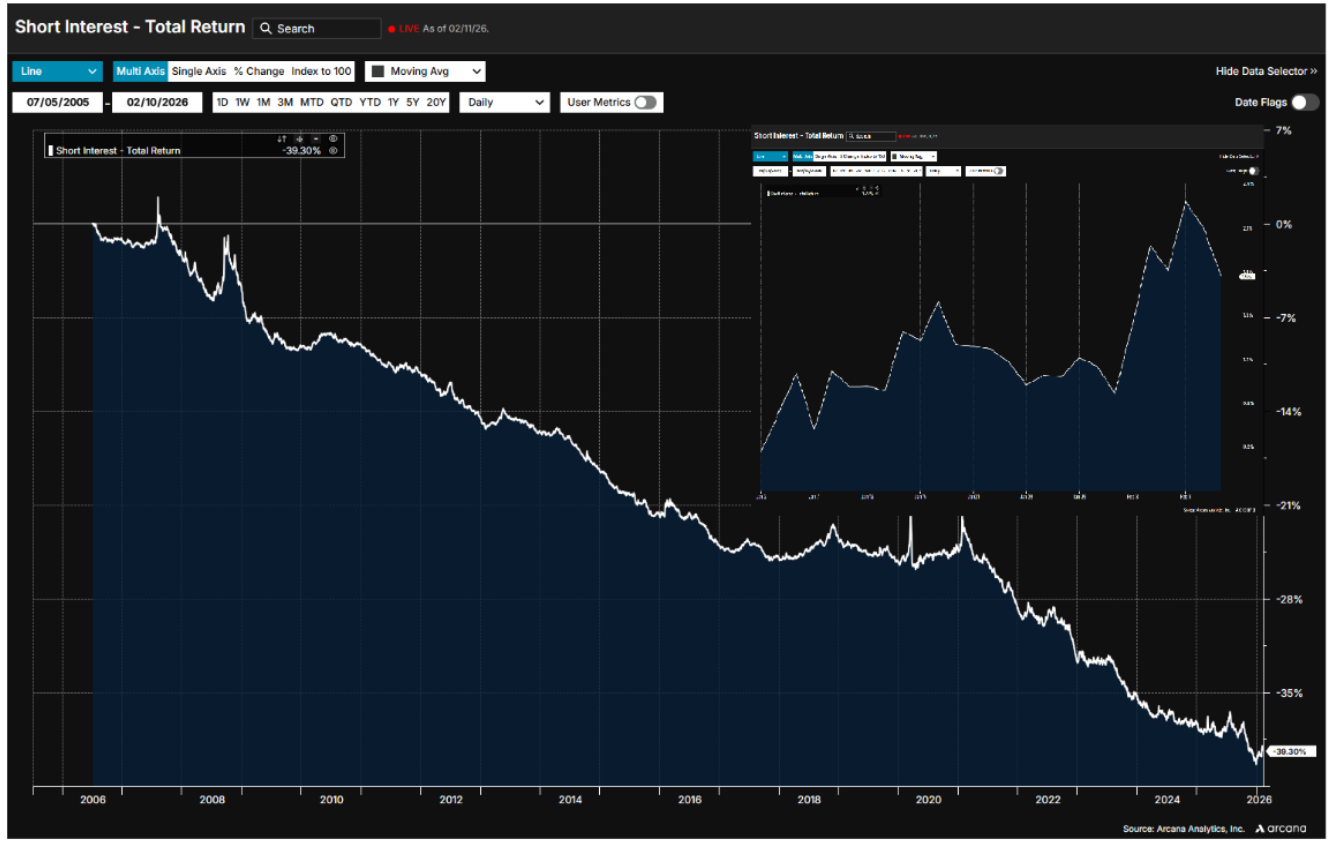
Source: Arcana, Axioma US5.1 Factor Risk Model
Idiosyncratic risk or uncaptured trend in large caps
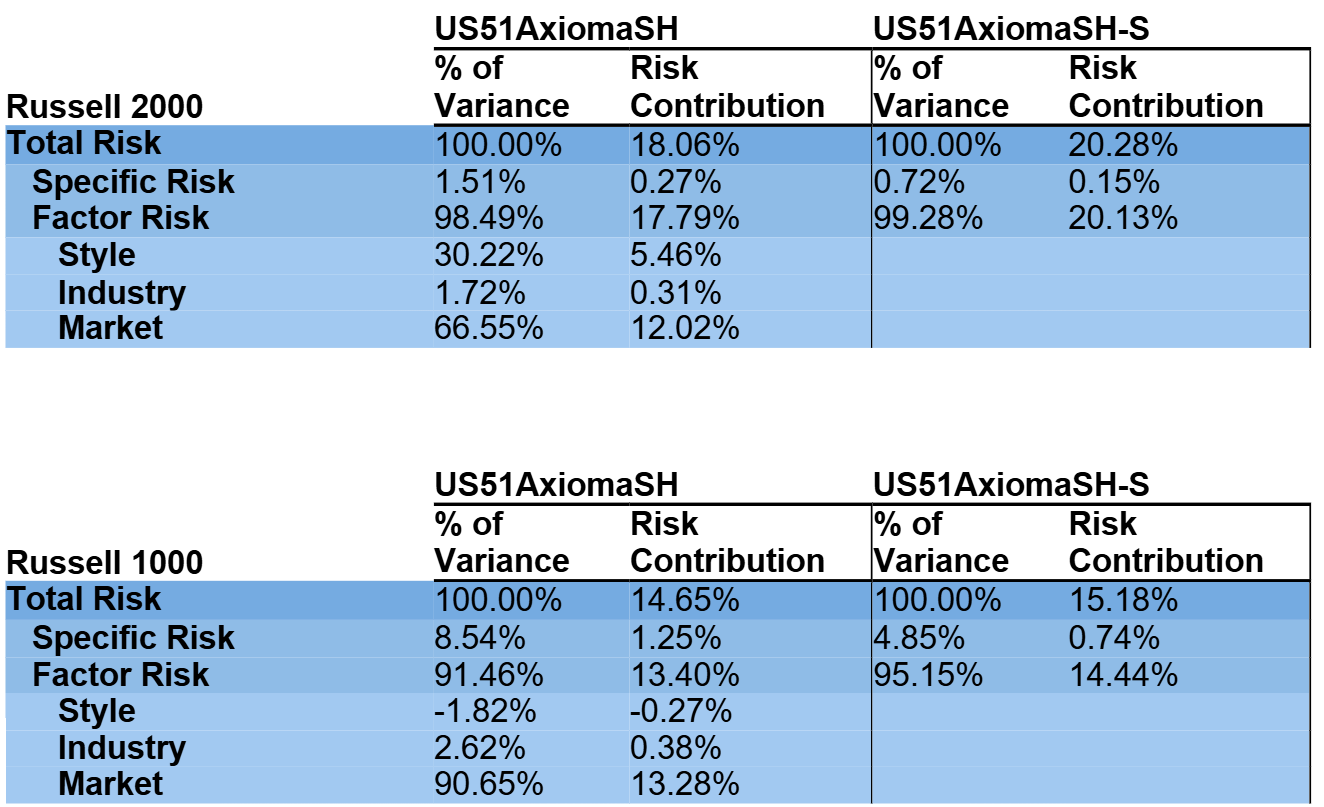
For the Russell 2000, factor contributions to risk are about 99% of total risk under both the fundamental and statistical variants of the Axioma US5.1 model, leaving roughly 1% to residual.
In the Russell 1000, the statistical factor share of risk (about 95%) exceeds the fundamental share (about 92%), implying that idiosyncratic effects present in large caps are partially captured as a trend by statistical factors. This gap may help explain the larger residual contribution to returns when viewed through the fundamental lens. These residuals may reflect not only company-specific events but also latent trends that fundamental factors do not capture.
Factor Risk Contribution Statistical vs. Fundamental
Source: Arcana, Axioma US5.1 Factor Risk Model
Small caps outlook
The dominance of small caps in 2026 signals a renewed balance in the market ecosystem. For years, the gravitational pull of mega cap tech felt almost inescapable, but a combination of domestic fiscal stimulus, a supportive interest rate backdrop, and extreme valuation dispersion has finally broken that spell.
While large caps face idiosyncratic headwinds and mounting global economic, geopolitical, and regulatory pressures, small caps are benefiting from a “Goldilocks” mix of domestic growth, improving credit conditions, and rising acquisition interest. This rotation does not appear to be a “dash for trash” but rather a deliberate shift toward value, flexibility, and the fundamental engine of the US economy.
Small cap performance has been led by Industrials, Financials, Information Technology, and Consumer Discretionary sectors. Style factors have also played a significant role, with Value seeing gains again, small caps showing strong Momentum, and notable reversals in Size and Short Interest. Together these forces have tilted the field decisively in favor of small caps, all while overall risk remains in line with historical norms. Within the small cap space, Financials showed the strongest Value tilt, while Industrials and Information Technology displayed the highest Momentum and benefited the most from the recent positive premium in Short Interest.
If current macro and policy conditions persist, and if M&A activity continues to validate small cap innovation and cash flow trajectories, the case for sustained small cap outperformance remains well supported by both fundamentals and factor dynamics.
References/footnotes
This analysis is as of February 10, 2026
Related content


