

EQUITY RISK MONITOR HIGHLIGHTS
WEEK ENDED AUGUST 22, 2025
Axioma Risk Monitor: Rate Cut Optimism Offsets Tech Weakness; Statistical vs. Fundamental US risk spreads reveal warning signs; US trading volumes defy seasonal norms
Rate Cut Optimism Offsets Tech Weakness
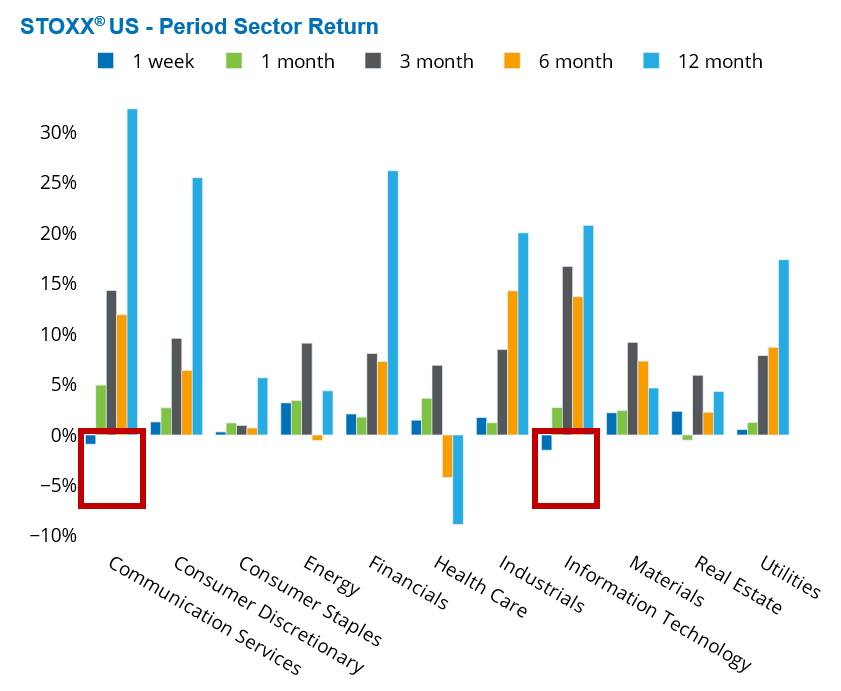
Optimism about a potential interest rate cut in September lifted US shares on Friday, offsetting earlier losses from a tech selloff and leaving the US market relatively flat for the week. Tech stocks stumbled amid fears of stretched valuations and concerns that an AI bubble may be forming—one that could be vulnerable to bursting. This tech weakness weighed heavily on the broader market, particularly through declines in the Information Technology and Communication Services sectors.
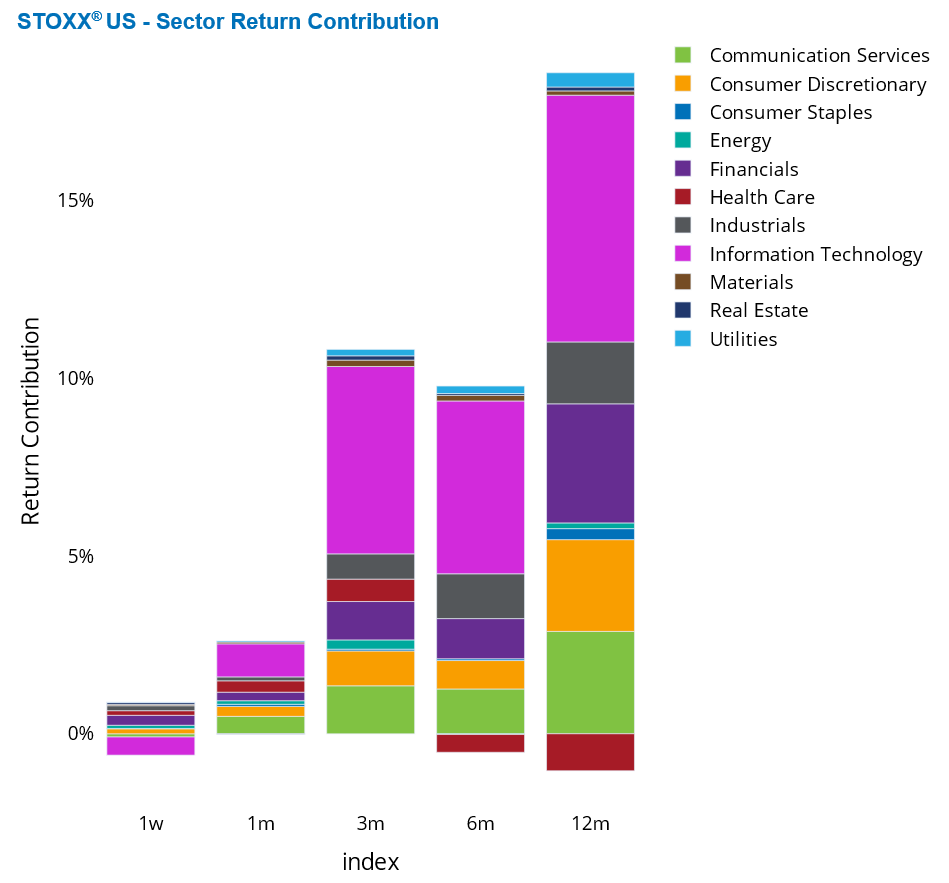
As the dominant sector in the US market, Info Tech contributed -52 basis points to the STOXX US Index’s weekly return. Losses in Microsoft, Nvidia, Apple, Broadcom, and Palantir were the primary drivers behind the sector’s underperformance. In Communication Services, Meta, Netflix, and Spotify led the declines, though the sector’s overall impact was smaller, contributing -9 basis points.
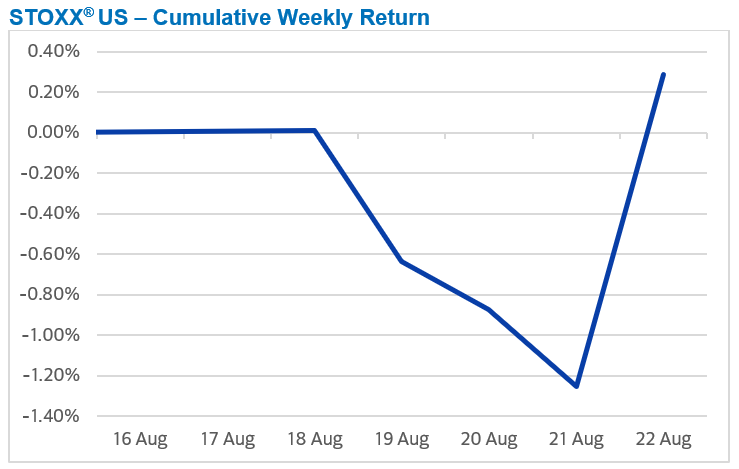
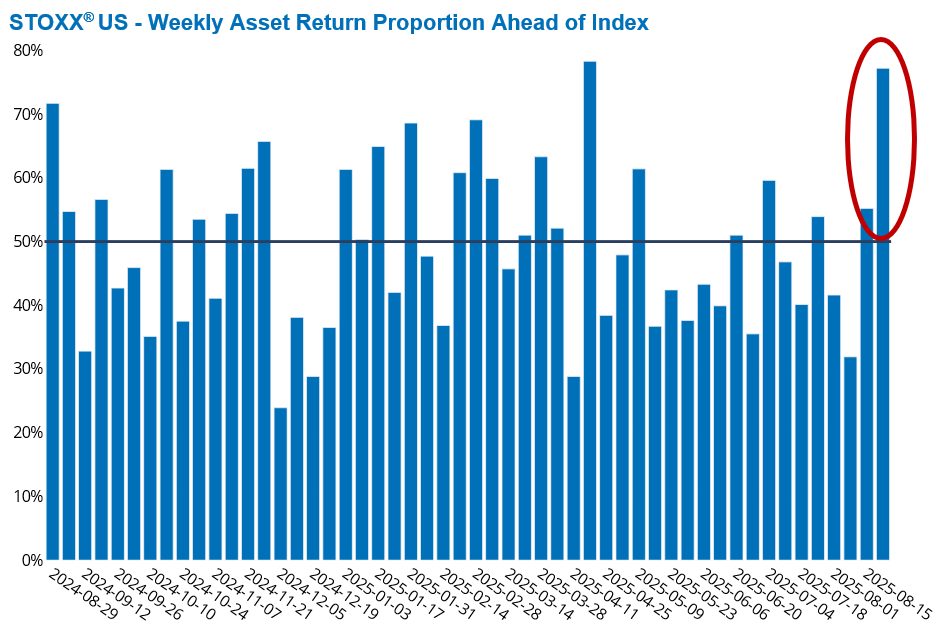
Later in the week, investor attention turned sharply to the Jackson Hole Symposium, where Fed Chair Jerome Powell signaled a willingness to consider interest rate cuts. His comments sparked a strong rally on Friday, with nearly 80% of stocks in the STOXX US Index outperforming the benchmark for the week. Sectors sensitive to borrowing costs—such as housing and banking—benefited the most, while rising oil prices, driven by anticipated demand from a strengthening economy, boosted the energy sector.
Positive contributions to the US market from larger sectors such as Financials, Industrials, and Consumer Discretionary helped offset Info Tech’s drag. However, the strongest gains came from smaller sectors: Energy rose 3.2%, Real Estate gained 2.4%, and Materials advanced 2.2%. All these moves in aggregate allowed the STOXX US Index to eke out a 30 basis point gain last week.
The following chart is not included in the Equity Risk Monitors but is available on request:
See graphs from the STOXX US Equity Risk Monitor as of August 22, 2025:
Statistical vs. Fundamental US risk spreads reveal warning signs
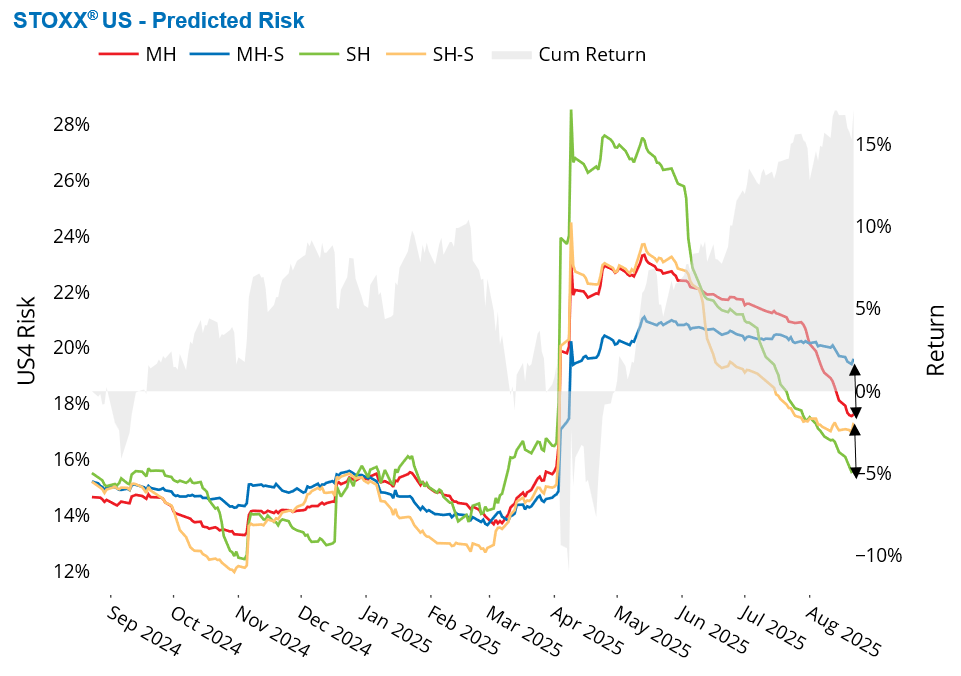
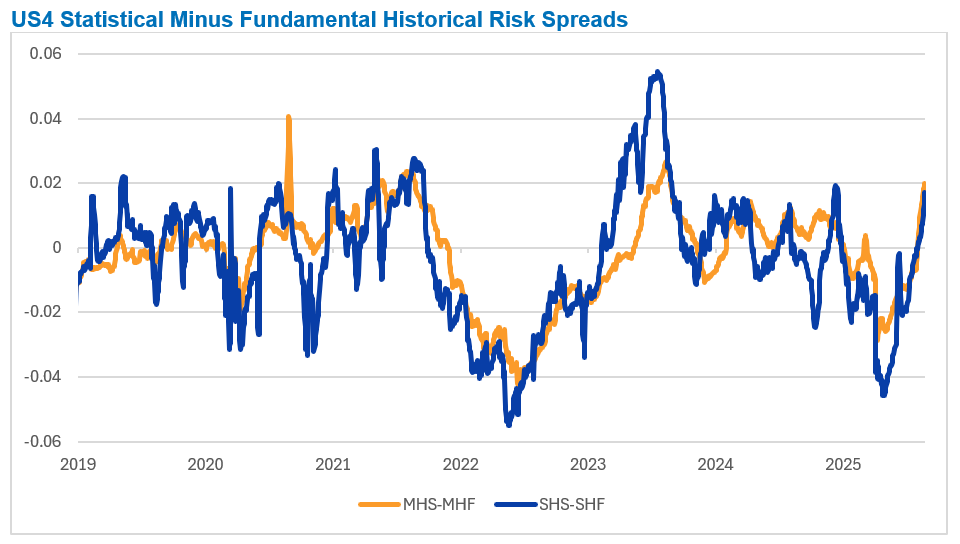
The widening gap between statistical and fundamental risk forecasts in the US is sending cautionary signals. While market volatility continues to decline, statistical risk forecasts have not fallen as sharply as their fundamental counterparts. This divergence has resulted in positive spreads—defined as statistical minus fundamental risk—at both short- and medium-term horizons, as measured by Axioma US4 model variants.
At the short horizon, the spread has widened to 200 basis points—a level not seen since the aftermath of the US elections in December 2024. At the medium horizon, the current 170 basis point spread was last observed in August 2023, when the Fed was raising rates and there was a persistent concern about a US recession.
This suggests that the statistical model may be detecting a transient trend or a shift in the risk regime that the fundamental model overlooks due to its fixed structural assumptions. Unlike fundamental models, statistical models—driven by Principal Component Analysis—do not rely on predefined factors. Instead, they aim to maximize explanatory power by capturing the most significant current market movements. This flexibility enables statistical models to respond swiftly to short-term fluctuations, potentially improving their accuracy over brief forecast periods.
See graph from the STOXX US Equity Risk Monitor as of August 22, 2025:
The following chart is not included in the Equity Risk Monitors but is available on request:
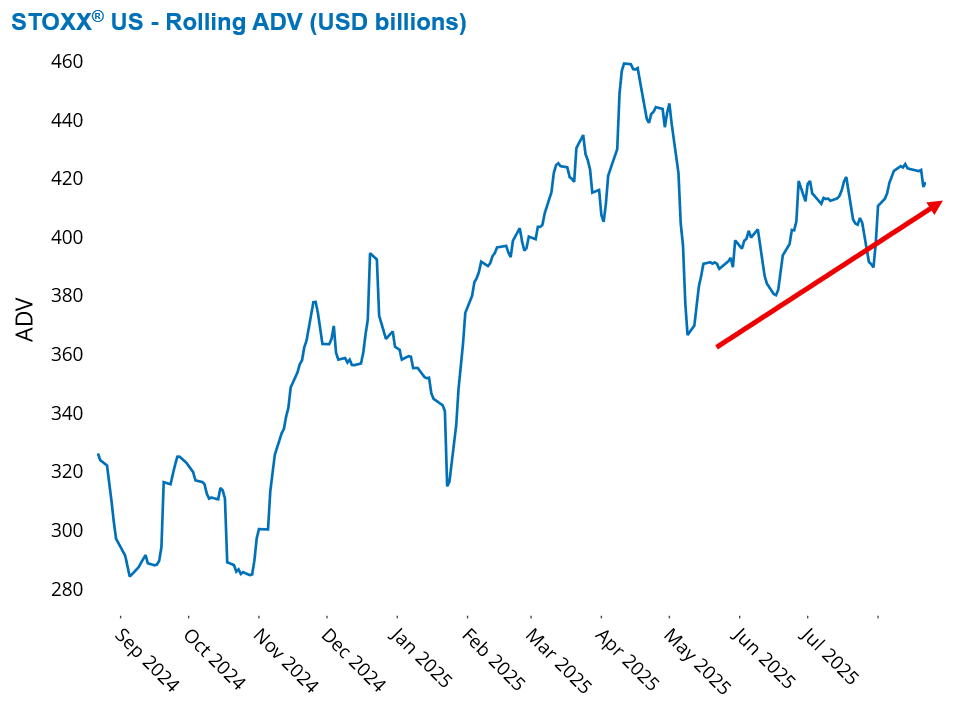
US trading volumes defy seasonal norms
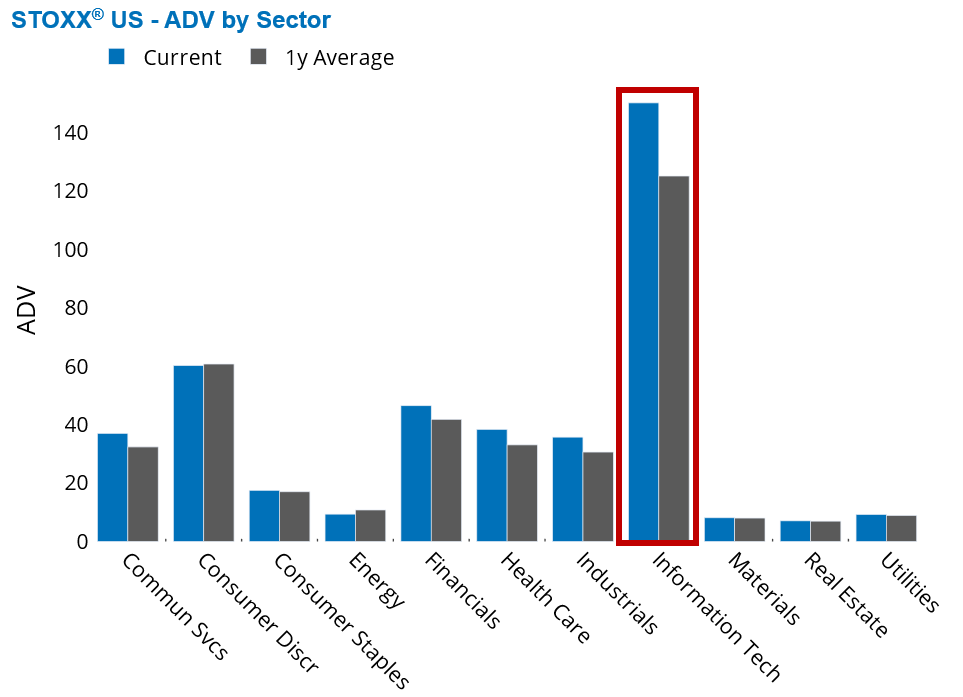
US equity markets bucked the seasonal trend this summer, avoiding the typical summer lull, and instead showing elevated trading activity. Since May, average daily trading volume for stocks in the STOXX US Index has steadily increased, now standing 30% above the levels seen during the same period last year. Most sectors within the US core index recorded trading volumes at or above their one-year averages, with Info Tech showing the largest increase, signaling a broad-based resurgence in investor interest.
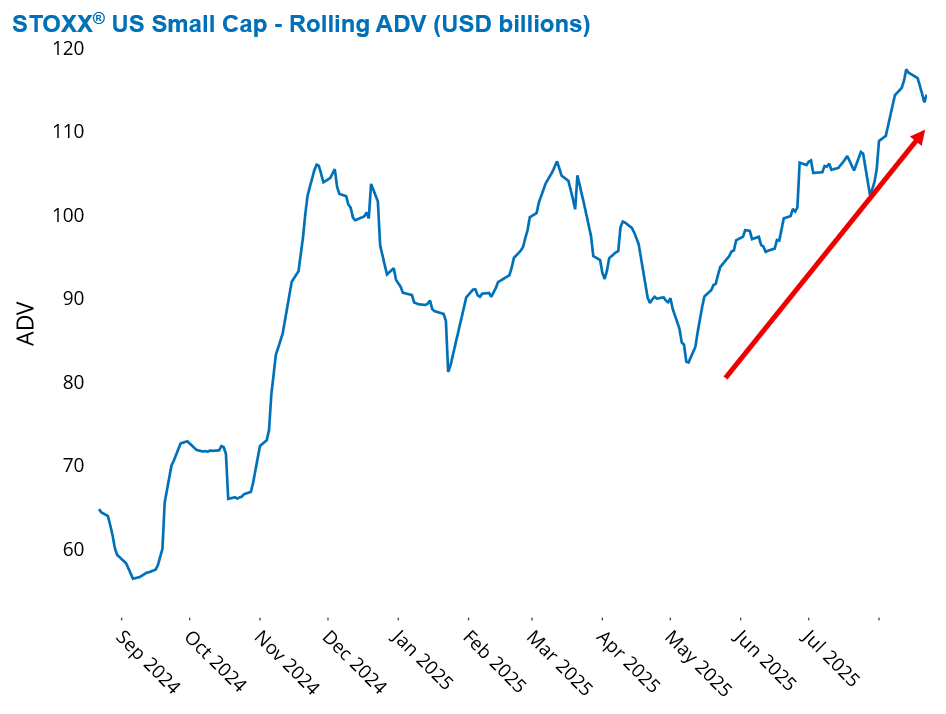
Small caps experienced even more intense trading activity, hitting a 12-month peak two weeks ago and maintaining elevated levels last week. Current trading levels are nearly twice what they were a year ago. These smaller companies, which stand to benefit more from an interest rate cut, outperformed their larger counterparts over the past five business days. The STOXX US Small Cap Index climbed nearly 3% last week, buoyed by gains across all sectors—including Info Tech—reenforcing the notion that recent tech losses were largely concentrated in a few mega-cap names.
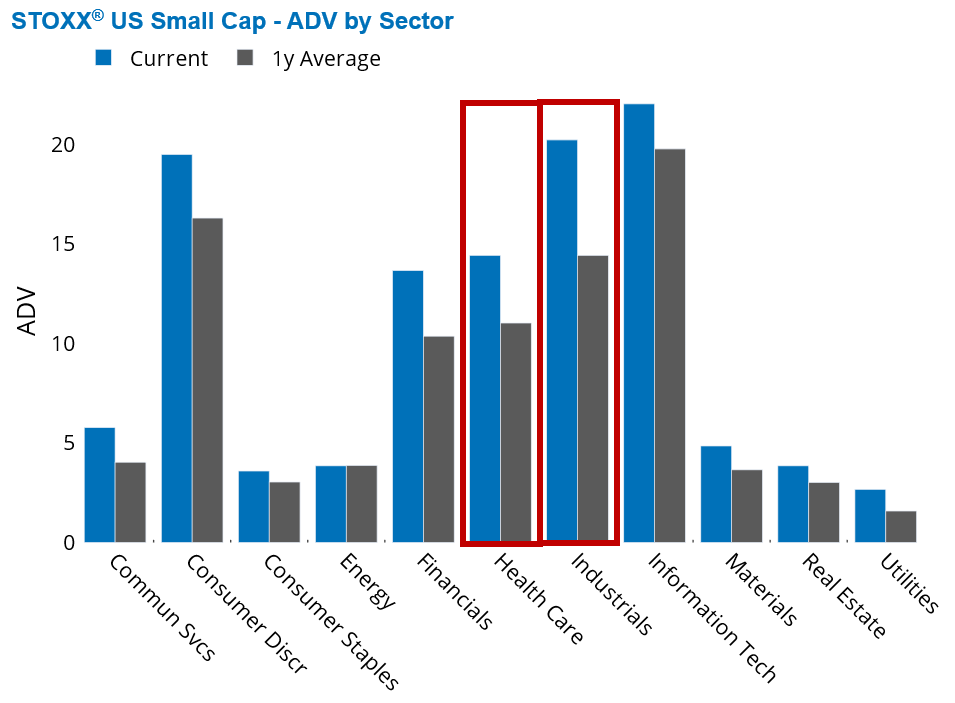
Within the Small Cap Index, trading volumes increased across every sector. All sectors exceeded their one-year averages, except for Energy, which matched its historical norm. The most notable volume increases (in absolute terms) were observed in Industrials and Health Care.
See graphs from the STOXX US Equity Risk Monitor as of August 22, 2025:
See graphs from the STOXX US Small Cap Equity Risk Monitor as of August 22, 2025:
You may also like


