
EQUITY RISK MONITOR HIGHLIGHTS
WEEK ENDED AUGUST 29, 2025
Axioma Risk Monitor: US Small Cap rally in August fuels jump in style risk; Risk-on sentiment fades in the US; US Small Caps become riskier, yet more diversified than Large Caps
US Small Cap rally in August fuels jump in style risk
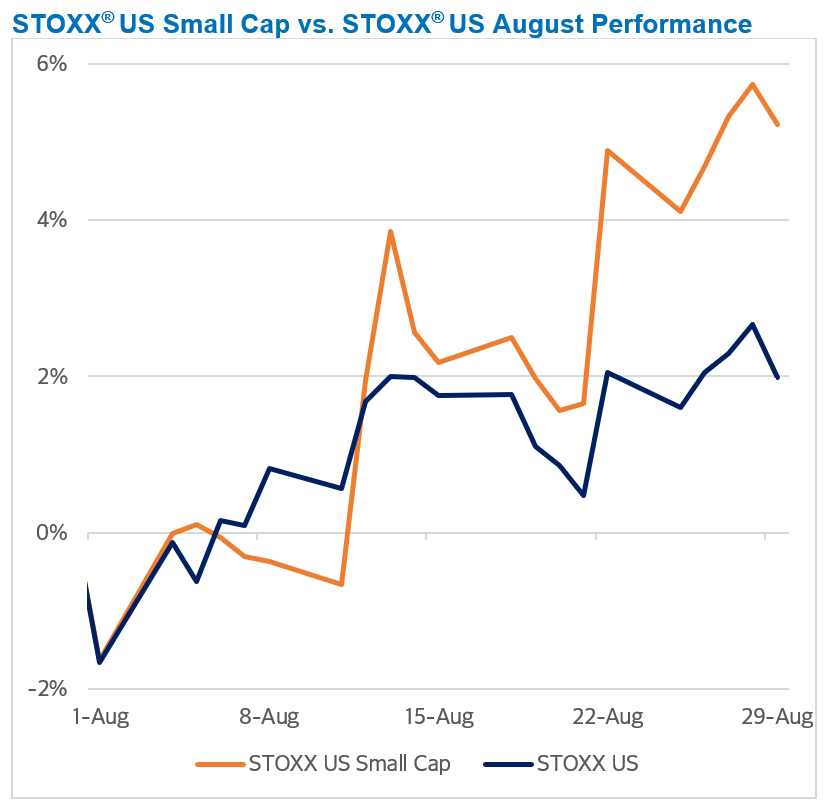
Although US small- and large-cap stocks remained relatively flat last week, both ended August with solid monthly gains. Small caps staged a notable rally, outperforming large caps amid growing optimism over potential interest rate cuts. The STOXX US Small Cap Index rose more than 5.2% in August, outpacing the broader STOXX US Index by 320 basis points. Despite this strong monthly performance, small caps continue to lag year to date—trailing large caps by 340 basis points, with the STOXX US Index up 11% since January.
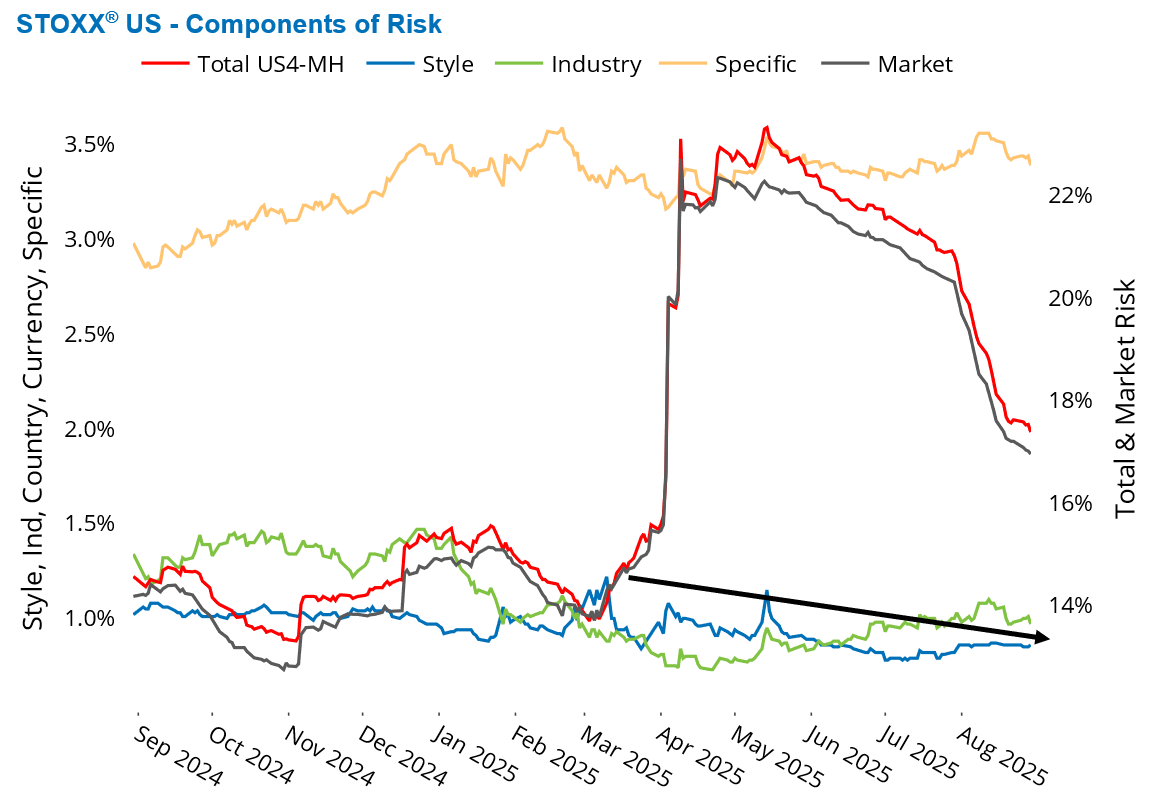
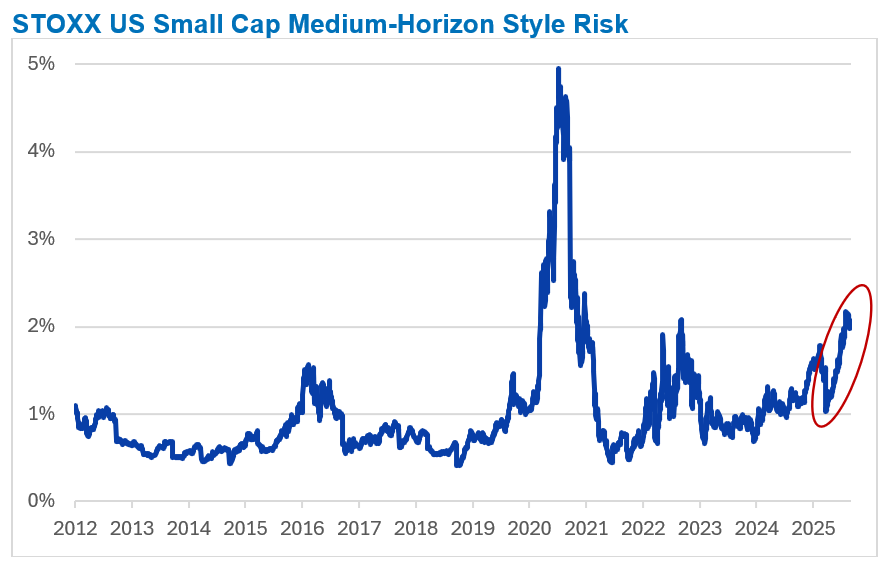
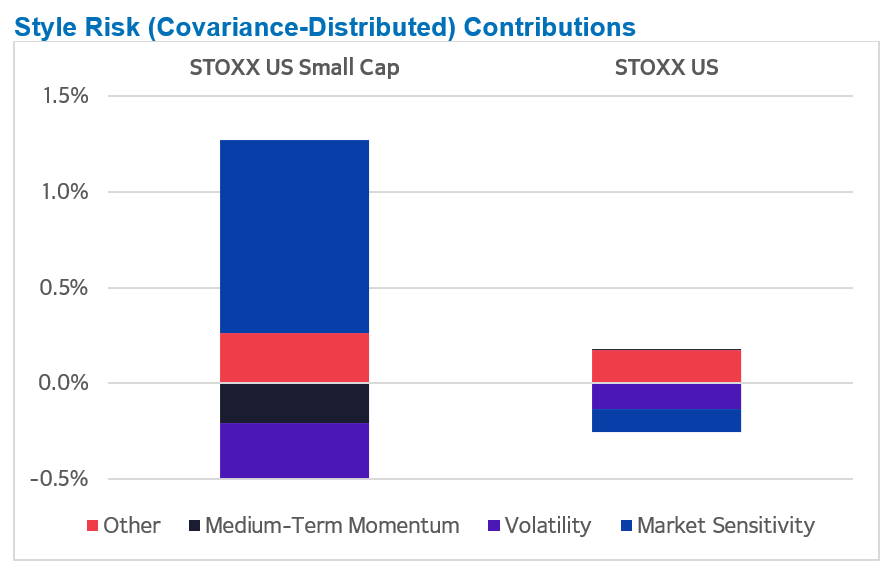
While overall market risk declined across both segments, style risk in small caps surged. This upward trend began in March, reached a five-year high at the end of July, and has remained elevated since. In contrast, style risk for large caps has decreased over the same period. While style risk accounts for a modest share of total benchmark risk, its growing influence may warrant closer attention from active managers, as it could increasingly impact portfolio outcomes.
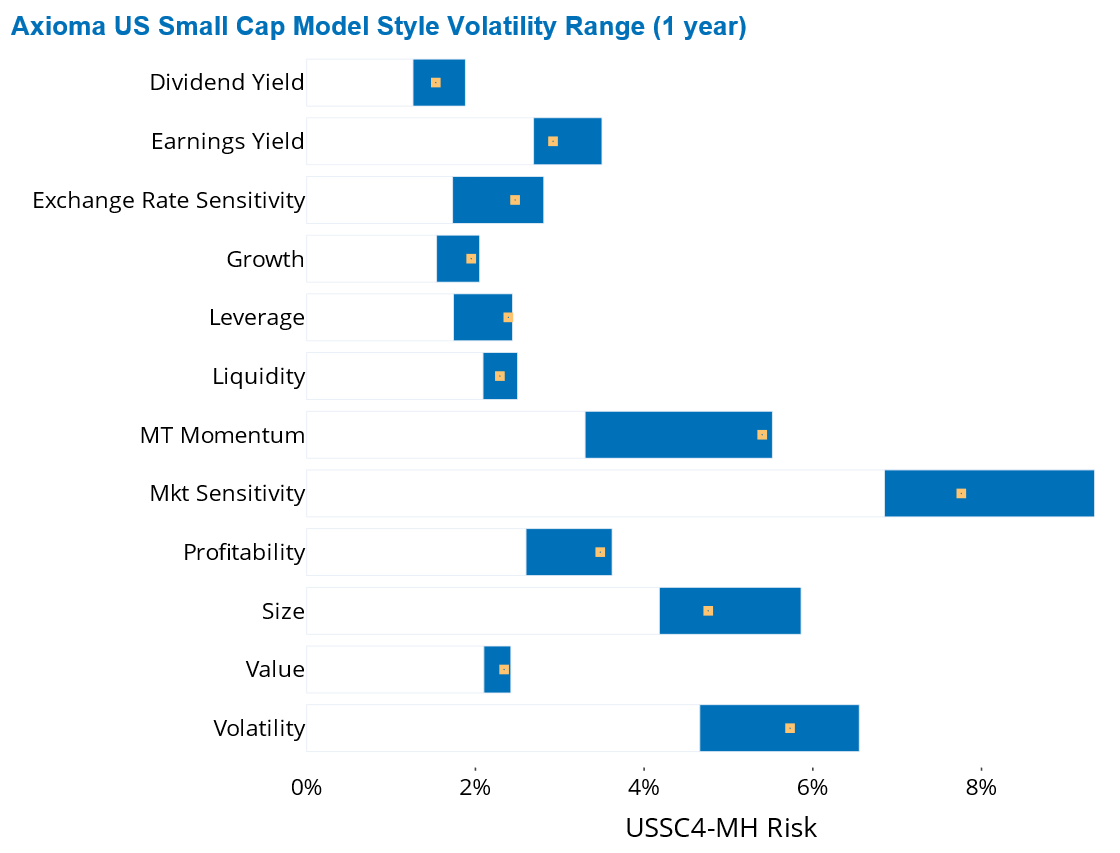
Market Sensitivity—currently the most volatile style factor in the Axioma US Small Cap (USSC4) fundamental medium-horizon model—has been the primary driver of style risk in small caps. Meanwhile, Volatility and Medium-Term Momentum, which rank as the second and third riskiest factors, have helped offset some of this upward pressure. As of last Friday, Market Sensitivity and Volatility were positioned near the midpoint of their respective one-year volatility ranges, while Momentum sat at the upper end of its range.
The following chart is not included in the Equity Risk Monitors but is available on request:
See graph from the STOXX US Equity Risk Monitor as of August 29, 2025:
See graphs from the STOXX US Small Cap Equity Risk Monitor as of August 29, 2025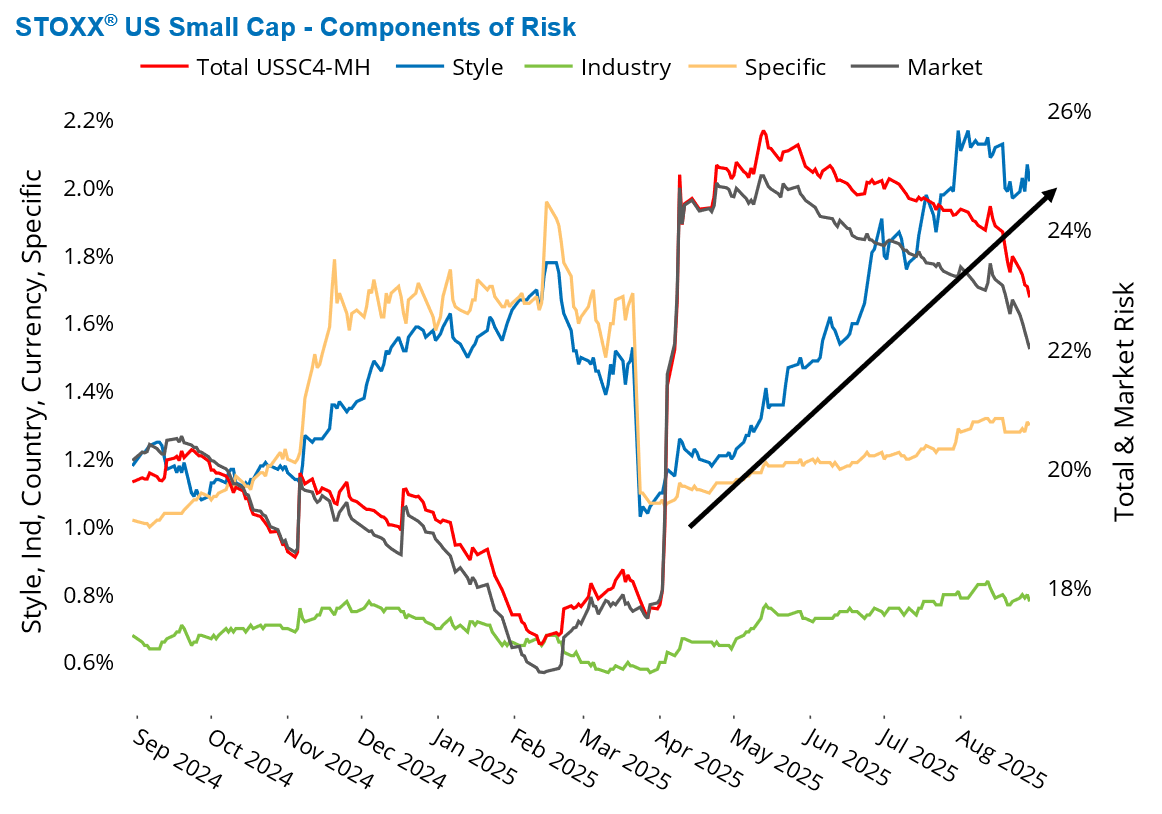
The following chart is not included in the Equity Risk Monitors but is available on request:
Risk-on sentiment fades in the US
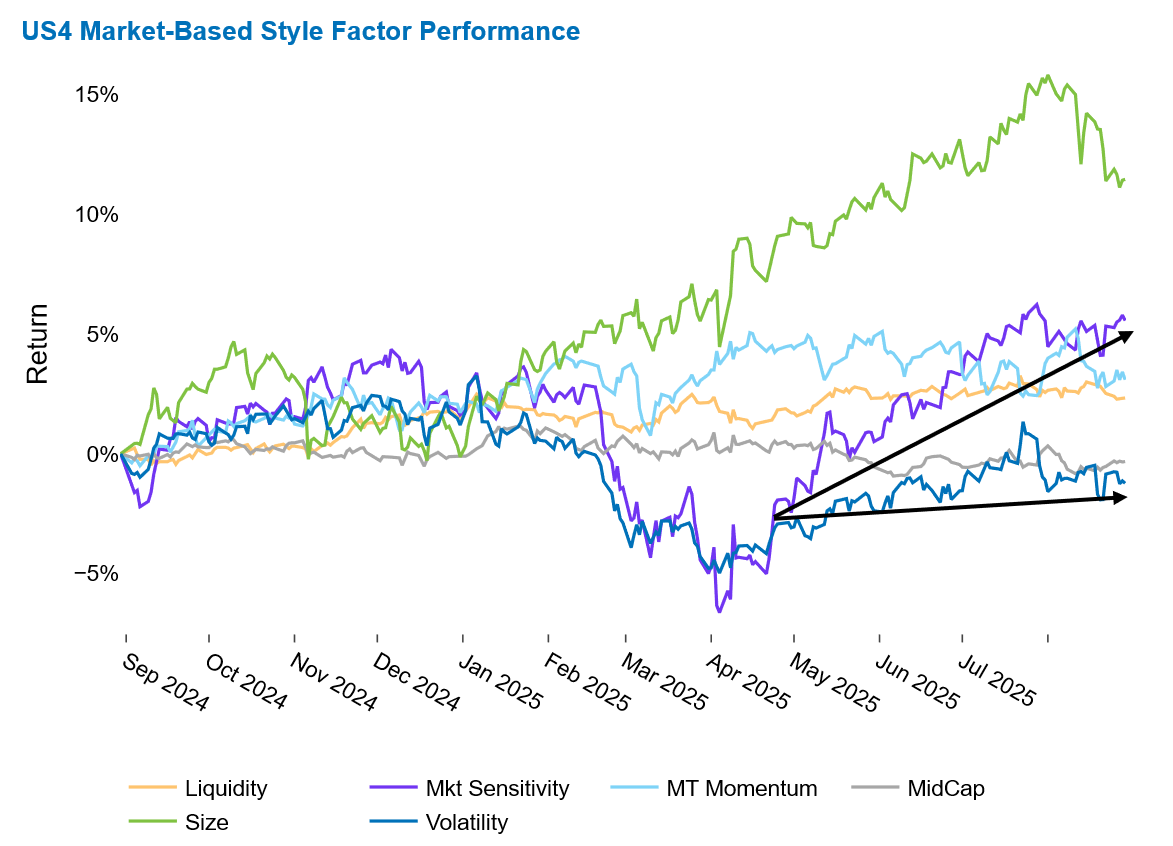
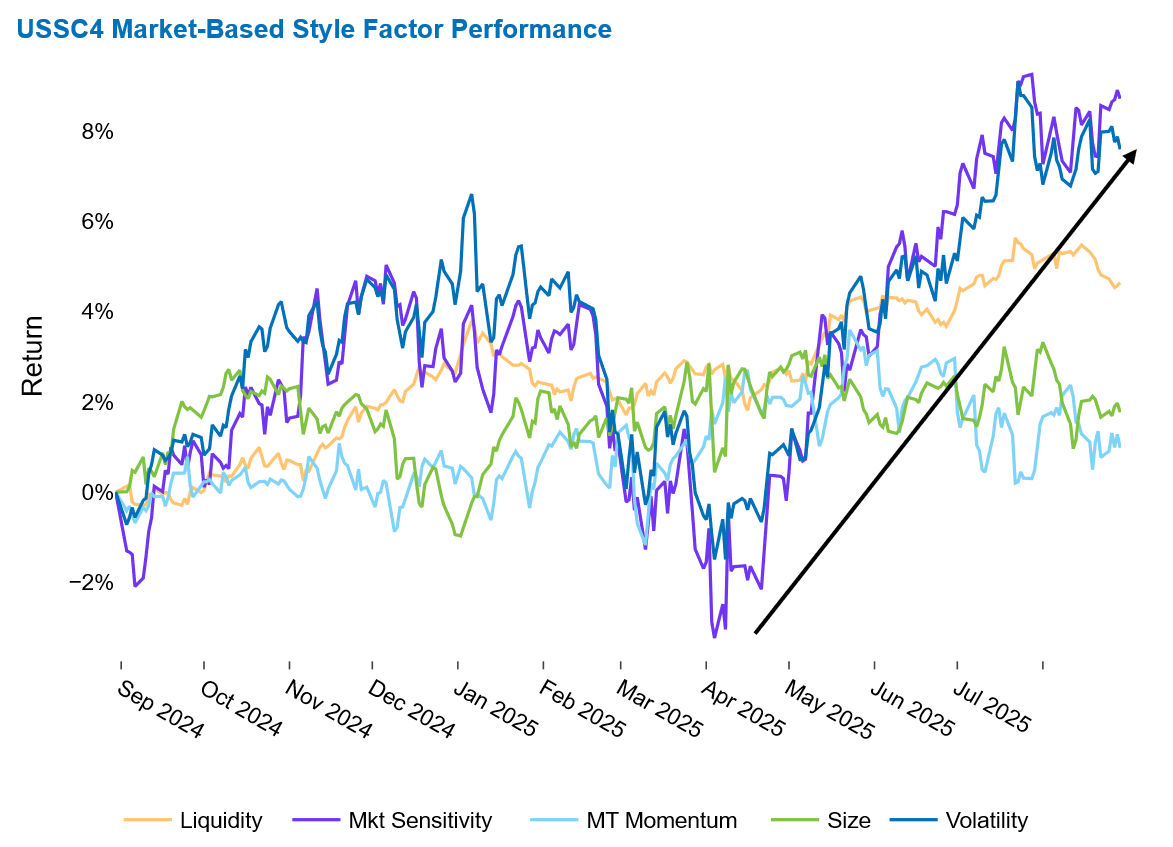
Following a robust three-month stretch marked by heightened risk appetite, investors are now pivoting toward lower-beta, lower-volatility stocks—steering clear of their riskier counterparts. This shift is particularly evident in the US4 fundamental medium-horizon model, where both Market Sensitivity and Volatility declined over the past month. The USSC4 model echoed this trend more subtly: Market Sensitivity held steady, while Volatility posted a modest gain for the month, despite a decline last week.
This recent caution stands in contrast to the past three-month period, during which Market Sensitivity (5%) and Volatility (3%) delivered the strongest returns among all style factors in the USSC4 model—lifting their 12-month returns to 9% and 7%, respectively. While these gains were within forecasted expectations, they underscore a clear investor preference for high-beta, high-volatility stocks over their low-beta, low-volatility counterparts across both the three- and 12-month horizons. The trend reflects a sustained “risk-on” sentiment that dominated the small-cap space.
In the all-cap universe, a similar appetite for high-beta stocks was evident in recent months. The US4 Market Sensitivity factor also returned 5% over the past three months. However, Volatility lagged, delivering just 1%. Over the full 12-month horizon, the divergence became more pronounced: Market Sensitivity rose 6%, while Volatility declined by 1.4%.
For further insights into the weakening investor sentiment across the US and other markets, see this week’s ROOF Score Highlights.
See graph from the STOXX US Equity Risk Monitor as of August 29, 2025:
See graph from the STOXX US Small Cap Equity Risk Monitor as of August 29, 2025:
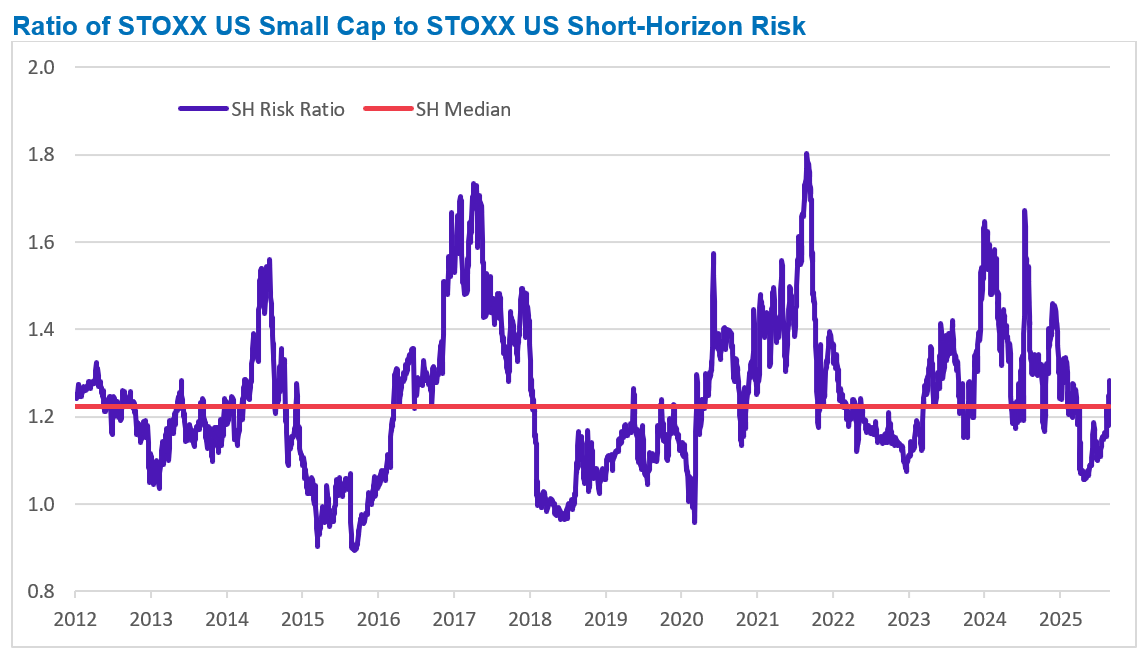
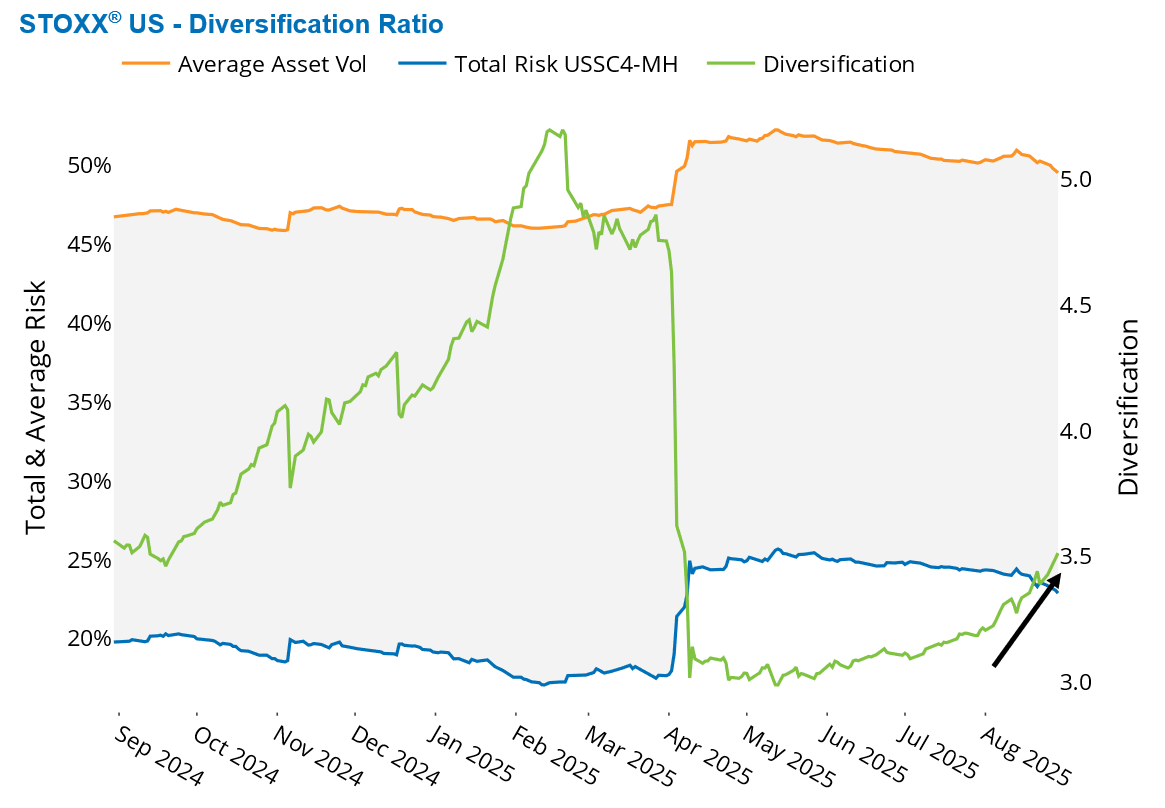
US Small Caps become riskier, yet more diversified than Large Caps
As the risk gap between US small and large caps widened, small caps are still offering higher diversification.
Since peaking on April 9, risk levels across both segments of the US equity market have dropped significantly. The STOXX US Index saw its risk fall by 14 percentage points to 15%, while the STOXX US Small Cap Index’s risk declined by 11 points to 19% as of last Friday, as measured by Axioma US All Cap (US4) and Small Cap (USSC4) short-horizon fundamental models, respectively.
Small caps have consistently exhibited higher risk than large caps throughout 2025 (as expected)—but the gap has been widening since May. US small caps are currently 28% riskier than their large-cap counterparts, slightly above the 13-year median relative risk of 22%. While elevated, this level remains well below previous historical peaks.
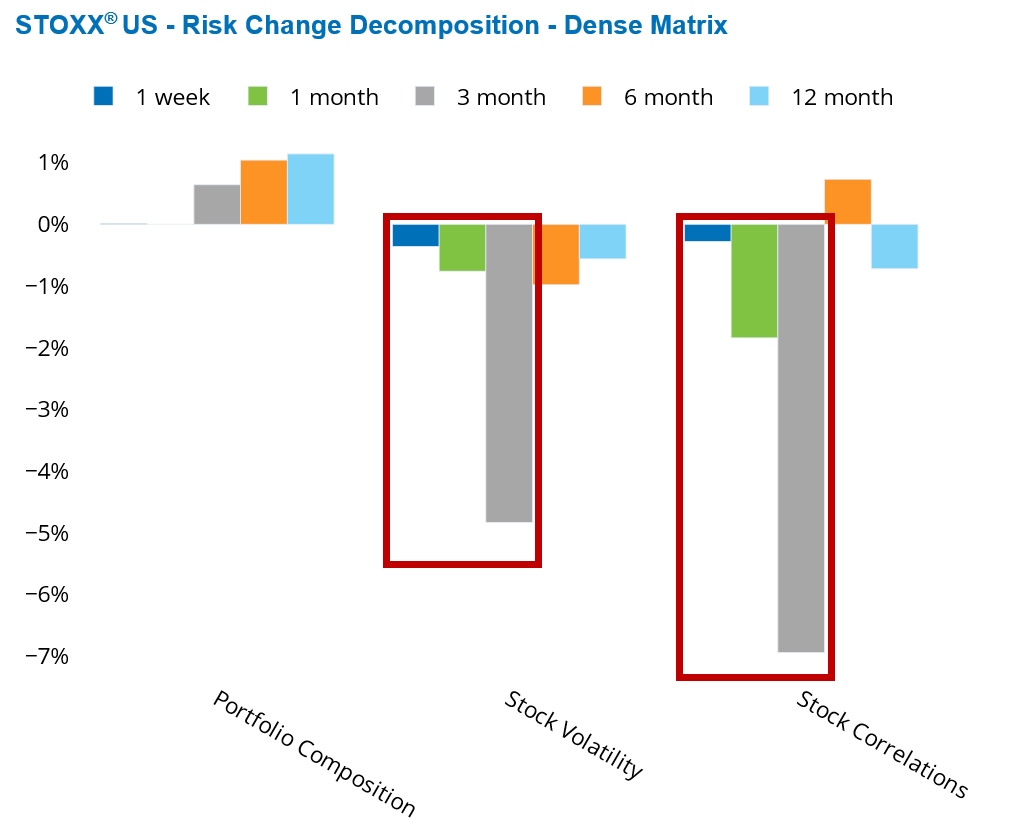
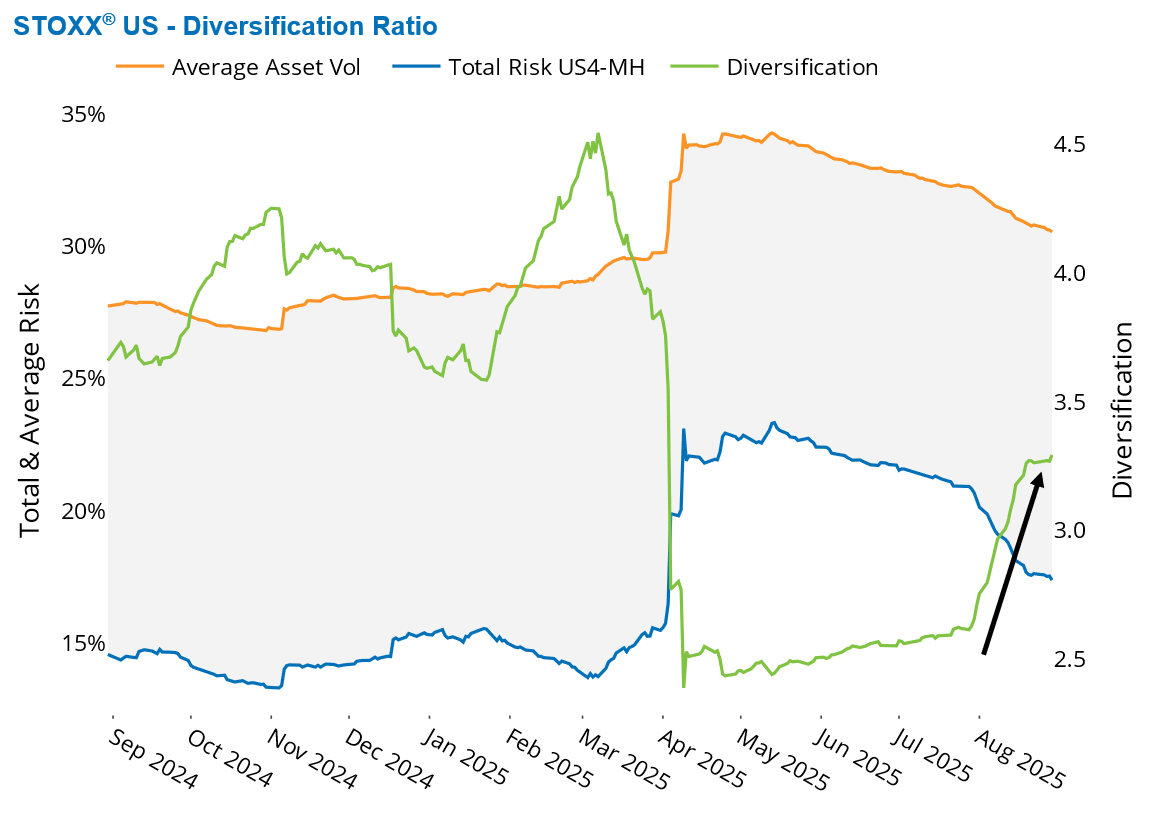
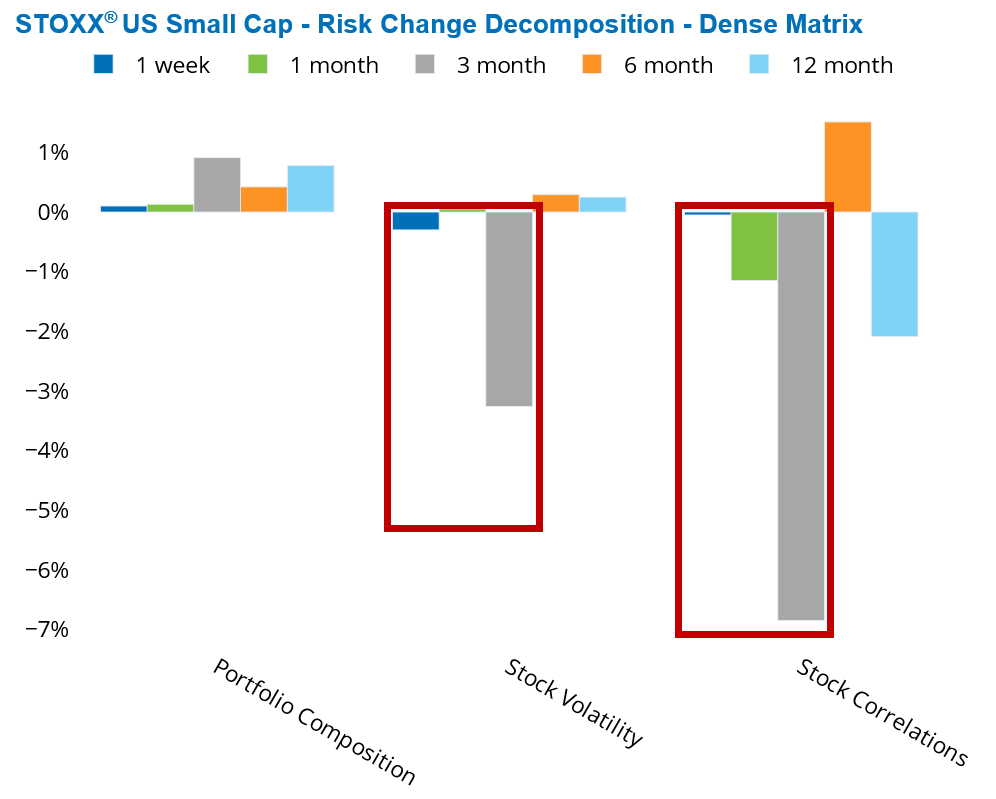
Over the past one and three months, risk forecasts have been pulled lower by declining stock volatility and stock correlations within the STOXX US and STOXX US Small Cap Indices. This drop in correlations is also evident in the rising asset diversification ratio, which measures the impact of correlations on total risk.
Defined as the weighted average of individual asset variances divided by the total forecasted index variance, the asset diversification ratio reflects the breadth of diversification available in the market. A higher ratio signals greater diversification. After reaching a high in February–March, the ratio dropped sharply in early April and remained suppressed for nearly four months across both small- and large-cap US indices. In August, it began climbing again, though it has yet to return to pre–“Liberation Day” levels.
While large caps experienced a more pronounced rebound in the ratio, small caps still offer better diversification, as indicated by their persistent higher ratio. This suggests that, despite their elevated risk, small caps may provide more opportunities for risk dispersion.
The following chart is not included in the Equity Risk Monitors but is available on request:
See graphs from the STOXX US Equity Risk Monitor as of August 29, 2025:
See graphs from the STOXX US Small Cap Equity Risk Monitor as of August 29, 2025:
You may also like


