

EQUITY RISK MONITOR HIGHLIGHTS
WEEK ENDED SEPTEMBER 26, 2025
- U.S. markets decline as investors weigh economic data
- Increased attention on Small Cap moves Style Factors
- Japan’s Strong Week and Year
Mixed (Economic) Signals
Last week, US markets ended down slightly with the STOXX US dropping 37bps as investors weighed strong economic data against evolving interest rate policy. Jerome Powell spoke publicly on Tuesday and indicated cautiously that further cuts this year were possible depending on inflation and the condition of the domestic labor market. However, the central bank’s preferred inflation measure, Core PCE, met expectations at 2.9% but remained well above the Fed’s 2% target. Company-specific news was dominated by firms making increased investment in technology—on Monday, Nvidia announced a $100B investment in OpenAI; on Wednesday, Alibaba committed $53B on AI models and infrastructure; and on Thursday, news broke that Intel is seeking partnerships with both Apple and Taiwan Semiconductor.
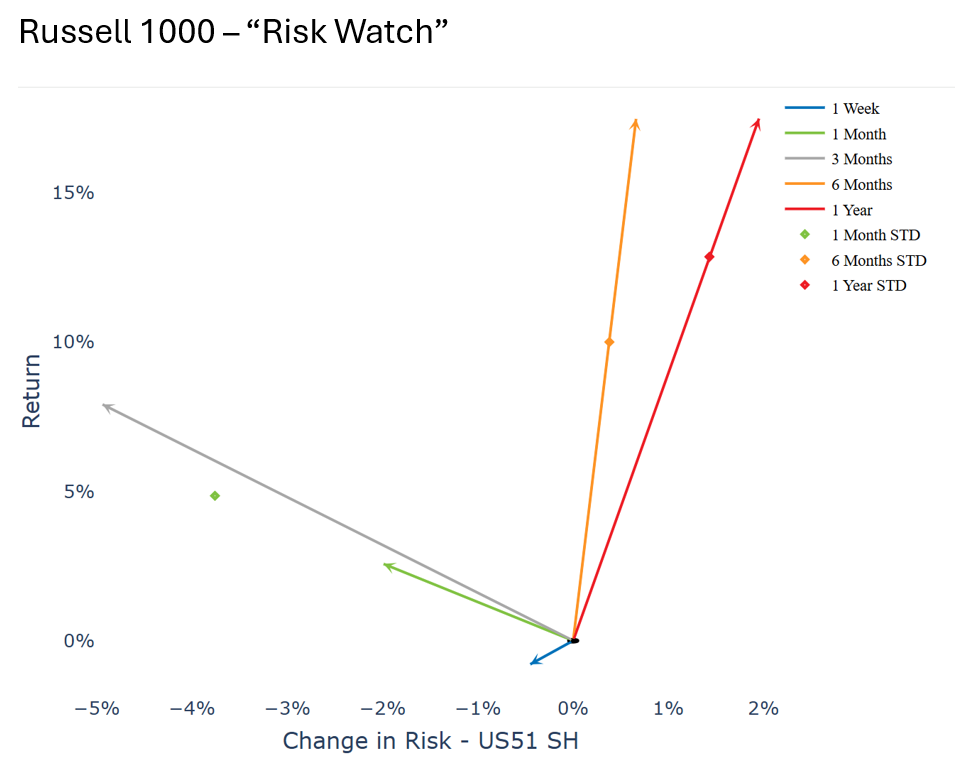
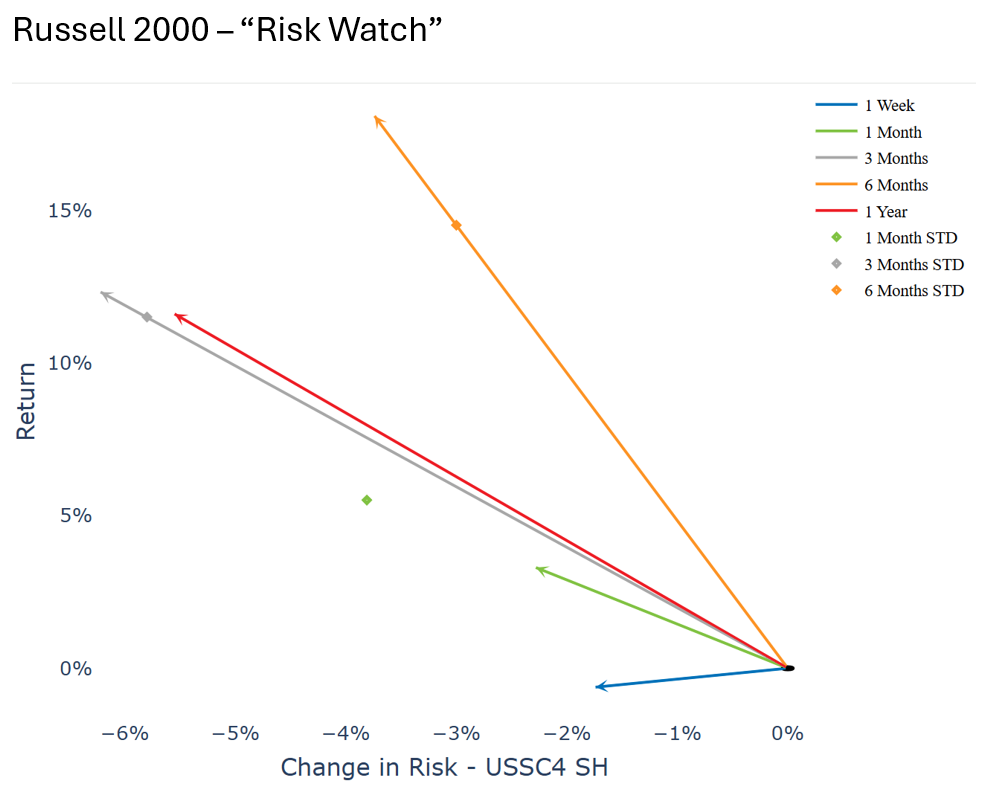
Last week, the Russell 2000 outperformed the Russell 1000 alongside lower interest rate expectations, but this week’s uncertain economic backdrop affected large cap and small cap returns similarly. The Russell 1000 and Russell 2000 returned -79bps and -62bs respectively. Both indices’ risk decreased, but by different magnitudes. The Russell 1000’s risk as measured by our US5.1 Risk Model fell 0.45% over the last week due to decreases in Market Factor and Company Specific Risk. In comparison, the Russell 2000’s risk dropped -1.74% using our US Small Cap 4 Risk Model, with the change coming almost entirely from the Market Factor and offset somewhat by increased Industry Risk.
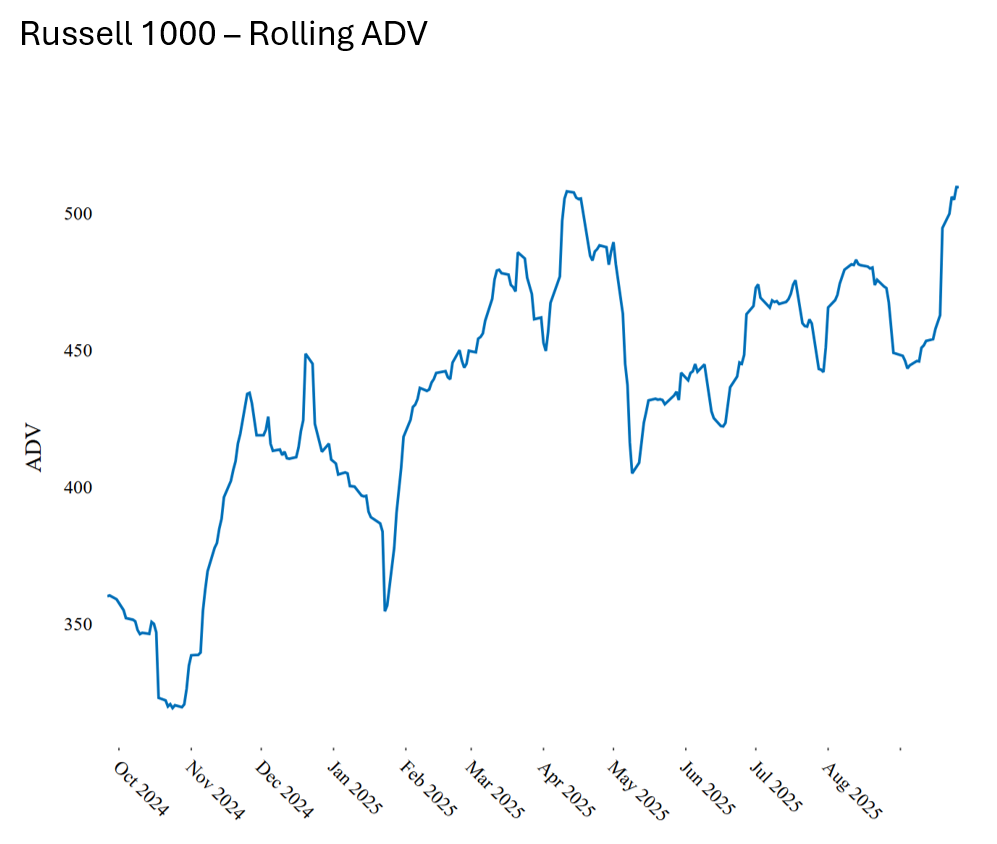
See chart from the Russell 1000 – US5.1 Equity Risk Monitor as of September 26, 2025
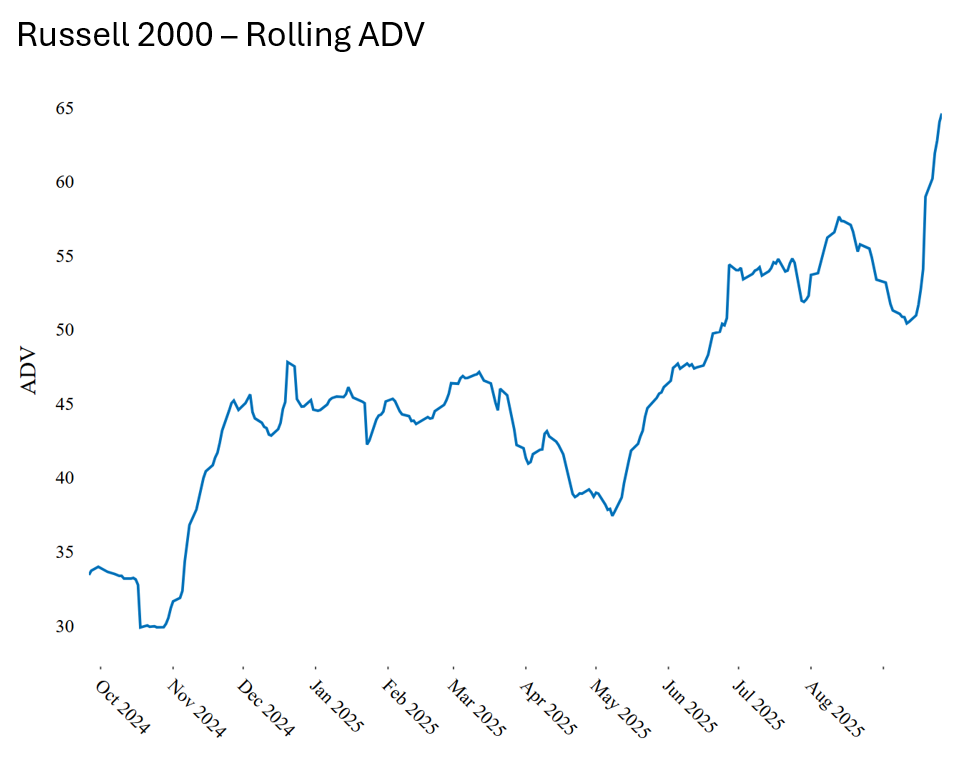
See chart from the Russell 2000 – USSC4 Equity Risk Monitor as of September 26, 2025
See chart from the Russell 1000 – US5.1 Equity Risk Monitor as of September 26, 2025
See chart from the Russell 2000 – USSC4 Equity Risk Monitor as of September 26, 2025
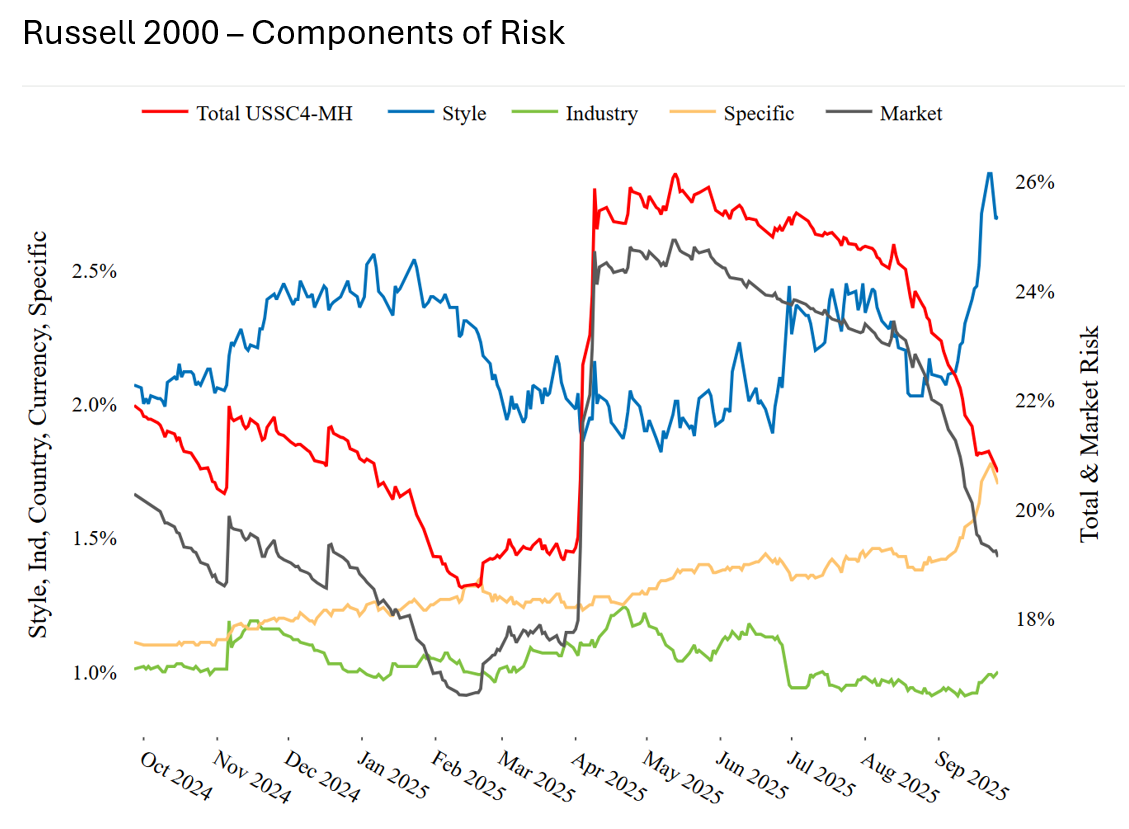
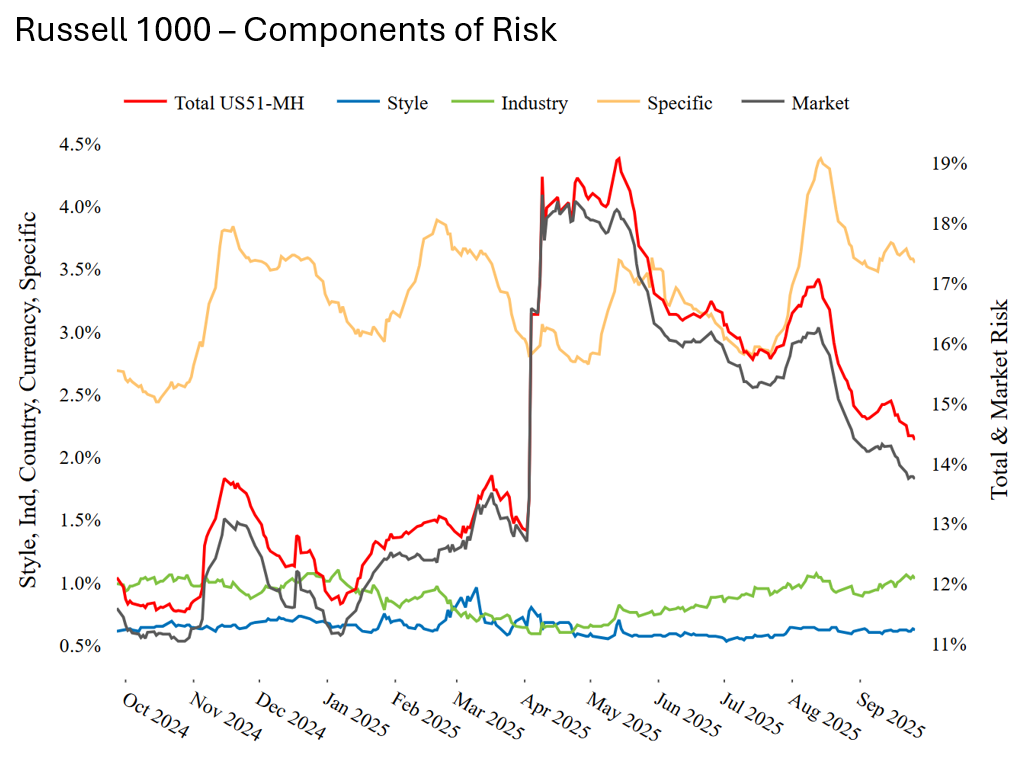
High ADV, Low Quality
Interestingly, both the Russell 1000 and 2000 have seen sharp increases in ADV for the last month. The small cap index traded at significantly higher clip when compared to the last year, including Liberation Day and the subsequent Tariff Tantrum. Currently, Style Risk in the Russell 2000 is nearly 4x higher than the Russell 1000, after steadily increasing over this period of elevated trading, peaking mid-week last Tuesday before beginning to fall. Total Risk has been declining steadily over the same period, driven by decreasing Market Risk, and as a result, the Style Risk increase has not significantly changed the Total Risk as measured by the model.
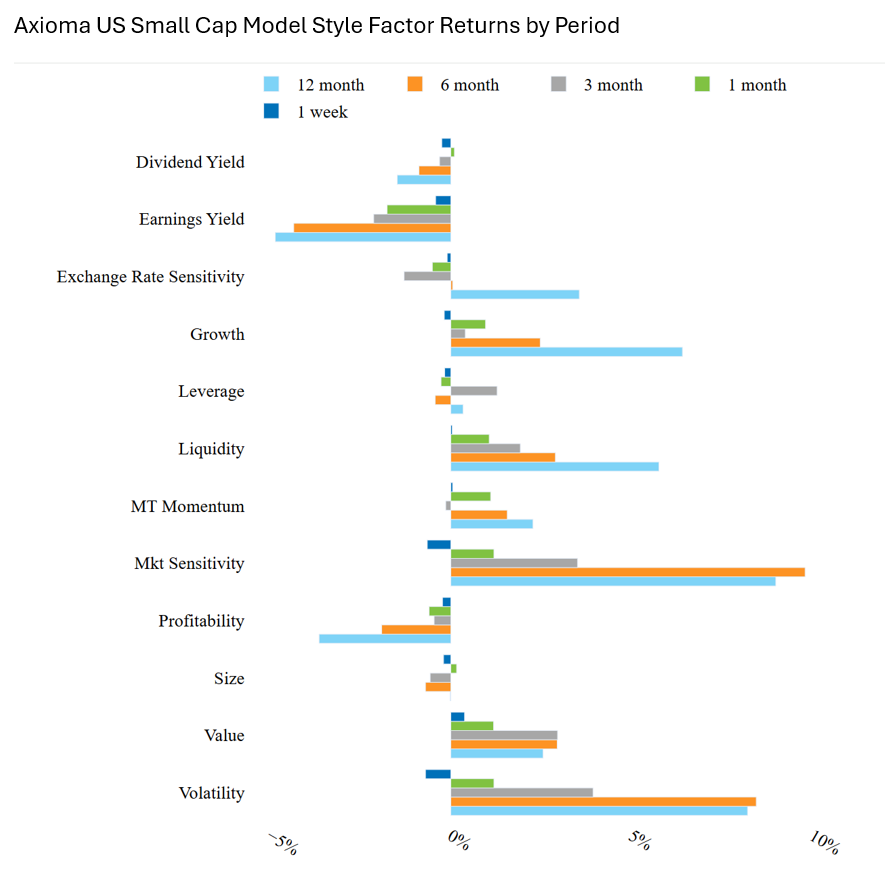
Only Earnings Yield has had a significantly negative return over the last month, and both Earnings Yield and Profitability have had negative returns over all periods measured. Historically, these two factors have a positive risk return premia, meaning that investors reward profitable names and cheap names on the basis of earnings. These two factors having negative returns for such a long period is a somewhat puzzling and possibly worrisome trend.
See chart from the Russell 1000 – US5.1 Equity Risk Monitor as of September 26, 2025
See chart from the Russell 2000 – USSC4 Equity Risk Monitor as of September 26, 2025
See chart from the Russell 2000 – USSC4 Equity Risk Monitor as of September 26, 2025
Japan’s So Hot Right Now
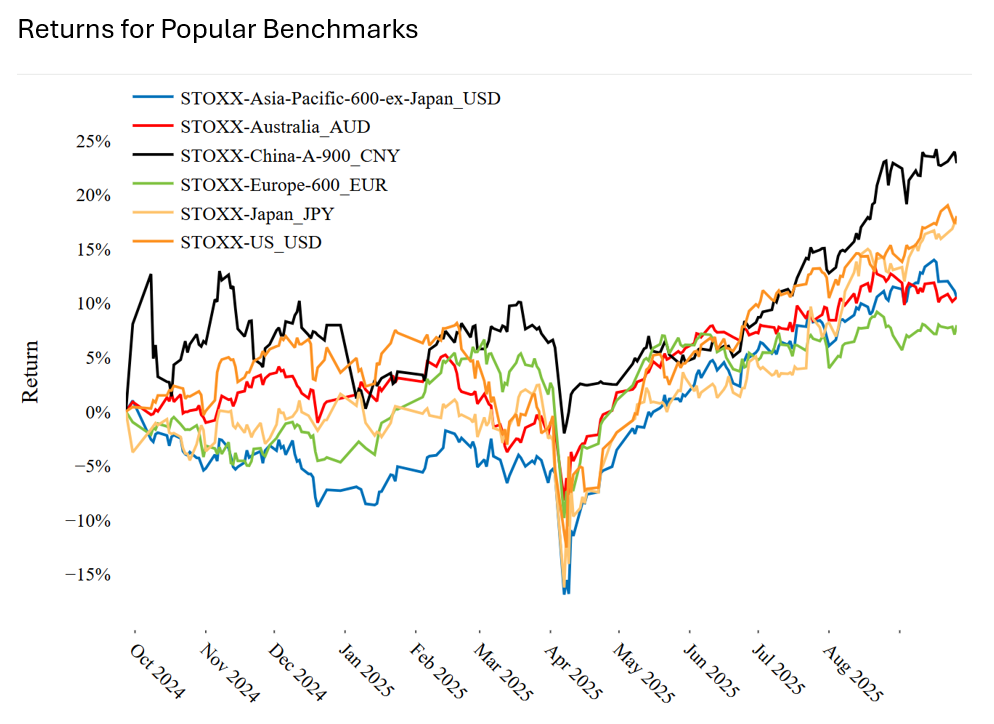
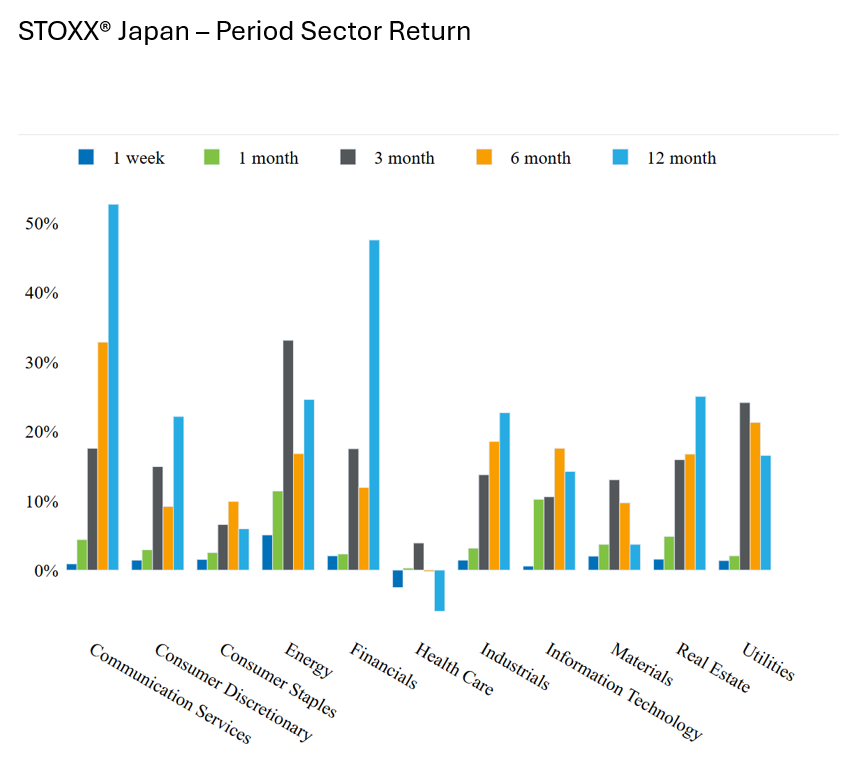
Among the international indices we track, the STOXX Japan had the largest increase last week, returning 1.21% while simultaneously seeing a -1.38% change in risk. Two weeks ago, the index fell on news that the Bank of Japan is planning on unwinding their ETF holdings, but last week, a weaker than expected Tokyo consumer inflation reading caused the index to rebound. This continues a strong run over the last year, with the STOXX Japan only being outperformed by the STOXX China A and STOXX US in our basket of indexes. Over the period, nearly all Sectors have had consistently positive performance in the STOXX Japan, with only Health Care experiencing negative returns. Conversely, both Communication Services and Financials led the index over the past year. From a Style Factor perspective, the top three performers are Market Sensitivity, Value, and Earnings Yield, while Size, Growth, and Exchange Rate Sensitivity have performed the worst.
See chart from the STOXX® Japan – AXJP4 Equity Risk Monitor as of September 26, 2025
See chart from the STOXX® Japan – AXJP4 Equity Risk Monitor as of September 26, 2025
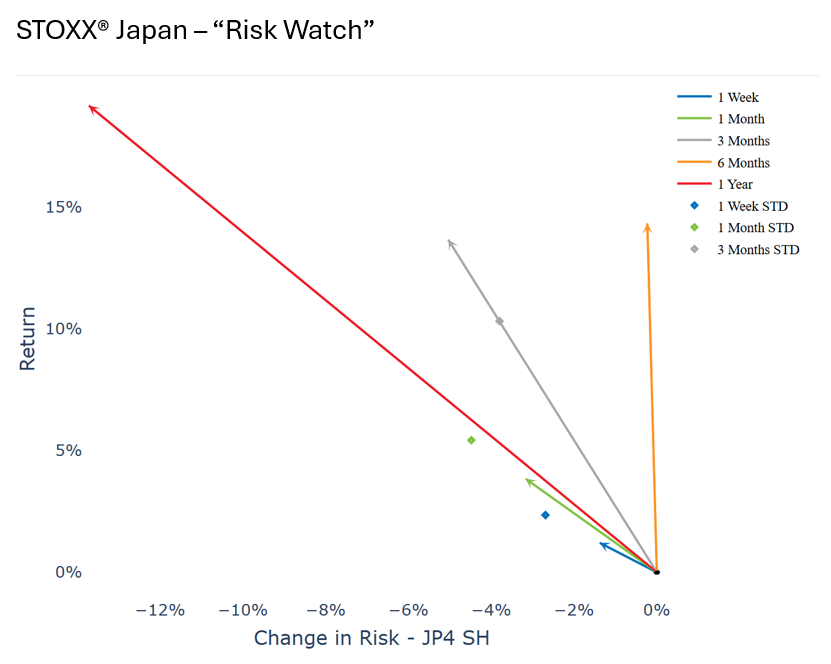
See chart from the STOXX® Japan – AXJP4 Equity Risk Monitor as of September 26, 2025
You may also like


