

EQUITY RISK MONITOR HIGHLIGHTS
WEEK ENDED OCTOBER 31, 2025
- Large Cap Outperforms Small Cap as Tech Drives Returns
- The Long View of Earnings Yield
- Sorry Marie Kondo, Owning Stuff is Good Again
AI, Tariffs, and The Fed, Oh My!
On Tuesday, October 28th, the S&P 500 hit record highs on trade negotiation optimism coming out of President Trump’s meeting with President Xi. A day later, the Fed cut rates by 25bps, and Powell’s comments threw cold water on the market’s hopes for another cut in December. Later in the week, Technology news drove returns—Meta and Microsoft announced further AI investment, while Apple and Amazon reported strong earnings.
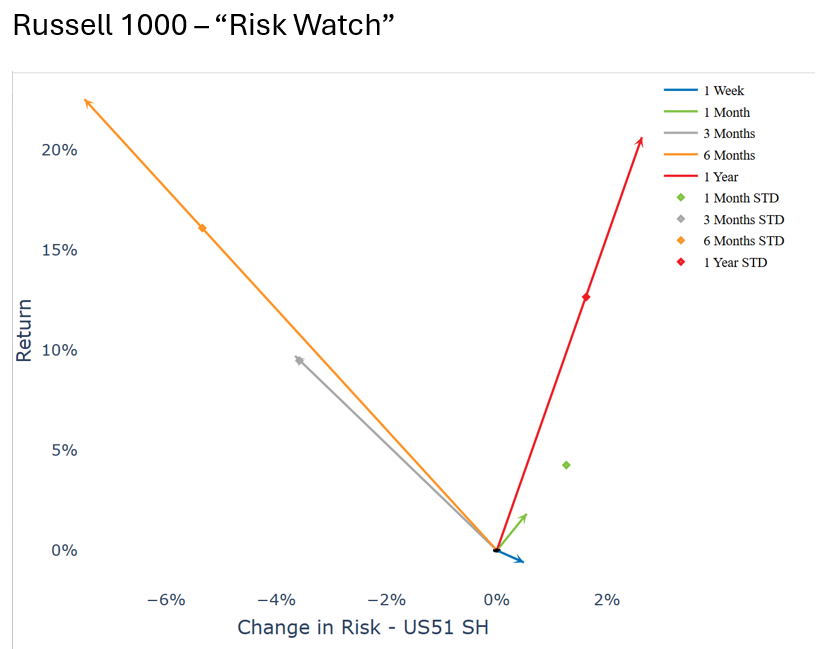
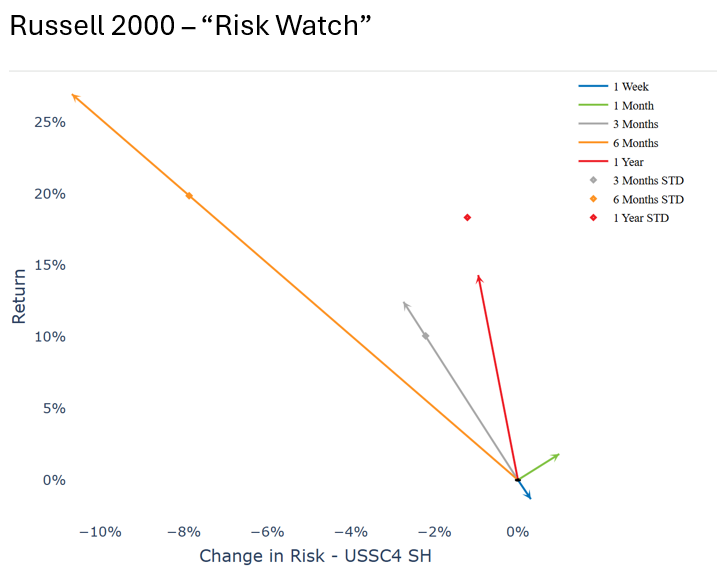
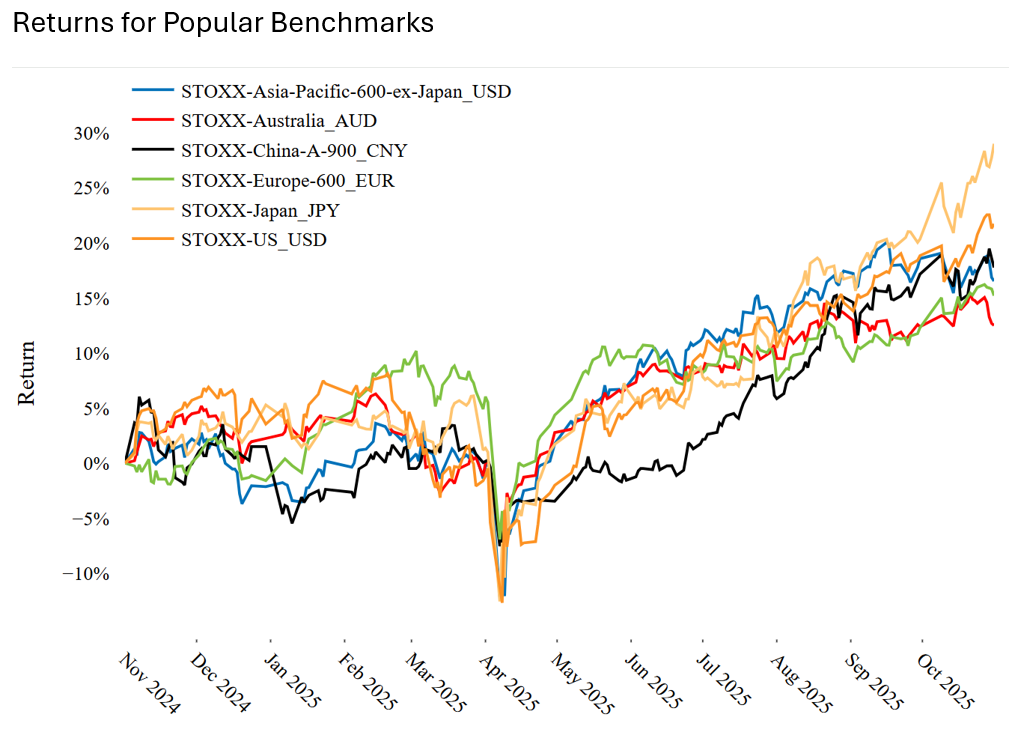
Over the past week, US large cap outperformed small cap with the Russell 1000 returning -60bps compared to the Russell 2000’s -1.34%. Risk in the Russell 1000 and Russell 2000, as measured by our US5.1 and US4 Small Cap Risk models, increased by 49bps and 31bps respectively, though the risk level of the Russell 2000 remains 2.27% higher. Outside the US, the STOXX Japan Index performed the best of the STOXX indexes we track closely by a considerable margin, returning 2.27% on the week. In fact, the Nikkei 225’s October was the best monthly return for the index since October of 1990.
See chart from the Russell 1000 – US5.1 Equity Risk Monitor as of October 31, 2025
See chart from the Russell 2000 Equity Risk Monitor as of October 31, 2025
See chart from the STOXX World Japan Equity Risk Monitor as of October 31, 2025
Value Stops Making Sense
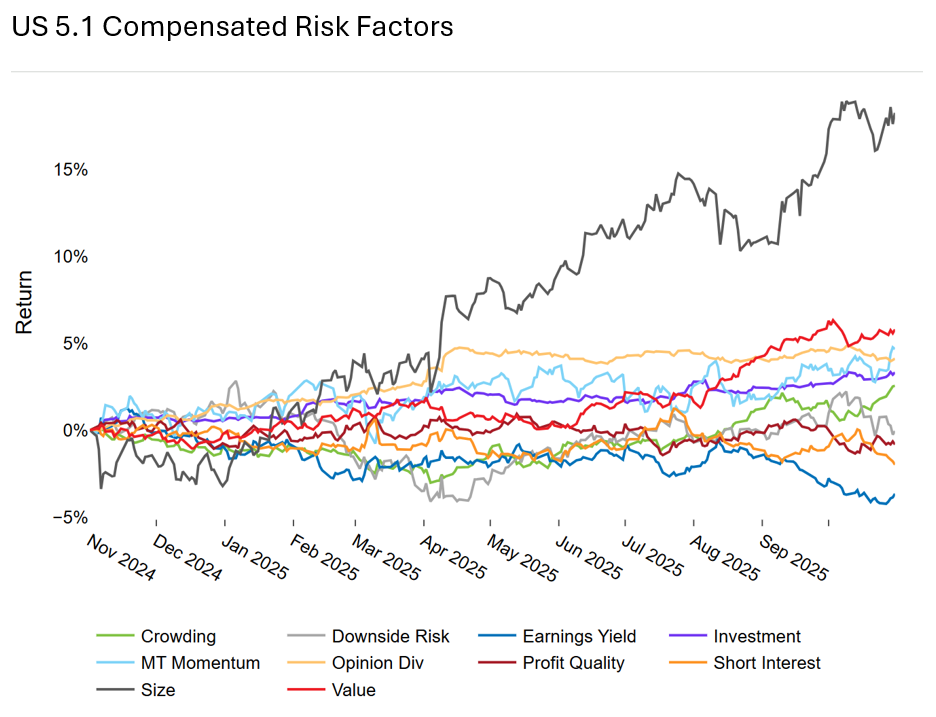
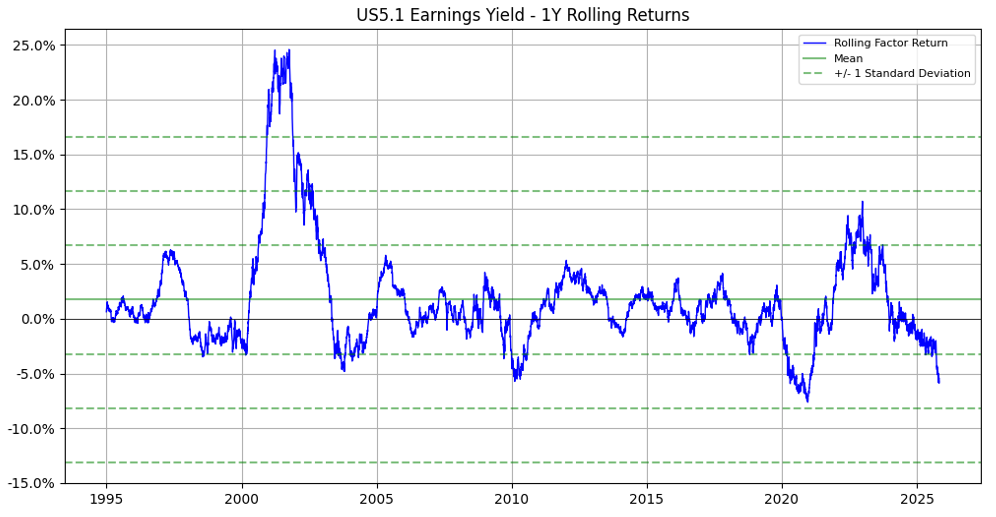
A few weeks ago, we wrote about the persistently negative performance in Earnings Yield and Profit Quality US5.1 factors over the past year (link here) and thought this week would be a good opportunity to revisit the poor performance for Earnings Yield in particular. While this past week Earnings Yield returns have recovered a bit, over the past year the factor has been consistently negative.
See chart from the Russell 1000 – US5.1 Equity Risk Monitor as of October 31, 2025
However, looking over a 30 year time period, Earnings Yield has had a positive mean return. The current 12 month trailing return is the most negative since the COVID period and is - 1.45 standard deviations below the mean.
The following chart is not included in the Equity Risk Monitors but is available on request:
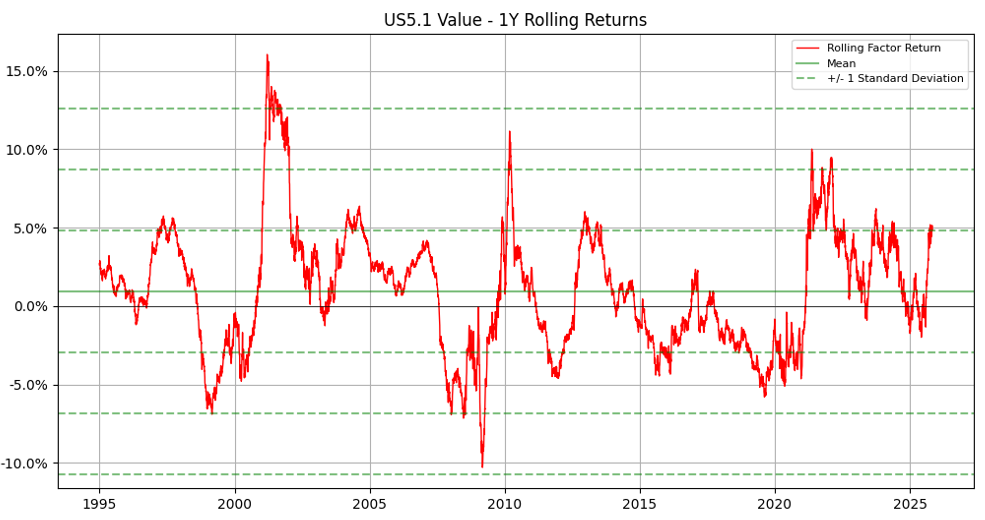
Looking back at our Compensated Risk Factor return chart, we see another Valuation factor has performed quite well over the past year—Book to Market Value (called “Value” in our model since Book to Market Value is the canonical Value factor going back to Fama-French). Here is the factor’s return over the past 30 years:
The following chart is not included in the Equity Risk Monitors but is available on request:
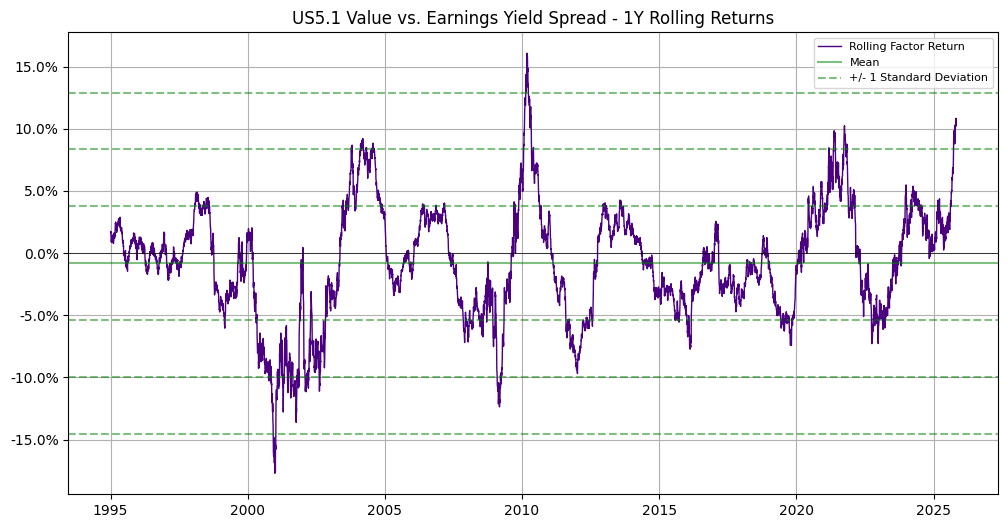
The spread of Value minus Earnings Yield shows that the divergence is even further away from the norm, but in the opposite direction from Earnings Yield, reaching over 2 standard deviations from the mean and having the highest reading since the period immediately following the Great Financial Crisis:
The following chart is not included in the Equity Risk Monitors but is available on request:
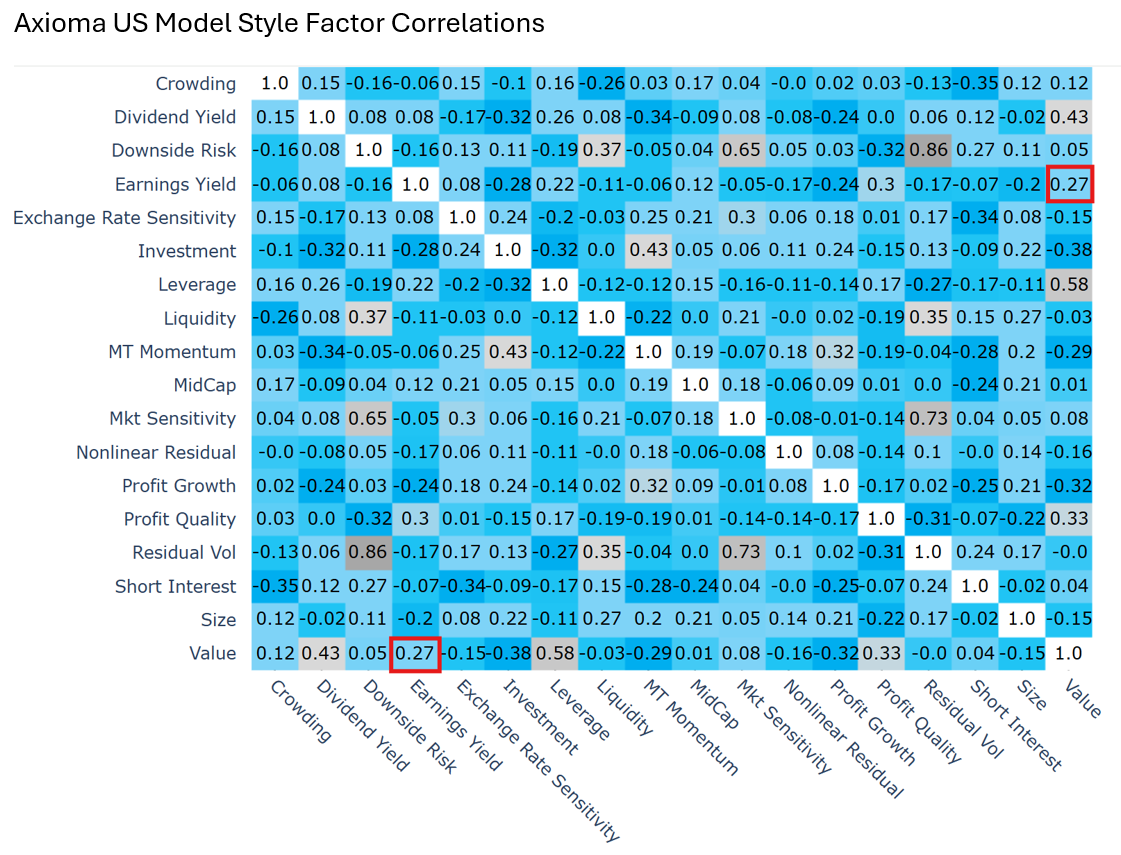
It is worth taking a moment to review the construction of these two factors. Value uses Book Value in the numerator while Earnings Yield uses a blend of backward and forward looking earnings. Both factors use Market Value in the denominator, which is why we classify these factors as Value factors. In isolation, we might expect them to move together since they share a similar construction and philosophy. Looking at the factor correlation computed by the US5.1 MH Risk Model, the ex-ante correlation reading of 0.27 confirms our intuition:
See chart from the Russell 1000 – US5.1 Equity Risk Monitor as of October 31, 2025
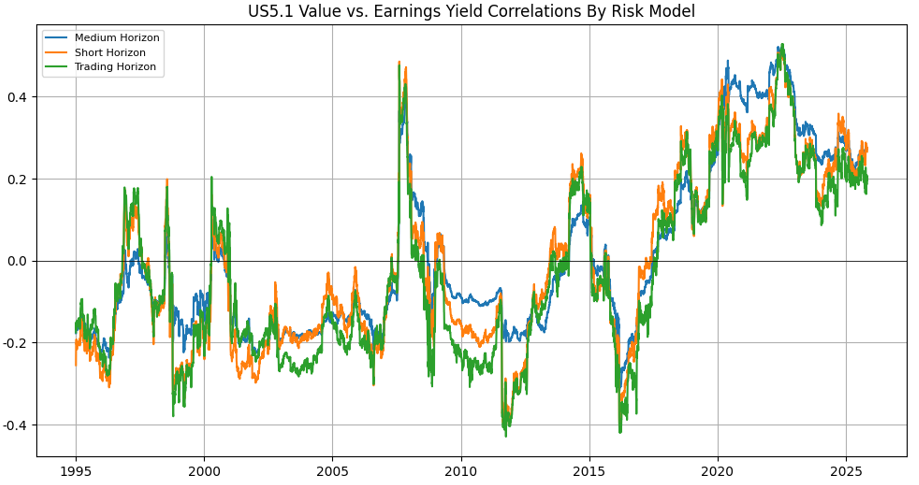
However, if we look back over 30 years, we see long periods of negative correlations. Since mid-2017, Earnings Yield and Value returns have exhibited the positive correlation we expect, though the correlation since 2017 peaked in May of 2022.
The following chart is not included in the Equity Risk Monitors but is available on request:
Tangibility is an Asset Once Again
How do we view this all together? Well, much has been written about the difficulty of Value investing since the GFC, and the general consensus points to the rise of intangible assets fundamentally changing how the market prices Book to Market Value. There’s even an entire award-winning book on the subject of intangible assets in the 21st century. More recently, Earnings Yield’s underperformance seems intuitive given the volume of AI news alongside lower interest rate expectations—the market is pricing in higher far-future earnings at a lower discount rate.
Yet, if we explain the Earnings Yield returns with the AI story, shouldn’t Book to Price also be negative since the dominance of Technology firms has focused the market on intangible assets? One way to square this circle is to consider that the market is rewarding AI-supporting tangible assets like datacenters filled with GPUs, the buildings and land they sit on, and the utilities that power them. All of that said, it is easy to construct a story from the data in hindsight—we will continue to monitor the data and do further research on the topic.
You may also like


