
EQUITY RISK MONITOR HIGHLIGHTS
WEEK ENDED DECEMBER 5, 2025
- Across most markets Value has had a strong year
- Trading volume has plunged, especially for US Small Cap Stocks
Across most markets Value has had a strong year
In last week’s highlights we discussed the performance of Crowding (highly positive, as expected) and Size (also highly positive, but in the opposite direction from expectations). This week we turn to Value, or book/price. The Value factor in the Axioma US5.1 model has been on a tear. Across most of the geographies we track closely Value’s six- and 12-month returns have been two to three standard deviation events, based on the risk forecast at the beginning of the period (when risk forecasts were generally higher than they are now). Although risk-adjusted returns have fallen under that two-standard-deviation threshold for the past one and three months, raw returns have still been positive.
The following chart is not included in the equity risk monitors but is available on request

Note: number above or below bars is the risk-adjusted return
Source: Axioma risk models
Last week saw a reversal of Value’s return in most regions. Drilling down into the factor’s US performance, we see that on Thursday, December 4, the factor had the lowest daily return since May 2023, and in fact one of its worst daily returns in the history of the model. On Friday, December 5 the factor bounced back, but the five-day return was still in the bottom decile of weekly returns. Still, Value’s performance this year remains impressive, and if it ends the year with a similar return 2025 would see the best Value return since 2001, and the fourth-highest return in the 44-year history of the model.
The following chart is not included in the equity risk monitors but is available on request

Source: Axioma risk models
To be sure, many factors’ returns this year are substantially different from their long-term averages. Value’s performance, however, is somewhat unexpected given the high level of market concentration and the focus on AI stocks which tend to have higher valuation levels.
The following chart is not included in the equity risk monitors but is available on request
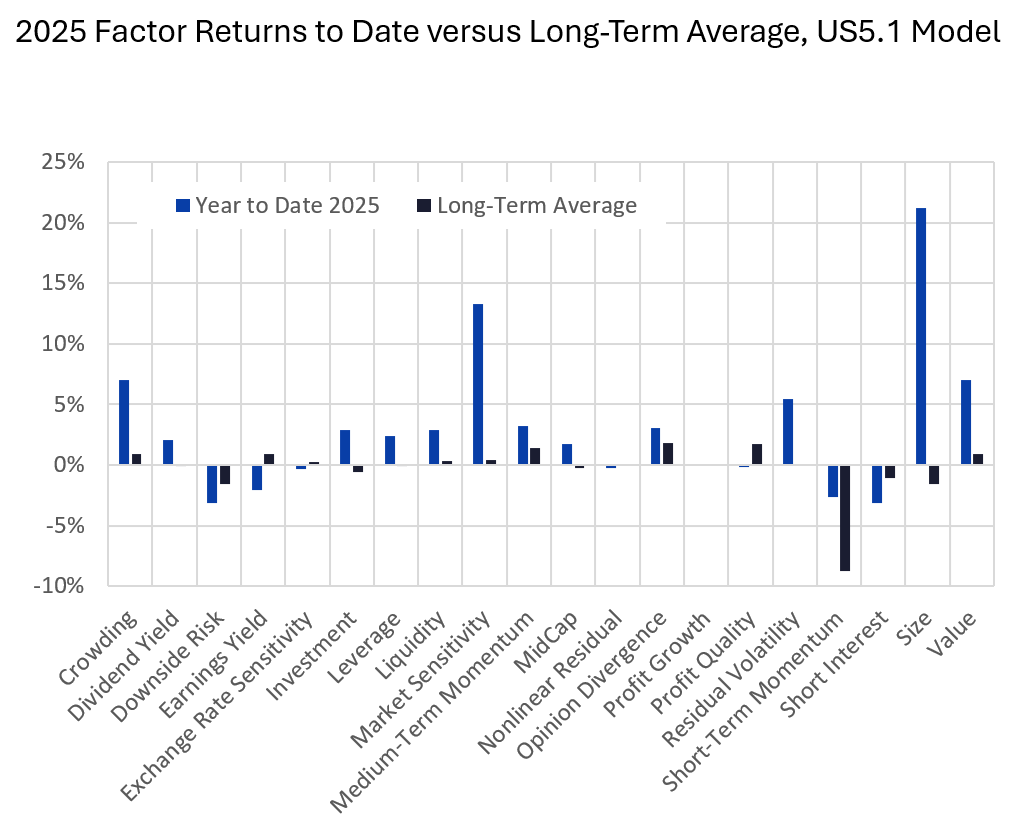
Source: Axioma risk models
Trading volume has plunged, especially for US Small Cap Stocks
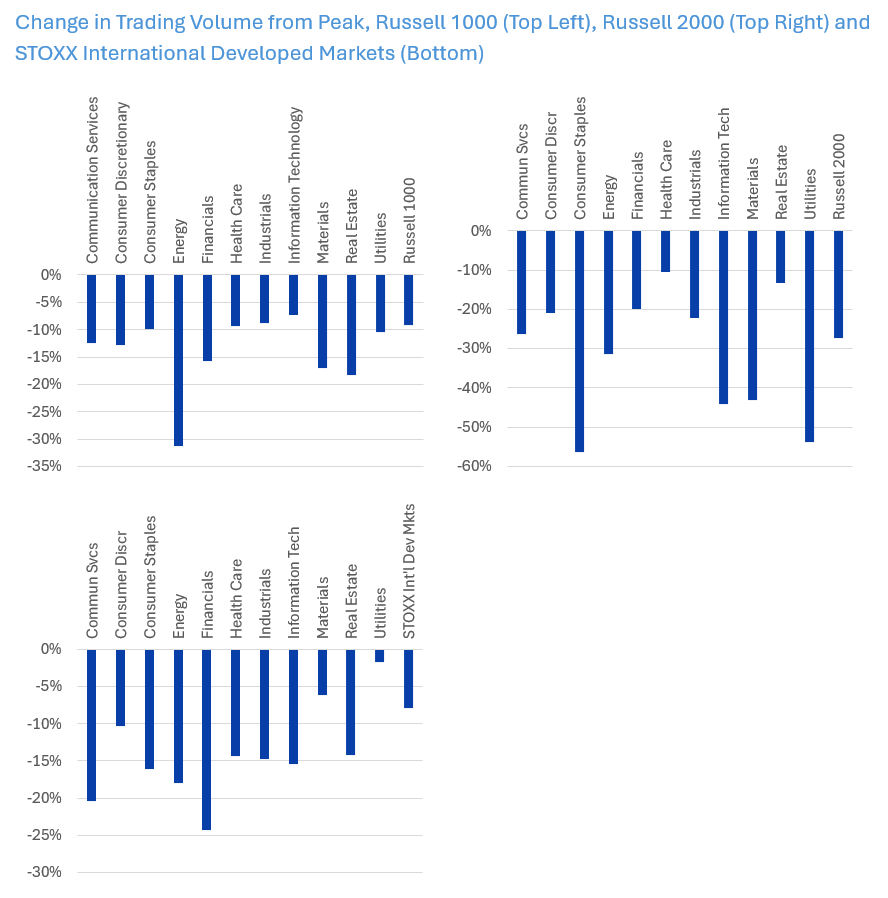
Russell 1000 Average Daily Volume ended last week down about 9% from its peak on November 25, although it remained substantially above the average for the past year. All sectors saw their volume decline, with the biggest percentage drop (31%)¬ in Energy. Not surprisingly, given the resurgent AI trade, Information Technology had the smallest decline, about 7%.
ADV for the Russell 2000 started to drop earlier. It has seen much bigger decline in volume compared to its peak in mid-October, down 27%, despite positive returns. In this universe, the biggest drops in volume were seen in Consumer Staples and Utilities; only Health Care and Real Estate volume dropped by less than 20%.
Developed Markets ex-US has also seen volume fall from its most recent peak. Here the overall drop was about 8%, with Financials and Communications Services leading the way, while Utilities’ decline was close to zero.
One might think this is the lingering result of the US Thanksgiving holiday shortened trading week, but the decline seems bigger than would be accounted for by the day and a half the market was closed. In addition, we looked back at the same chart from a year ago (using the same post-Thanksgiving period) and found that volume dropped only slightly. Of course, in 2024 it had not been rising all year. However, we believe falling volumes may be suggesting some investor fatigue this year, and a market rising on declining volume has less support.
See charts from the Russell 1000, Russell 2000 and STOXX Developed Markets ex-US Equity Risk Monitors of December 5, 2025


The following charts are not included in the equity risk monitors but are available on request
You may also like


