

EQUITY RISK MONITOR HIGHLIGHTS
WEEK ENDED FEBRUARY 13, 2026
- US market down, non-US markets up on very high trading volume
- Market action has rejiggered sector style exposures
- Another week of big returns, sharp reversal for US style factors; Worldwide model factors were much more stable
US market flat-to-down, non-US markets up on very high trading volume
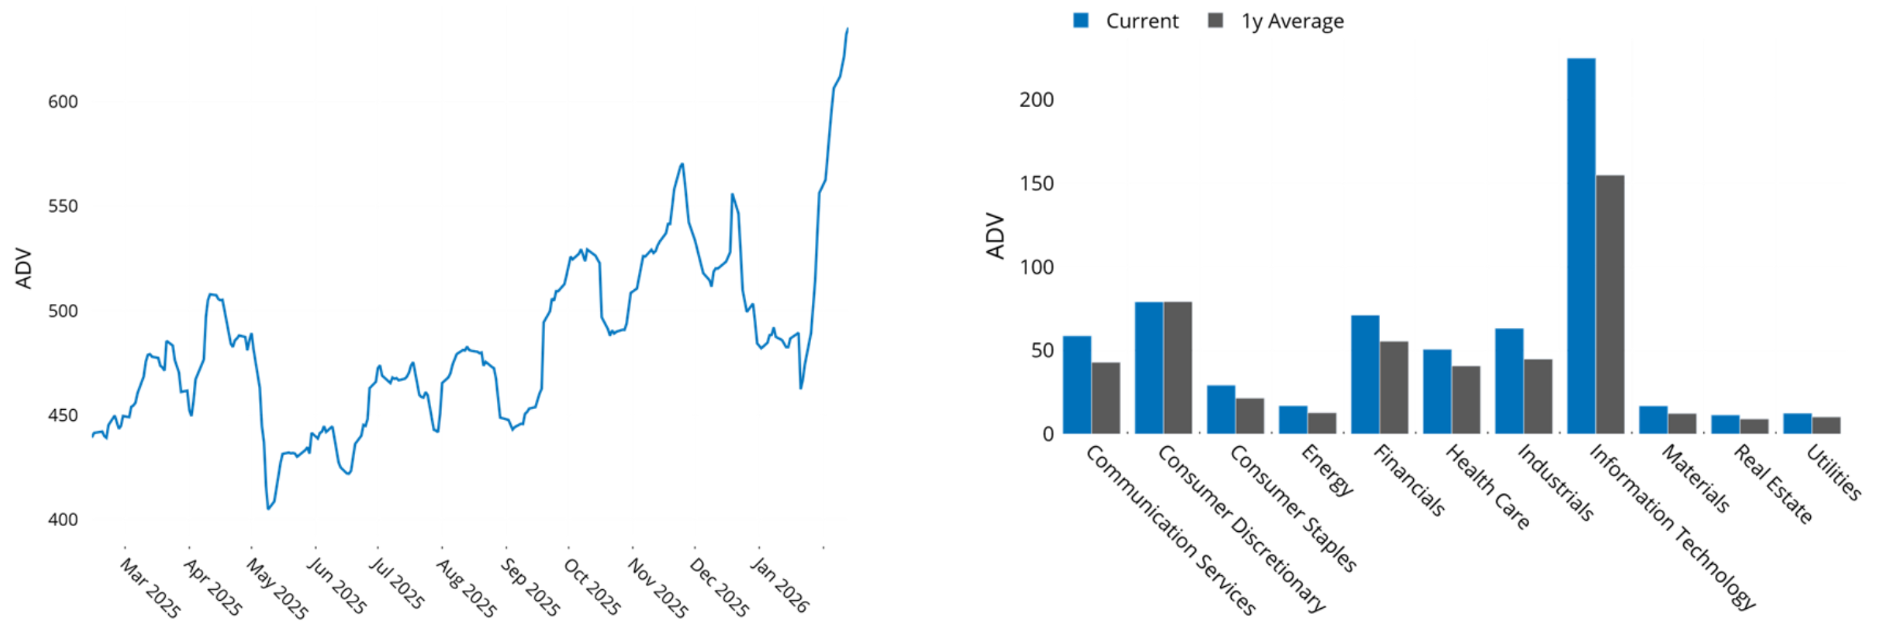
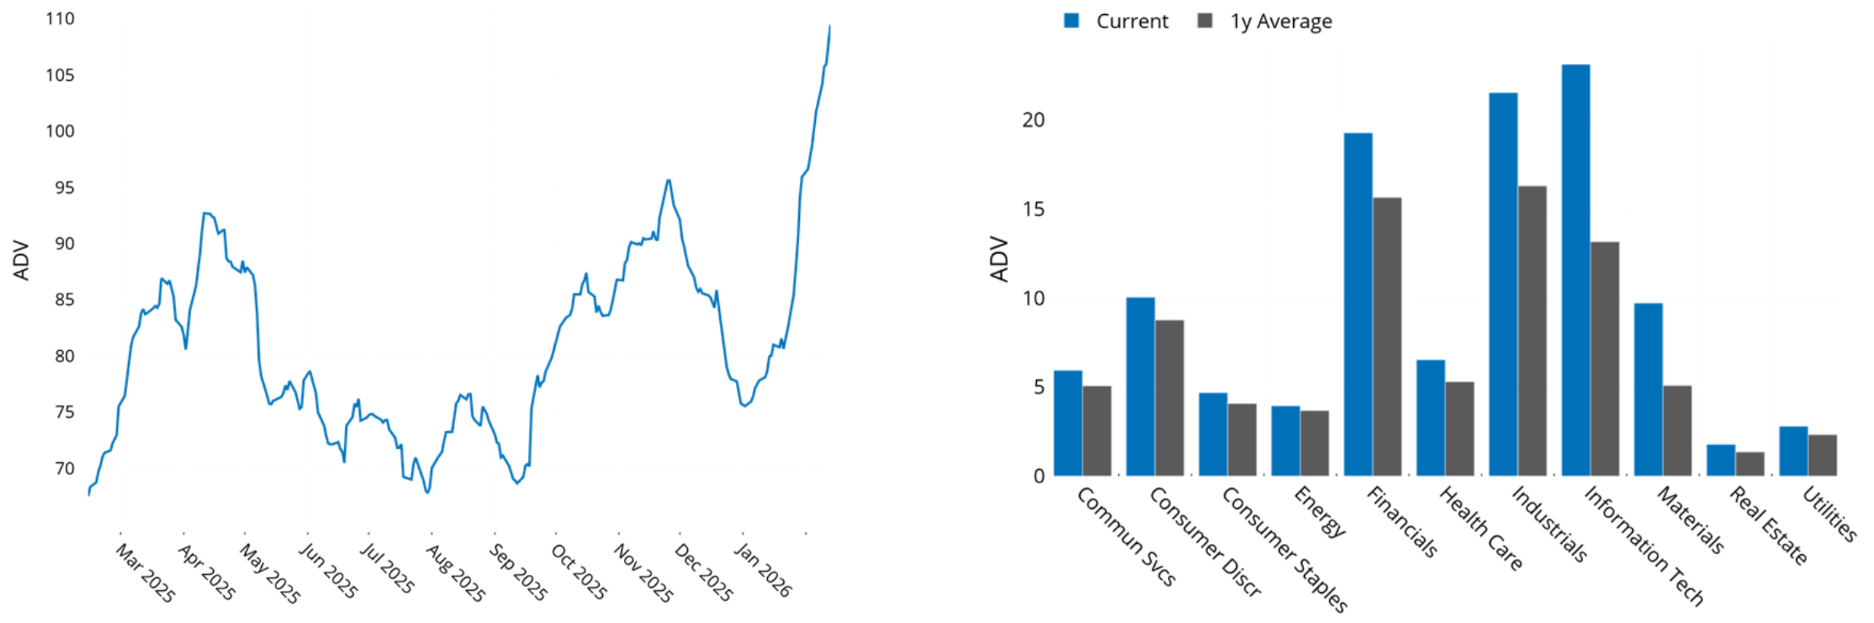
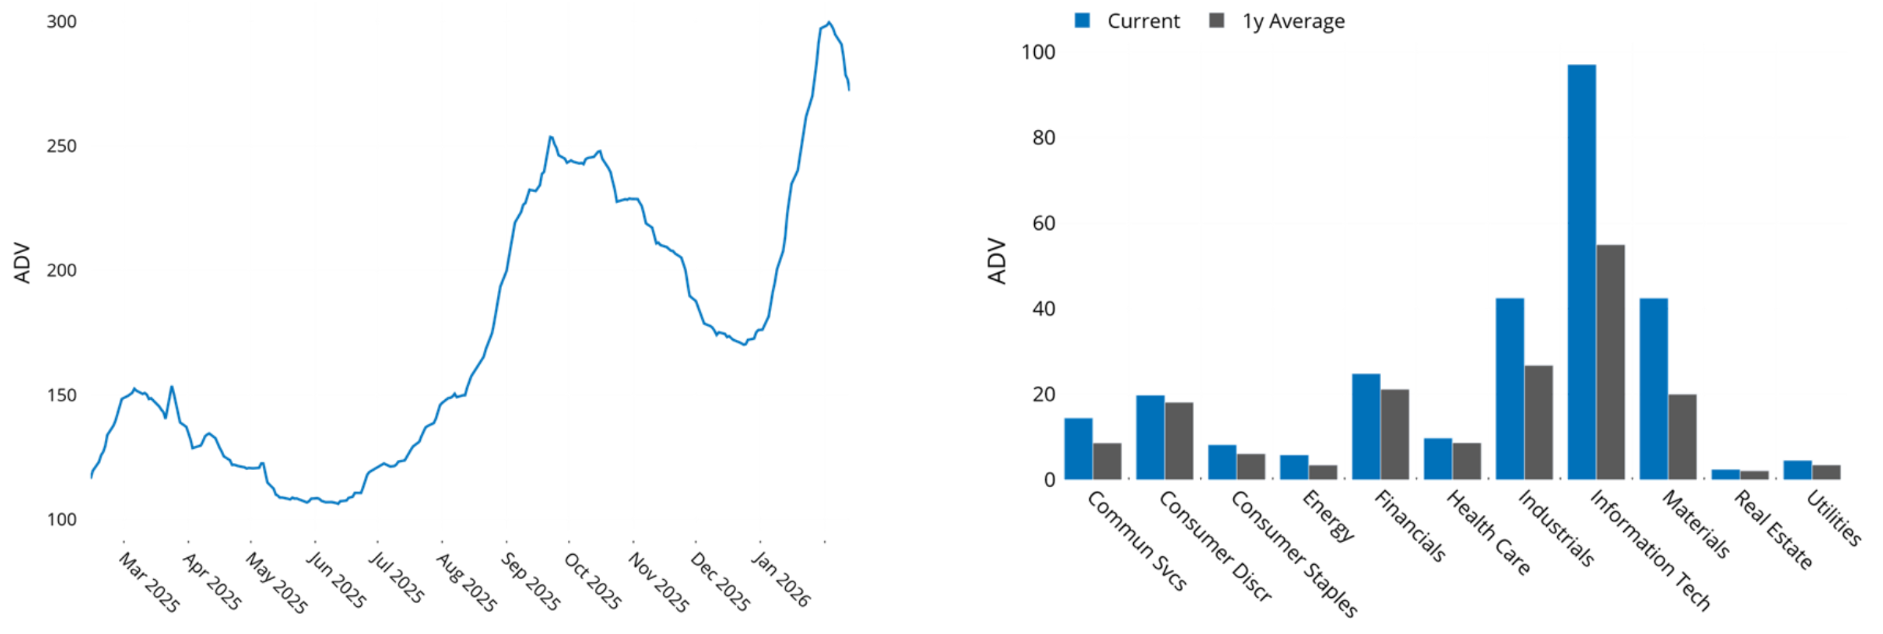
Trading volume has soared since the middle of January. Through February 13, volume for the Russell 1000 is up 44% as compared with a year ago, while the STOXX International Developed Markets Index has seen a 62% increase. Most notable is the increase for the STOXX Emerging Markets Index, where volume ended last week at 133% of the level of a year ago.
These increases are far in excess of what can be explained by market cap gains in the indices and are evident in almost every sector. In the US and Emerging Markets, the biggest gains have been seen in Information Technology, while Materials, where volume has increased threefold versus a year ago, has taken the lead for Developed Markets ex-US.
We see good news and bad news in these gains – good news for non-US markets, which have risen substantially more than the US, and potentially bad news for the US, where the implication is that investors are moving out of the US market. All three markets have gained since volume bottomed out about three weeks ago, but the US is up less than 1%, while Developed Markets ex-US is up about 5% and Emerging Markets has returned about 7%.
See charts from the Russell 1000, STOXX International Developed Markets and STOXX Emerging Markets Equity Risk Monitors as of February 13, 2026:
Rolling ADV (USD Billions) and ADV by Sector
Russell 1000
Stoxx International Developed Markets
STOXX Emerging Markets
Market action has rejiggered sector style exposures
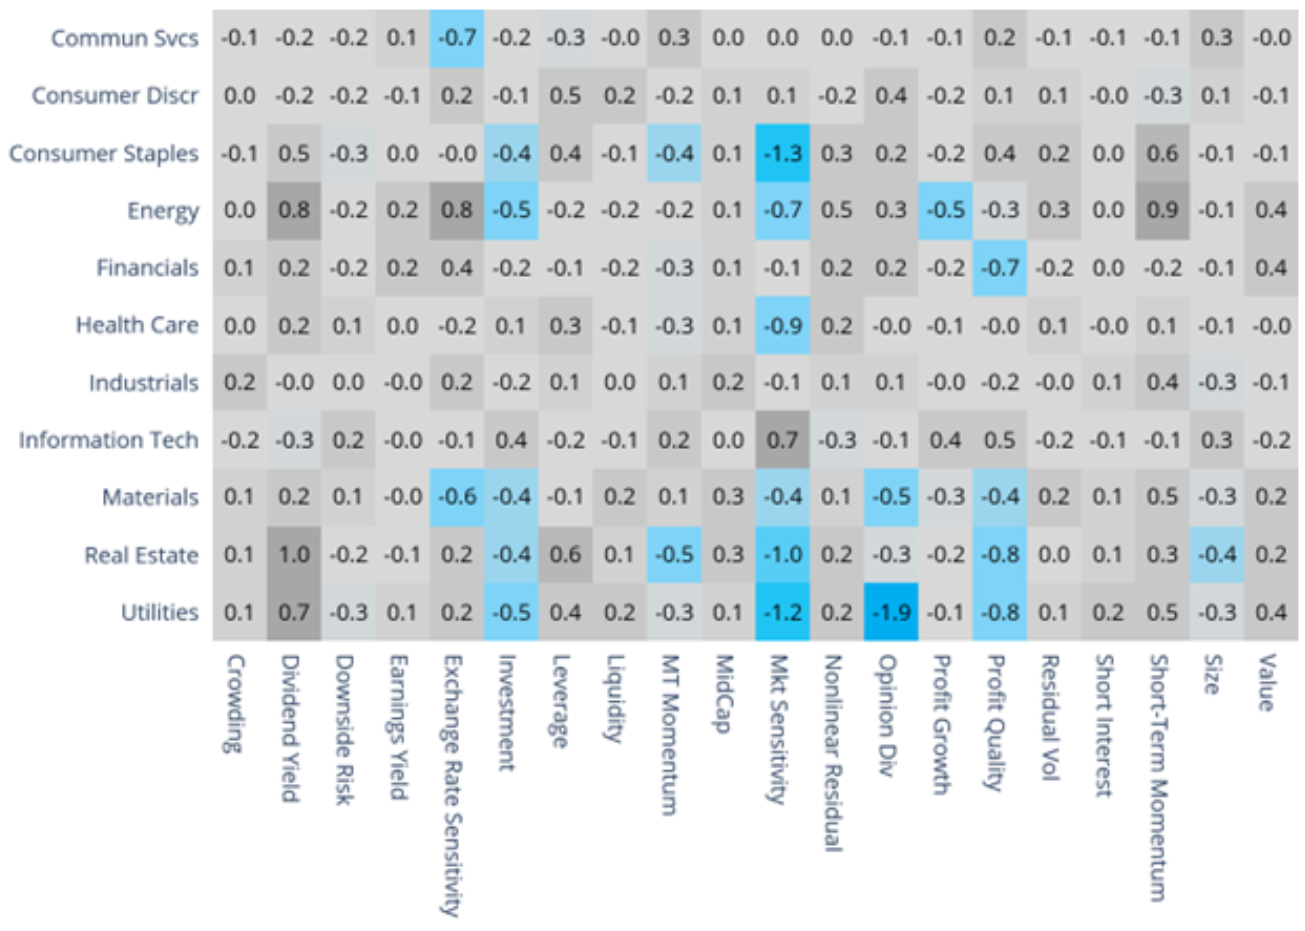
Market rotation also appeared in US sector exposures to US style factors. Some have remained stable (e.g. Size: the sectors with bigger or smaller names would not be expected to change substantially, so Info Tech has bigger names and a consistent positive exposure whereas Real Estate companies tend to be smaller with a steady negative exposure).
In contrast, others have seen some big changes since the end of 2025. Communications Services has seen its exposure to a number of factors, particularly Downside Risk, Exchange Rate Sensitivity, and Residual Volatility decrease by quite a bit. In addition, the sign of exposures changed for the Nonlinear Residual (negative to positive), Profit Growth (positive to negative) and Residual Volatility (positive to negative).
Consumer Discretionary’s exposure to Downside Risk went from positive to quite negative. Consumer Staples’ Downside Risk became more negative, while its Exchange Rate Sensitivity became less negative. Energy’s Exchange Rate Sensitivity is still higher than that of any other sector, although the exposure has fallen. Energy’s positive returns increased its exposure to the Nonlinear factor but its Residual Volatility also rose.
Downside Risk for Health Care went from negative to positive, but Health Care’s Medium-Term Momentum exposure fell more than the exposure of any other sector (from slightly negative to even more so). Industrials saw their Exchange Rate Sensitivity and Medium-Term Momentum exposures move from close to zero to positive. Information Technology’s Downside Risk became more positive, although its Residual Volatility dropped slightly.
Also notably, we did not see big changes in sector exposures to Crowding or Short Interest.
The changes may be interesting to portfolio and hedge fund managers, depending on their sector weighting decisions, as they may have changed some of the risk profile even if the manager did not rebalance.
See chart from the Russell 1000 Equity Risk Monitor as of February 13, 2026:
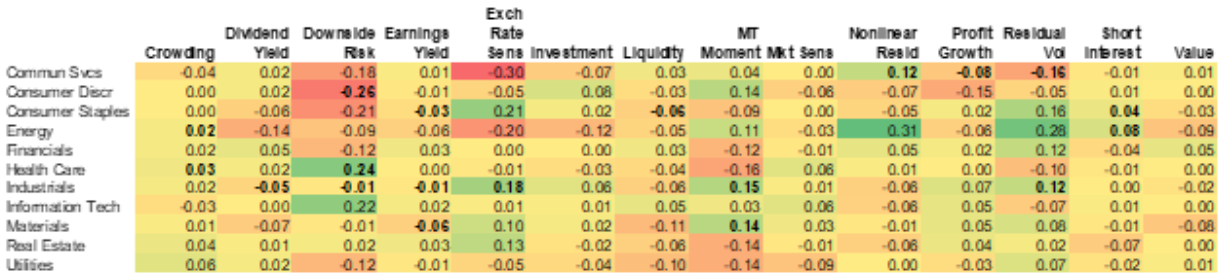
Russell 1000 Sector Style Exposures (US5 Model)
The following table does not appear in the risk monitors but is available on request.
Changes in select sector style exposures, December 31, 2025 to February 13, 2026
Another week of big returns, sharp reversal for US style factors; Worldwide model factors were much more stable
In last week’s highlights we noted the unusually high magnitude of many daily style factor returns in Axioma’s US5.1 risk model, often in the opposite direction of what would have been expected given the long-term average factor return. This has made navigating the current environment as a factor investor particularly difficult.
In the US5.1 model over the past week we once again saw a number of factors with more than one day of returns outside a two-standard-deviation band. These factors include Medium-Term Momentum, where returns fell outside the band four of five days, one in the “wrong” (negative) direction. The magnitude was still lower than in the prior week, and overall the return for last week was positive.
The Nonlinear Residual factor also exceeded the bands in four of the five days, with two of those positive and two negative (and an up-and-down daily pattern). The Nonlinear factor in the US largely reflects Size cubed and Size squared, but also the cross-product of Short Interest and Size, Liquidity and Size, and Crowding and Size. The interpretation of these cross-product terms is that Short Interest, Liquidity, and Crowding are likely to show a different pattern of returns among smaller names than among larger ones.
Opinion Divergence and Profit Growth had three days with high magnitude returns and Short-Term Momentum and Residual Volatility had four such days, but perhaps the most interesting was Profit Quality, where returns fell outside the two-standard-deviation range all five days last week, four of the days saw negative returns (when expectations are positive), and the factor only “recovered” on Friday. Overall, the factor’s return was more than three standard deviations below the long-term five-day average last week.
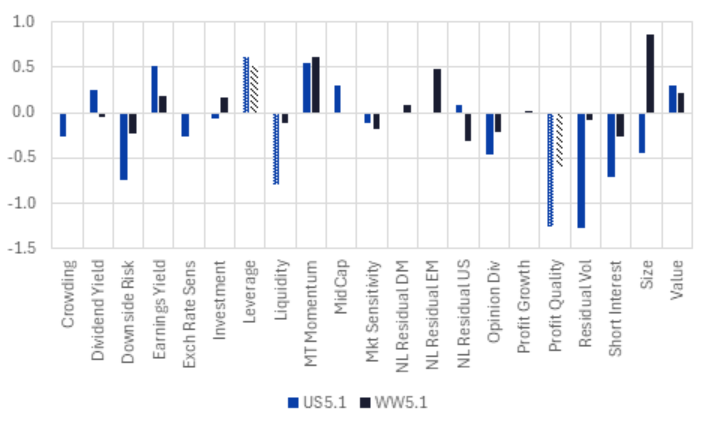
We focus on the US5.1 model here because we did not see the same level of daily fluctuations in the WW5.1 (Worldwide) model. In that model, most factors experienced at most one day of outsized return. Leverage and Profit Quality were the only factors to see two days falling outside the range, and no factors had more. These big factor moves and day-to-day whipsawing seem to be a US-only phenomenon.
If you had the week off and only looked at factor returns after the week ended, you may not have noticed the fluctuations or even big difference between the US and Worldwide models. Most returns for the full week were within expected limits and in the “right” direction (given long-term average returns). But if you were trying to monitor performance and realized active risk daily, you may have felt much more overwhelmed as a US style-based investor.
The following charts do not appear in the equity risk monitors but are available on request:
Daily returns and two-standard-deviation bands, Axioma US5.1 model
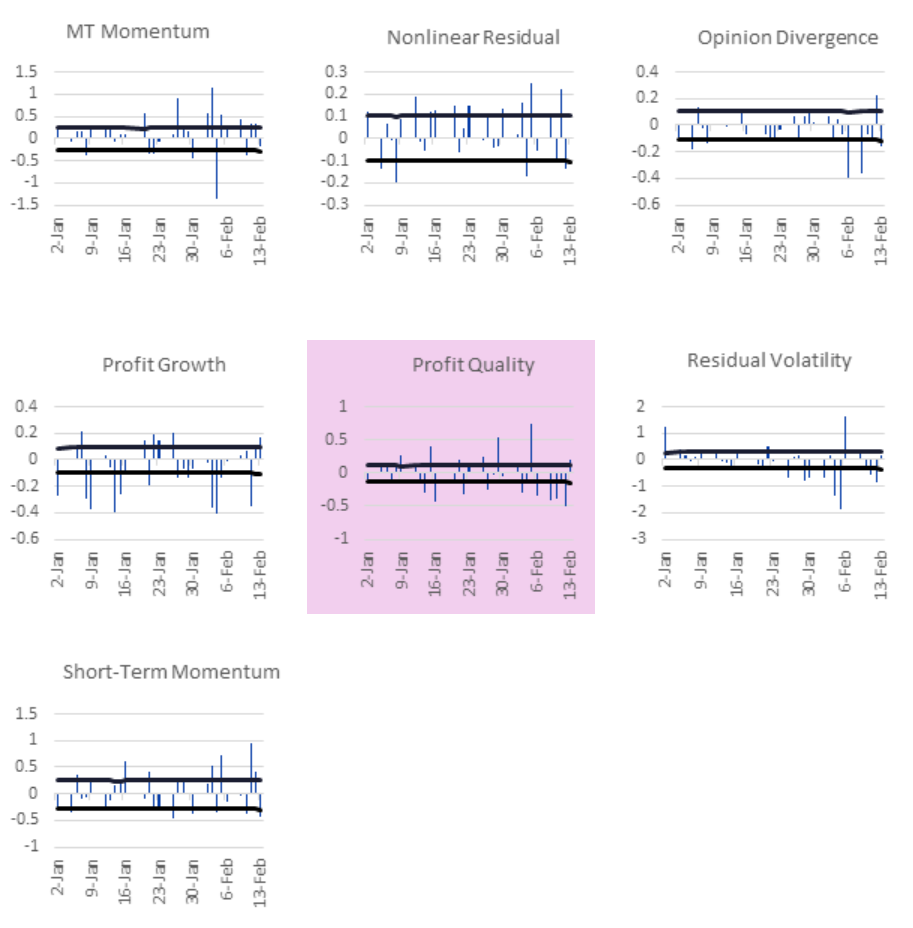
Factor returns for the five days ended February 13, 2026
Note: patterned bars were more than one standard deviation above or below the long-term average return
You may also like


