

EQUITY RISK MONITOR HIGHLIGHTS
WEEK ENDED FEBRUARY 27, 2026
Axioma Risk Monitor: US small caps face sharper pressures; Sector rotation signal partial but not full risk-off positioning; Oil & Gas Industry Factor surges, but with stable volatility
US small caps face sharper pressures
Last week was defined by pronounced "risk-off" sentiment as unease intensified around the pace of the “AI revolution”, persistent inflation, renewed tariff uncertainty, and mounting geopolitical strains. Both the Russell 1000 and Russell 2000 finished the week lower, falling 40 and 120 basis points, respectively.
A major source of that anxiety stemmed from escalating tensions in the Middle East. Concerns have been growing since mid January, when the US began deploying air and naval forces to the region at levels not seen since the 2003 Iraq War. Fears of an imminent US strike on Iran—which ultimately occurred over the weekend—pushed crude oil prices higher. Rising energy costs tend to weigh more heavily on small cap companies than on large caps, amplifying their downside.
The data released on Friday added further pressure. The Producer Price Index (PPI) surprised to the upside, reinforcing the view that inflation remains “sticky.” Weekly jobless claims nudged up to 212,000, offering the Federal Reserve little incentive to consider aggressive rate cuts. If oil continues to feed inflation, the Fed is even more likely to maintain elevated rates. Small caps, with their larger exposure to floating-rate debt, remain particularly sensitive to a “higher for longer” rate environment.
Trade policy uncertainty added another layer of complexity. After the Supreme Court struck down tariffs enacted under the IEEP Act, President Trump turned to a different legal mechanism that allows temporary import surcharges to address severe balance of payments issues. Using this authority, the administration imposed 10% tariffs beginning Tuesday while pursuing a more permanent solution.
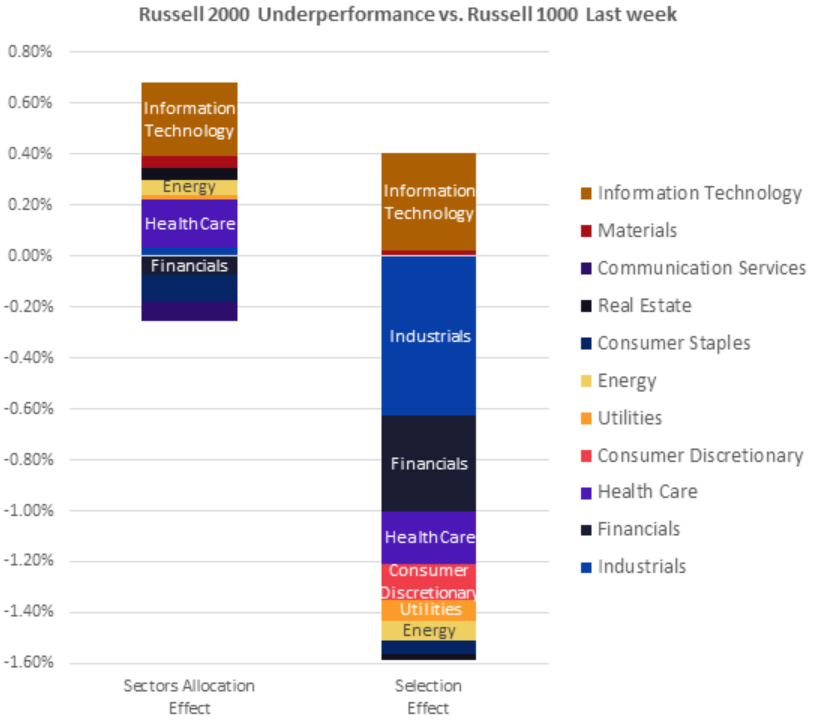
Sector performance further highlighted the divergence between large and small cap behavior. While Information Technology was the main drag on US large caps, the sector actually rose within the Russell 2000.
Meanwhile, Financials, Consumer Discretionary, and Industrials declined across both benchmarks, with losses significantly deeper in the small cap universe, driving much of the Russell 2000’s underperformance. Even sectors that registered gains—Health Care, Energy, and Utilities—contributed negatively to relative performance because their increases were less than half the magnitude seen in the Russell 1000.
While still showing positive returns, Health Care, Energy, and Utilities were also large contributors to Russell 2000’s underperformance, as their weekly gains were less than half as they were in the Russell 1000.
Despite last week’s setback, small caps still hold a six percentage point year-to-date lead, supported by the strong rotation earlier this year out of crowded large caps and into long neglected smaller names. For further details, see blog post From Overlooked to Overperforming: The Factors Fueling Small Cap Strength.
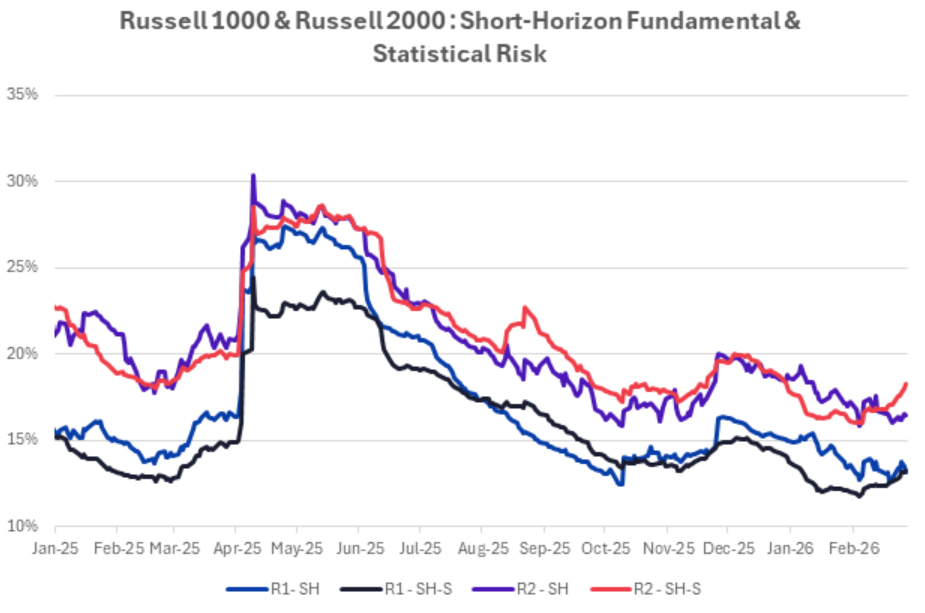
Risk rose for both the Russell 1000 and Russell 2000, with statistical forecasts increasing more than fundamental ones in the US4 All Cap and Small Cap short horizon models. For the Russell 1000, the two views aligned, but in the Russell 2000 the statistical estimate exceeded the fundamental one, suggesting that the statistical model may be capturing short-term dynamics that the fundamental model is missing.
The charts below are not included in the Equity Risk Monitors but are available upon request:
Sector rotation signal partial but not full risk-off positioning
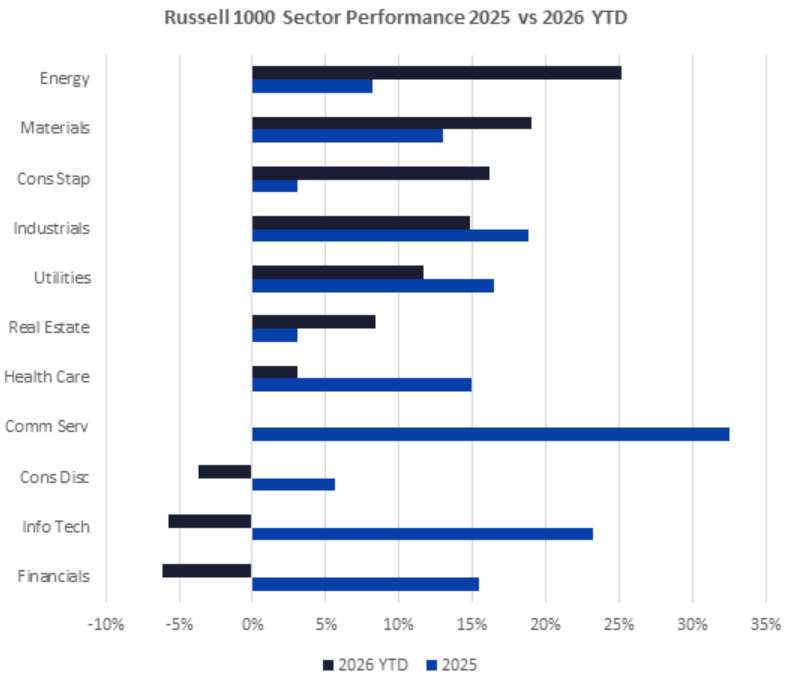
Two months into 2026, sectors that lagged last year within the Russell 1000 have climbed to the front of the pack. Even so, investors have not shifted entirely into defensive mode, as non-tech cyclical segments continue to deliver solid performance.
Energy, boosted by the recent upswing in oil prices, is up 25% year-to-date, with Materials following at 19%. Industrials—despite last week’s pullback—remains the fourth best performer at 15%. By contrast, last year’s leaders, Communication Services and Information Technology, have slipped as markets reassess winners and losers in the evolving AI landscape.
Information Technology has been the primary driver of the broader US equity downturn in February, as enthusiasm around “AI” has faced meaningful resistance in 2026. Even though NVIDIA reported strong results on Wednesday, its stock faced immediate selling pressure, signaling that investors are becoming more selective and demanding regarding AI valuations.
Software stocks experienced a steep selloff in early February as well. Earlier in the AI cycle, investors assumed AI would fuel greater software demand but recent breakthroughs suggest AI may instead make some conventional software offerings obsolete, threatening corporate business. For more details on how the Axioma US5.1 Software Industry Factor had been flashing warning signs since April 2025 see blogpost AI Didn’t Break Software Overnight—The Industry Factor Saw It Coming.
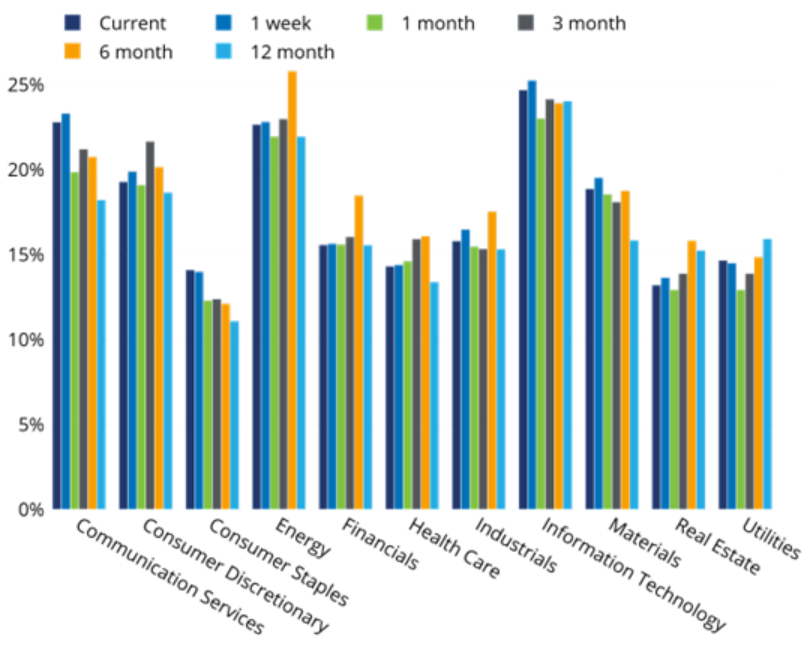
At present, Information Technology remains the riskiest sector, followed by Communication Services, with Energy close behind. Due to its dominance in the US market, Information Technology is responsible for nearly half of the Russell 1000’s risk while Energy’s contribution to the index risk is even less than its small weight (3%).
The chart below is not included in the Equity Risk Monitors but is available upon request:
See charts from the STOXX Russell 1000 Equity Risk Monitor as of 27 February 2026:
Russell 1000® - Sector Risk
Russell 1000® - Sector Weights and % of Risk
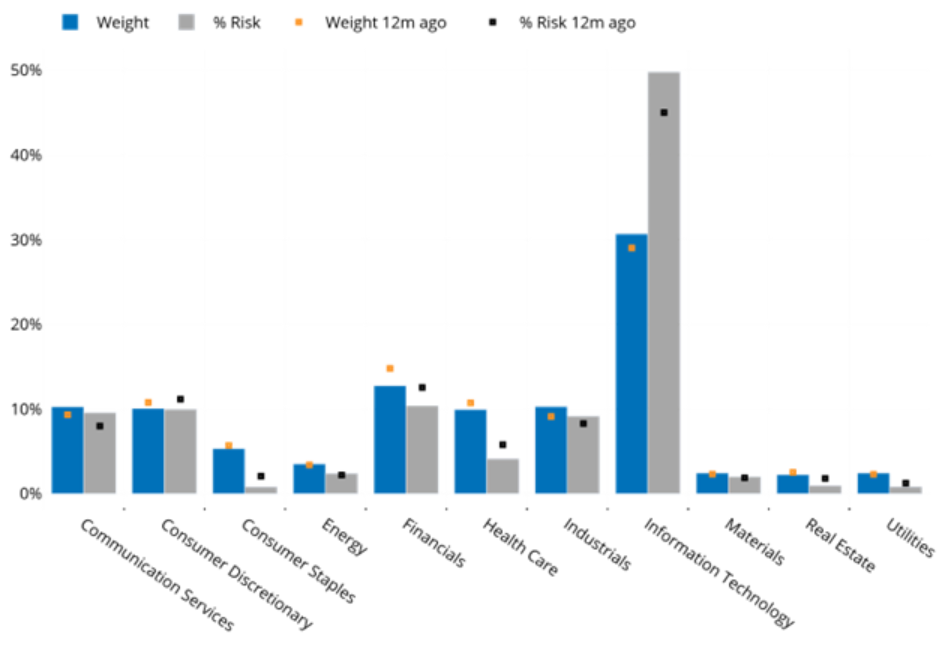
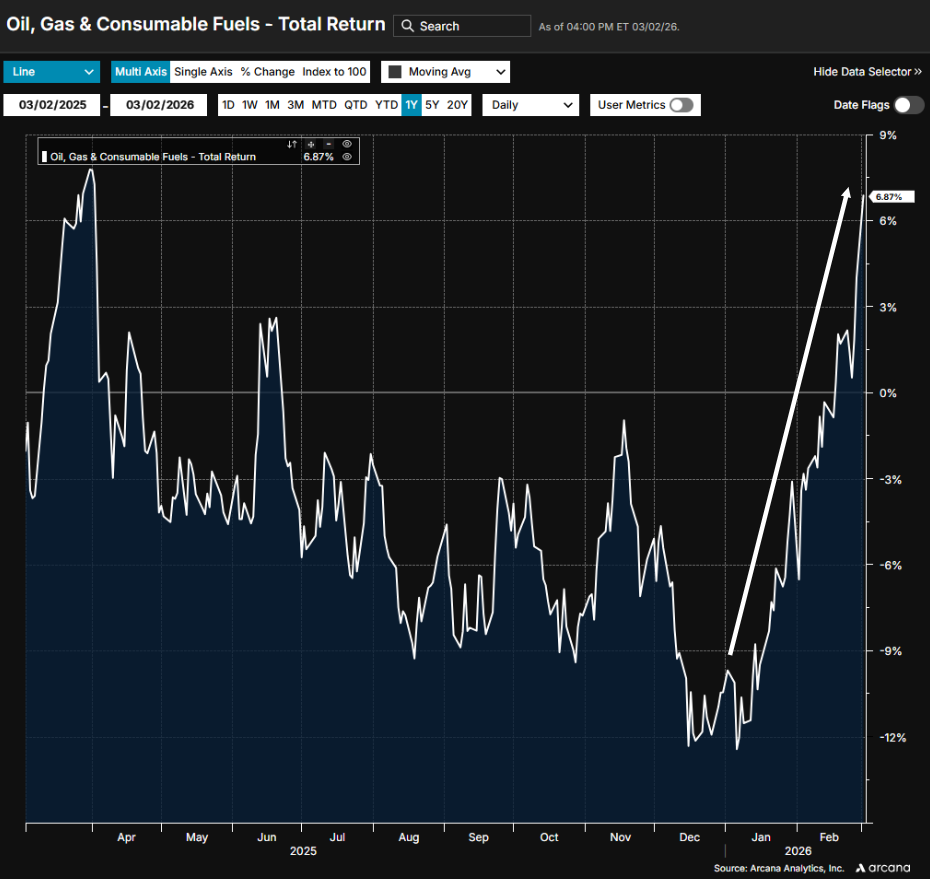
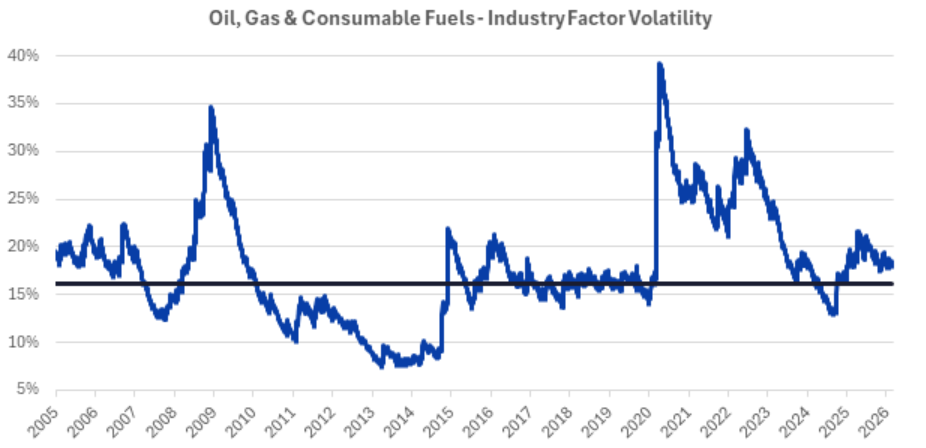
Oil & Gas Industry Factor surges, but with stable volatility
Within Axioma’s US5.1 fundamental short horizon model, the Oil, Gas & Consumable Fuels Industry Factor has climbed sharply in 2026—well before the latest escalation involving Iran. The rise reflects not only geopolitical concerns but also unexpected supply disruptions and severe winter weather that tightened short-term availability and introduced a risk premium into the market. After declining throughout 2025, the factor has reversed direction, rising 16% over the past two months.
Despite this surge, volatility in the factor has remained relatively steady this year, hovering near 18%. This is only slightly above its long-term median (of 16%) and far below the dramatic peaks observed during the Covid crisis (40%) and the Global Financial Crisis (35%).
The charts below are not included in the Equity Risk Monitors but are available upon request:
You may also like


