

EQUITY RISK MONITOR HIGHLIGHTS
WEEK ENDED MARCH 13, 2026
Crisis Dispersed
While the headlines are full of dire warnings of impending geopolitical and macroeconomic doom, equity markets around the world reflect this back with varying degrees of concurrence. While market-traded indicators such as the VIX index have shot up based on markets for forward volatility protection, neither realized volatility nor the risk forecasts from risk models appear to reflect the panic in the media:
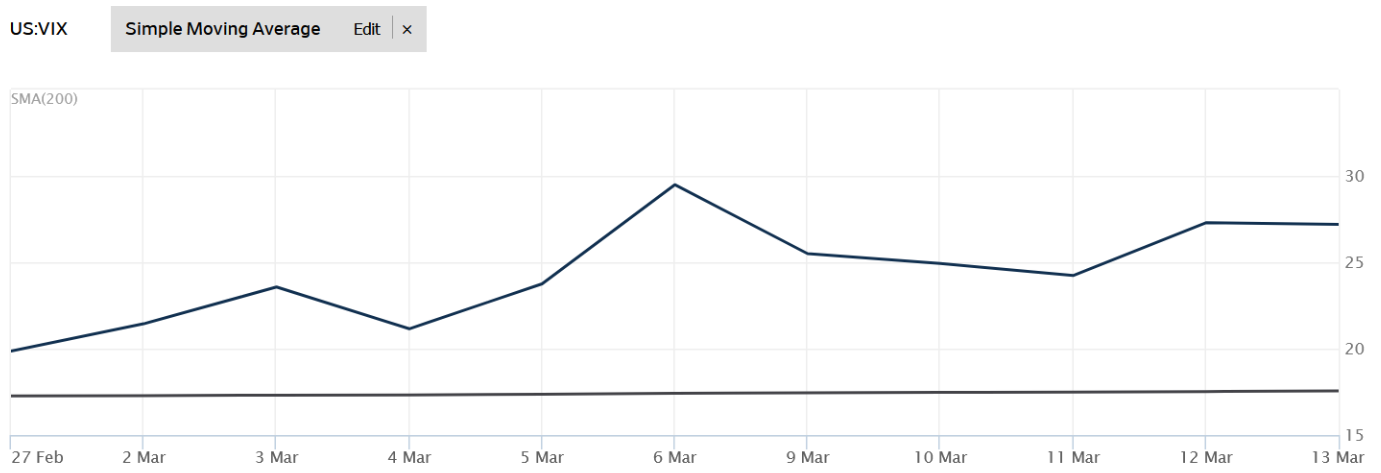
Source: Wall Street Journal
Russell 1000 Index (^RUI) Realized 20-day Volatility (annualized)
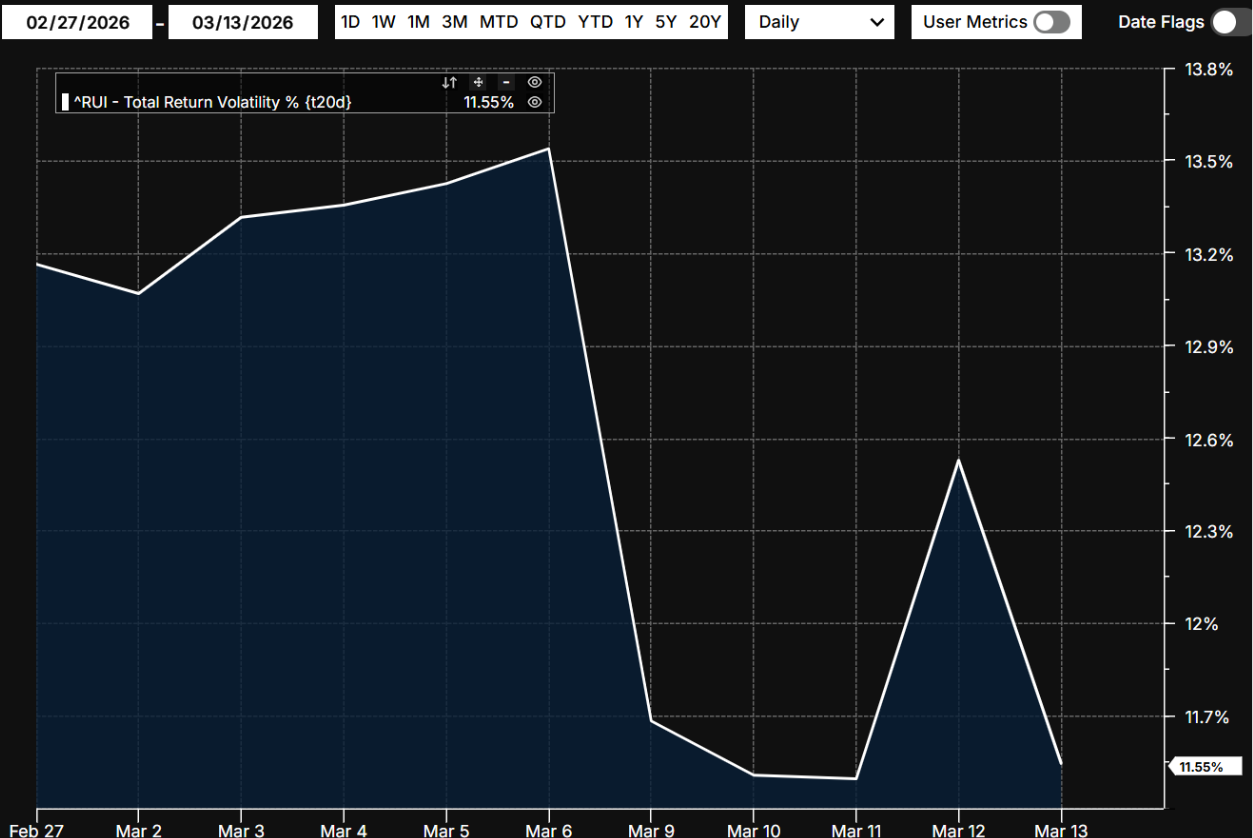
Source: FTSE Russell, Arcana
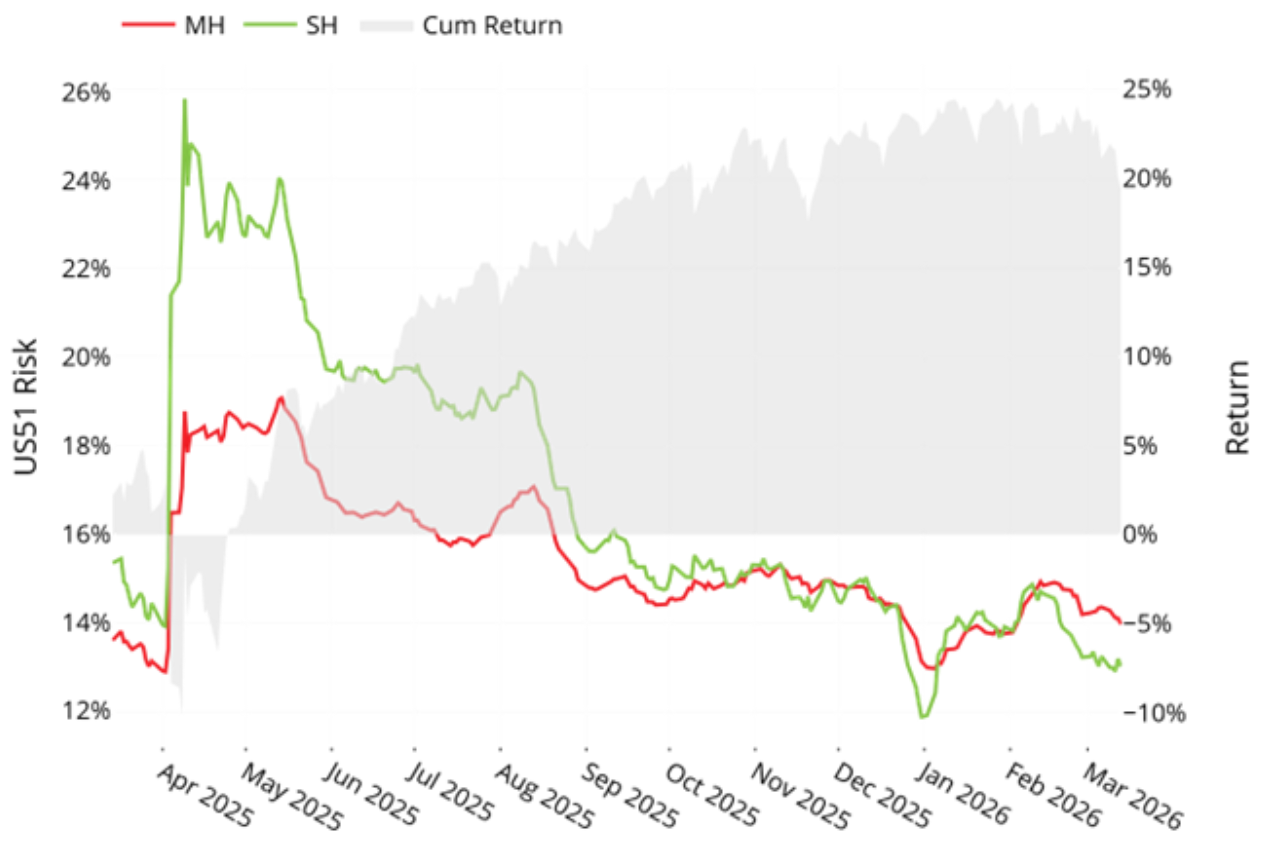
See chart from the Russell 1000 Equity Risk Monitor as of March 13, 2026
Russell 1000- Predicted Risk
If we’re honest, even the VIX spike to just under 30 on the 6th of March doesn’t quite justify the sweaty brows induced by reading or listening to much of the mainstream financial media. Nevertheless, it is worth a deeper dive into the mechanics of the risk model to understand the underlying dynamics keeping risk forecasts in the US steady (even as we see an uptick in other regions).
See chart from the Russell 1000 Equity Risk Monitor as of March 13, 2026
Axioma US Model Factor Volatility Range (1 year)
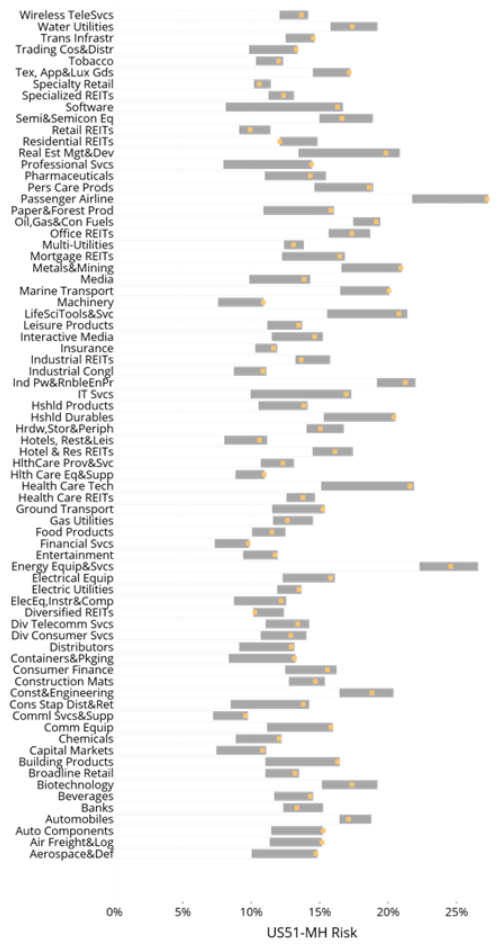
Several US Industry factors are at or near their 12-month highs for standalone forecast volatility. Many of the industries that have petrochemicals as inputs either as fuel (Passenger Airlines, Air Freight & Logistics, Transportation Infrastructure) or as an ingredient or feedstock (Chemicals, Containers & Packaging, Building Products) have had their volatility forecasts rise sharply in the last 2 weeks. Others like Software were already high before the Iran war began because of AI disruption fears, but continued to climb.
Factor (systematic) risk in the Russell 1000 index went up by 6 basis points from Feb. 27 to March 13. Yet overall risk went down by almost 21 basis points as idiosyncratic risk declined both in absolute terms and as a proportion of the total risk. Lower idiosyncratic risk is expected in periods of crisis, as rapidly changing information affects all stocks in one way or another. However, this crisis is different in that dispersion in factor returns is increasing even as factor risk increases. We can see this in several ways.
See chart from the Russell 1000 Equity Risk Monitor as of March 13, 2026
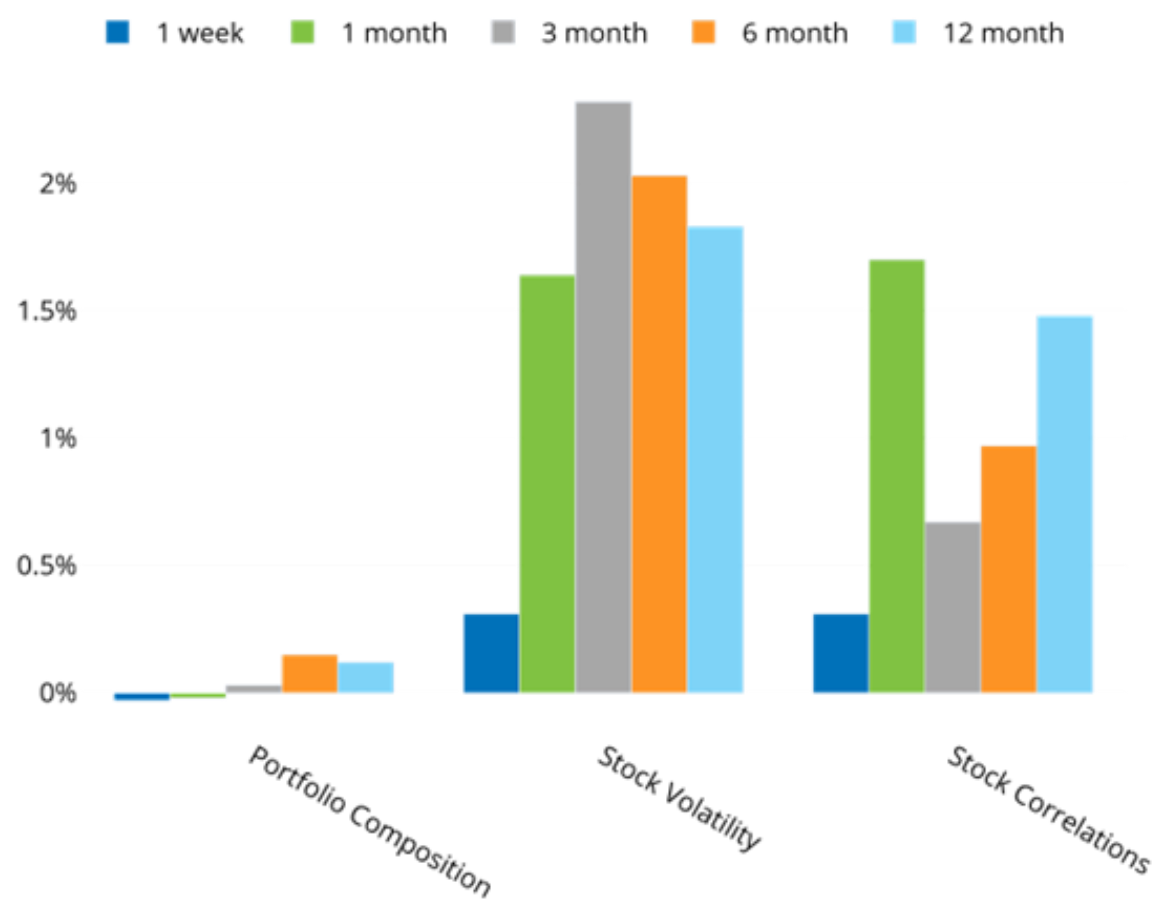
Risk Change Decomposition- Dense Matrix
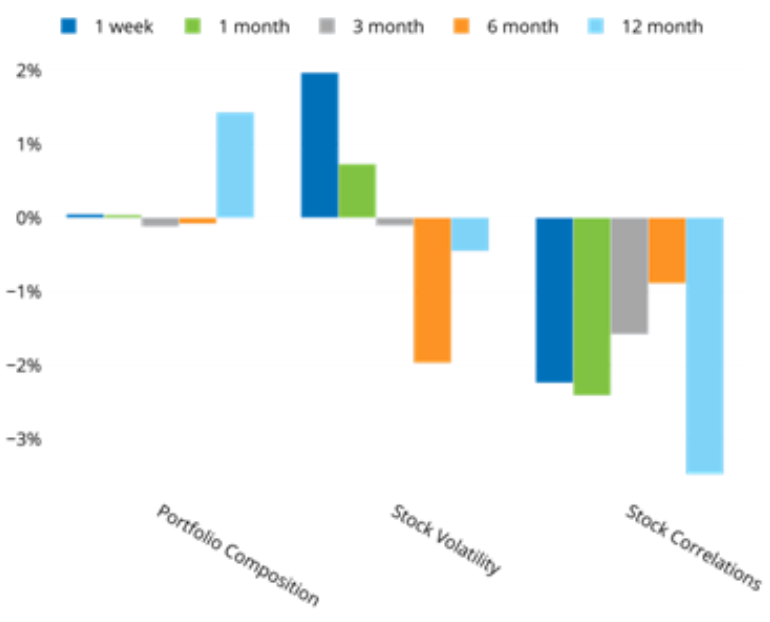
The “Dense Matrix” Risk Change decomposition rotates the factor covariance matrix into asset/asset space for the assets in the Russell 1000. Looking at this level of granularity, we see that even as asset volatilities have increased significantly over the last week and month, asset correlations have decreased even more. Dispersion is increasing and offsetting the increase in volatility. We also see this in the “Diversification Ratio” where we compare the total risk forecast for the index with the weighted average asset volatility:
See chart from the Russell 1000 Equity Risk Monitor as of March 13, 2026
Russell 1000 Diversification Ratio
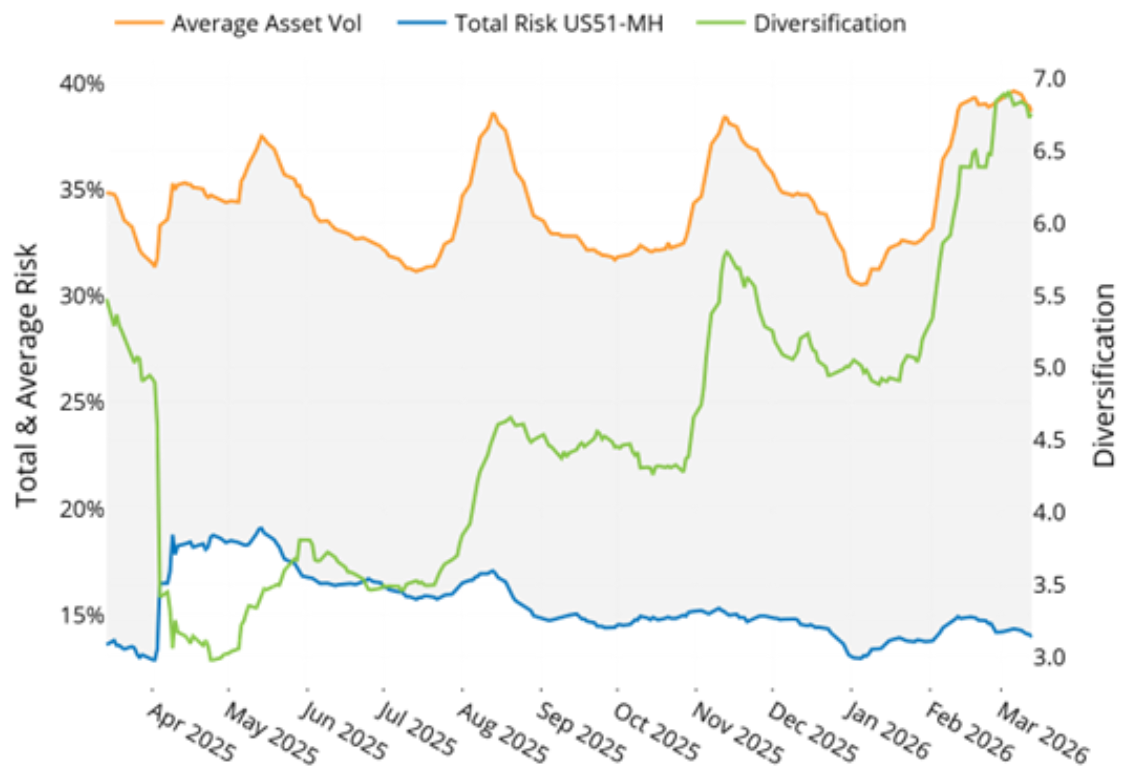
As individual volatilities have climbed, the index risk forecast has remained quite steady. This is also reflected in the factors themselves using X-sigma-rho risk decomposition comparing point-in-time risk forecasts at 27 Feb and 13 March:
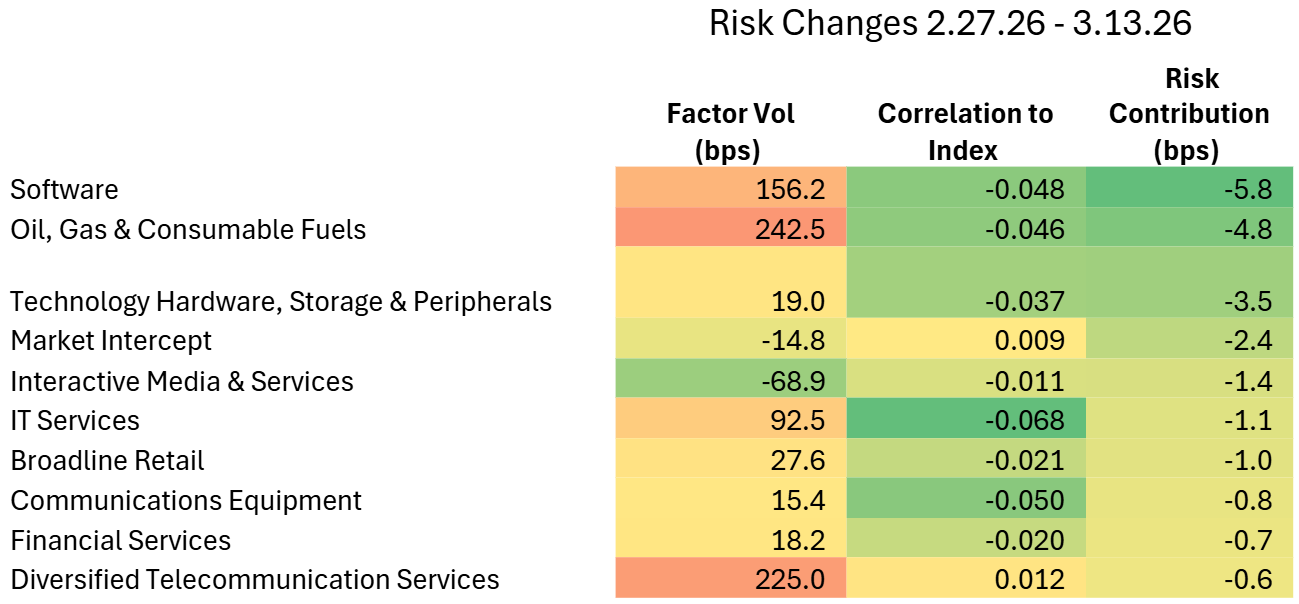
The following table does not appear in the risk monitors but is available on request
Largest Decreases in Index Risk Contribution:
Largest Increases In Index Risk Contribution:
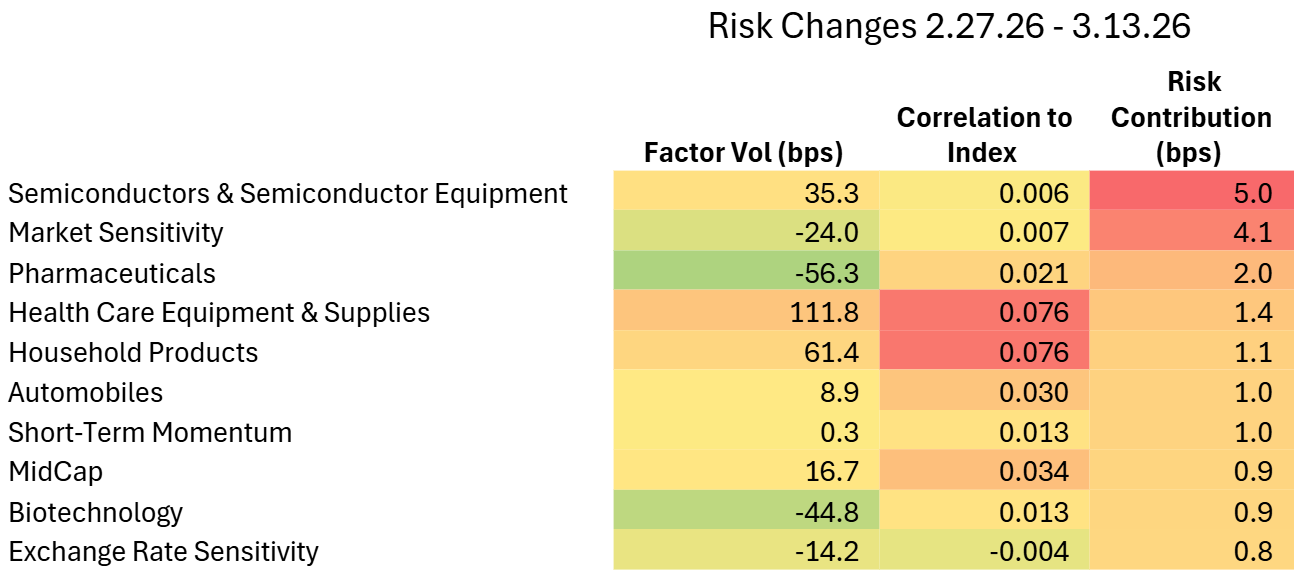
Again, the overall change in factor risk was +6 bps, and it wasn’t higher because several factors had meaningful changes in correlation with one another (and with the market overall) and thus muted the impact of higher overall factor volatilities.
We saw this to some degree in other markets as well, but none as stark as the United States, especially not over the trailing month- and so risk forecasts in Japan, Europe, and Asia Ex-Japan rose significantly more than in the US since the start of the Iran war:
Europe:
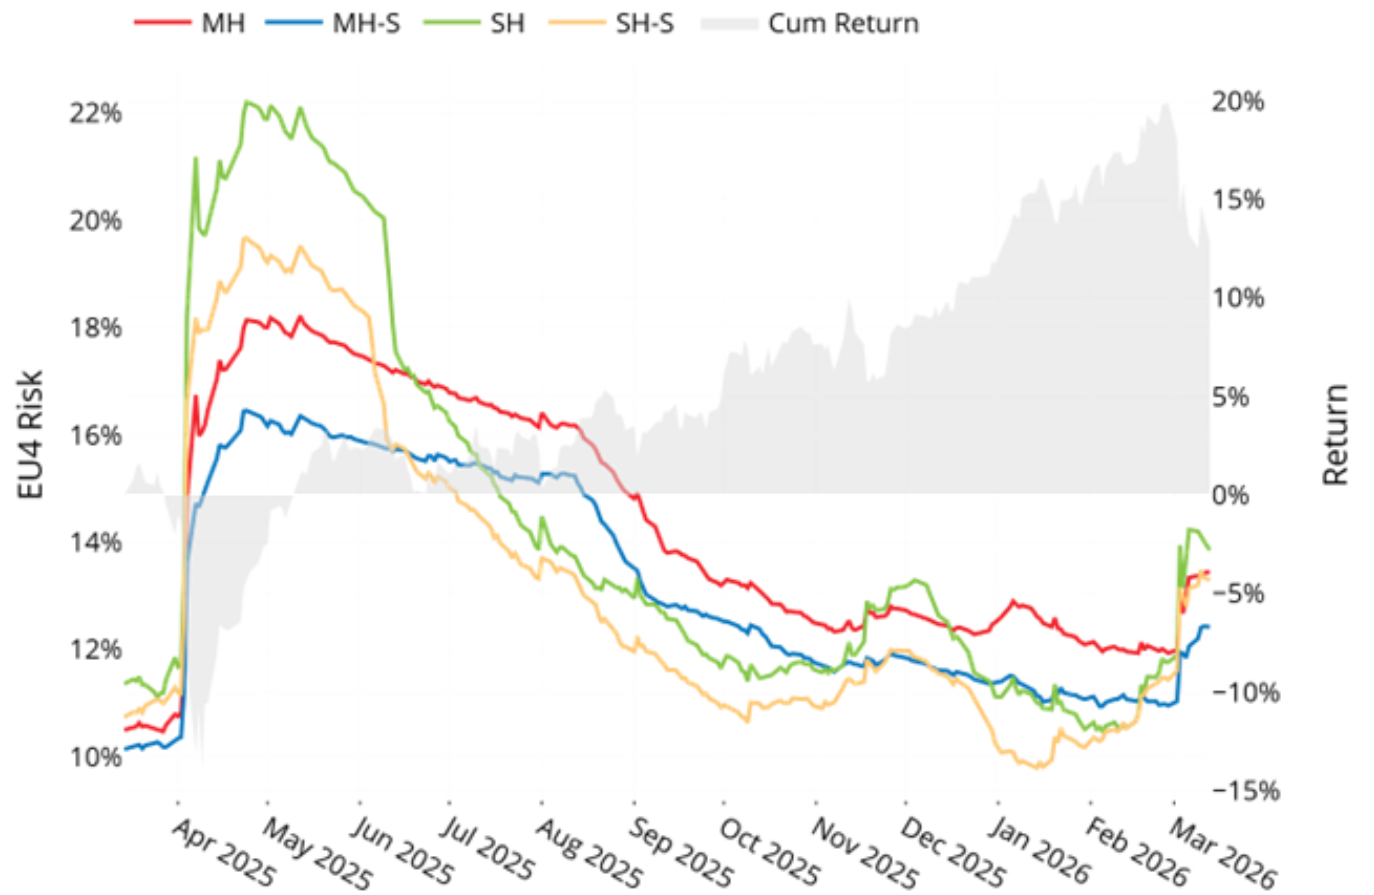
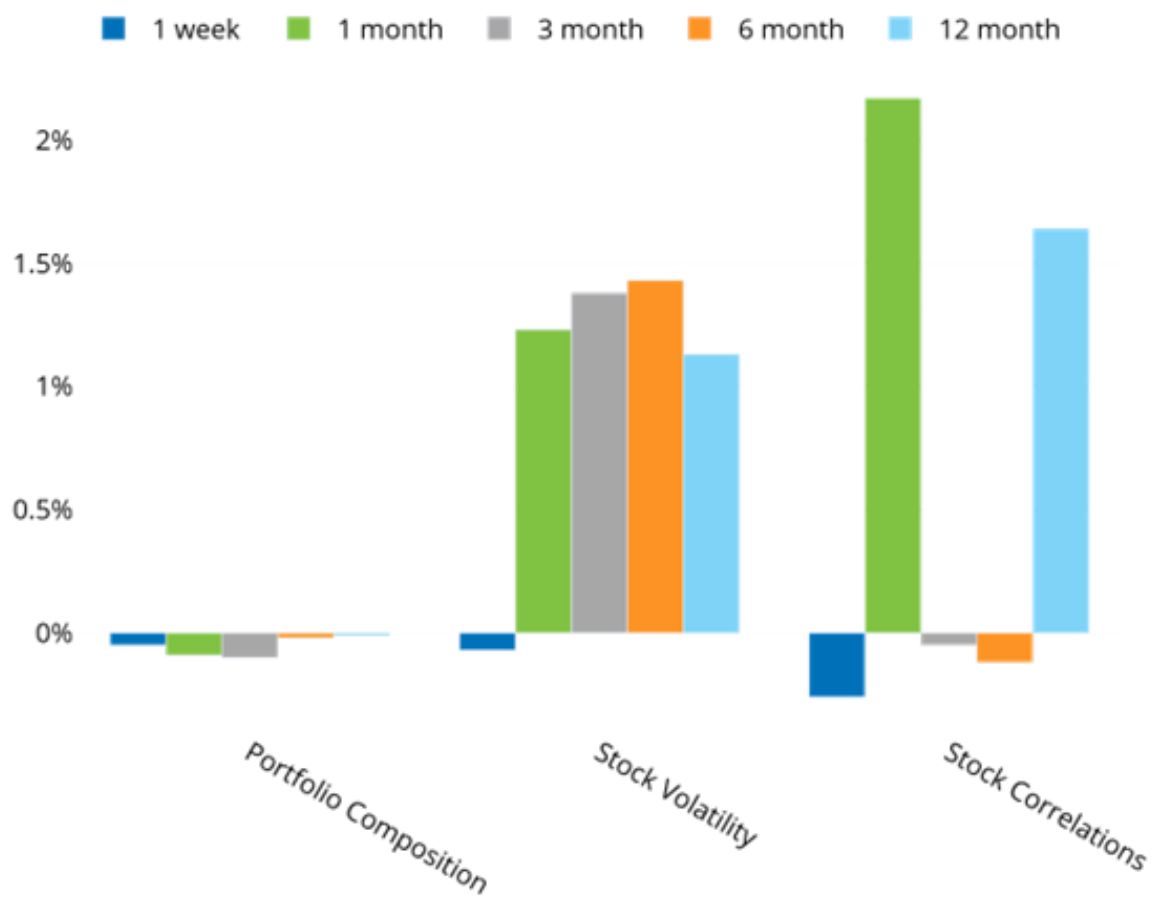
See charts from the STOXX Europe 600 Equity Risk Monitor as of March 13, 2026
STOXX Europe 600- Predicted Risk
Risk Change Decomposition- Dense Matrix
Japan:
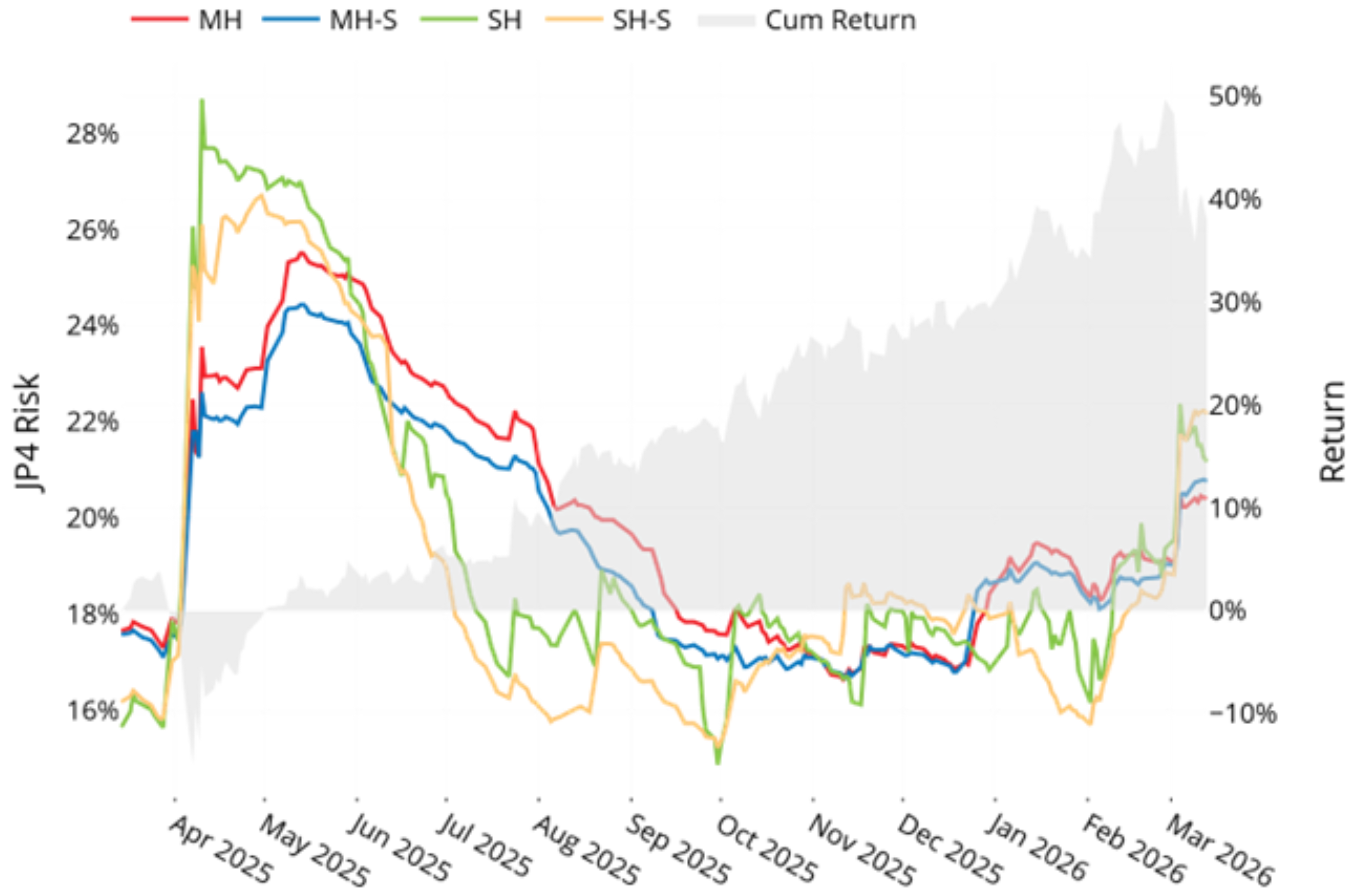
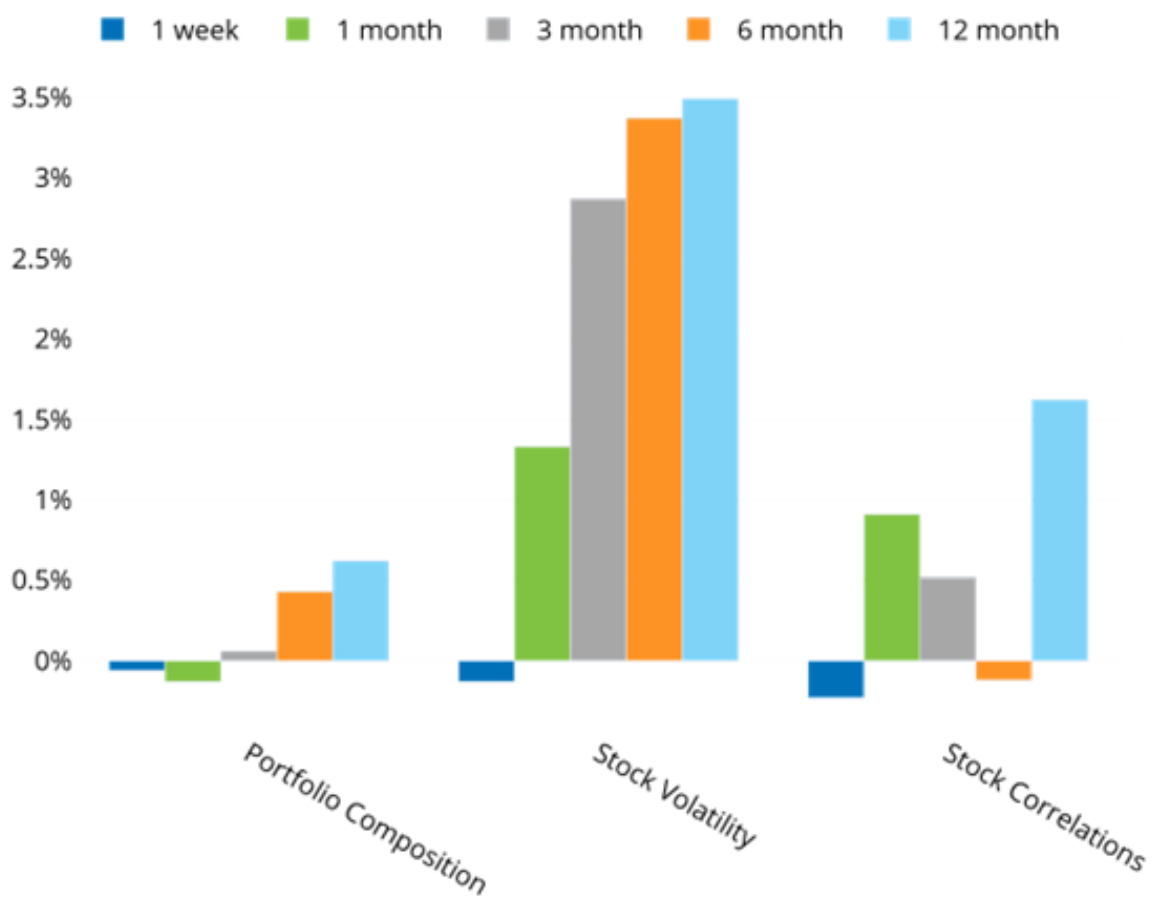
See charts from the STOXX Japan Equity Risk Monitor as of March 13, 2026
STOXX Japan- Predicted Risk
Risk Change Decomposition- Dense Matrix
Asia Ex-Japan:
See charts from the STOXX Asia ex-Japan 600 Equity Risk Monitor as of March 13, 2026
STOXX Asia ex-Japan 600 - Predicted Risk
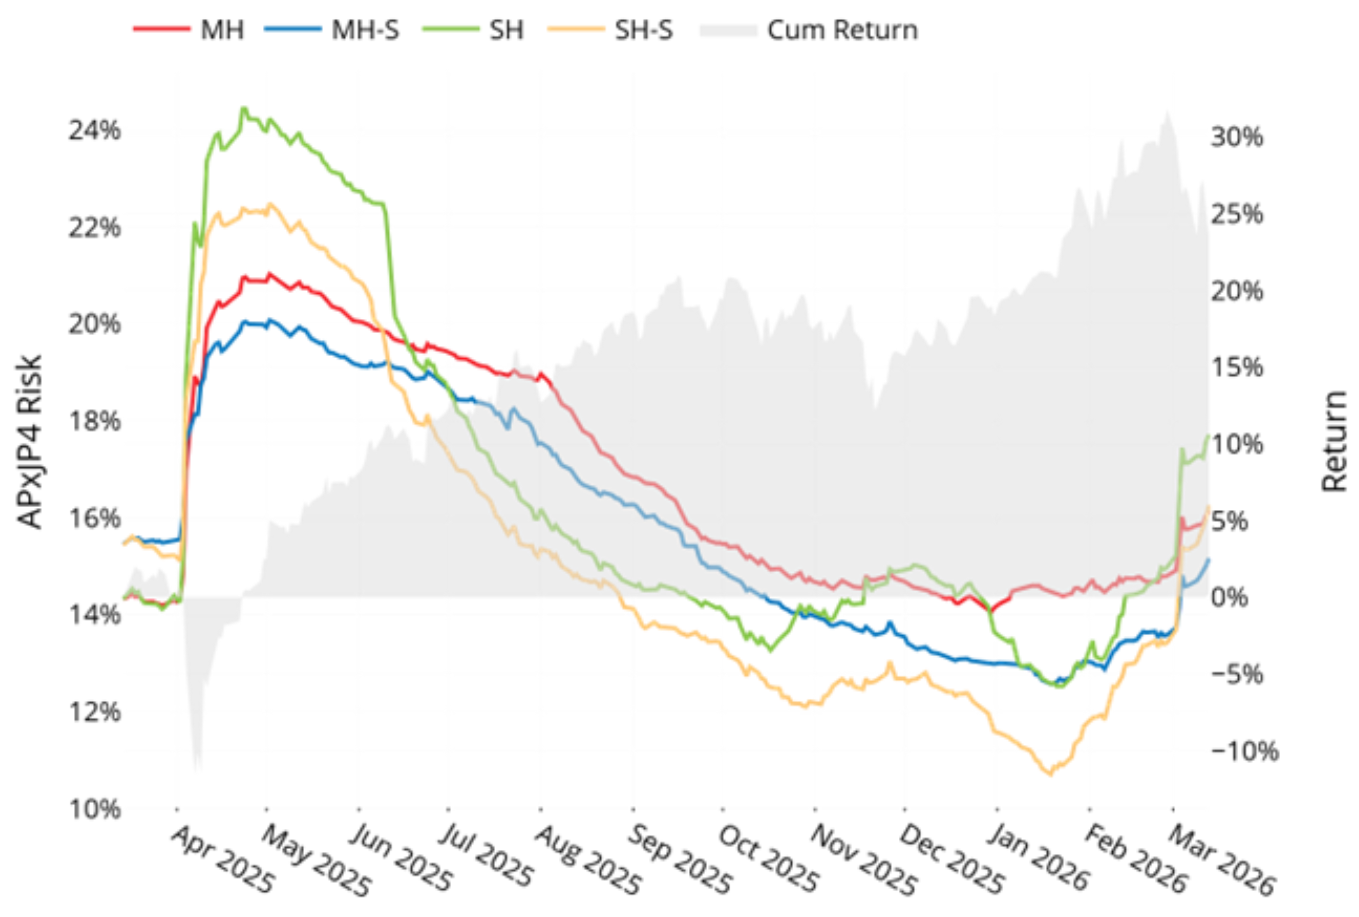
Risk Change Decomposition- Dense Matrix
In Asia Ex-Japan, we do not see correlations decreasing at all; the picture in the broader Asia market appears to be more like a classic supply-side shock where correlations are increasing along with volatility- likely because nearly all fuel and feedstock supply in the region are imported from the Persian Gulf region.
Volume and Crisis
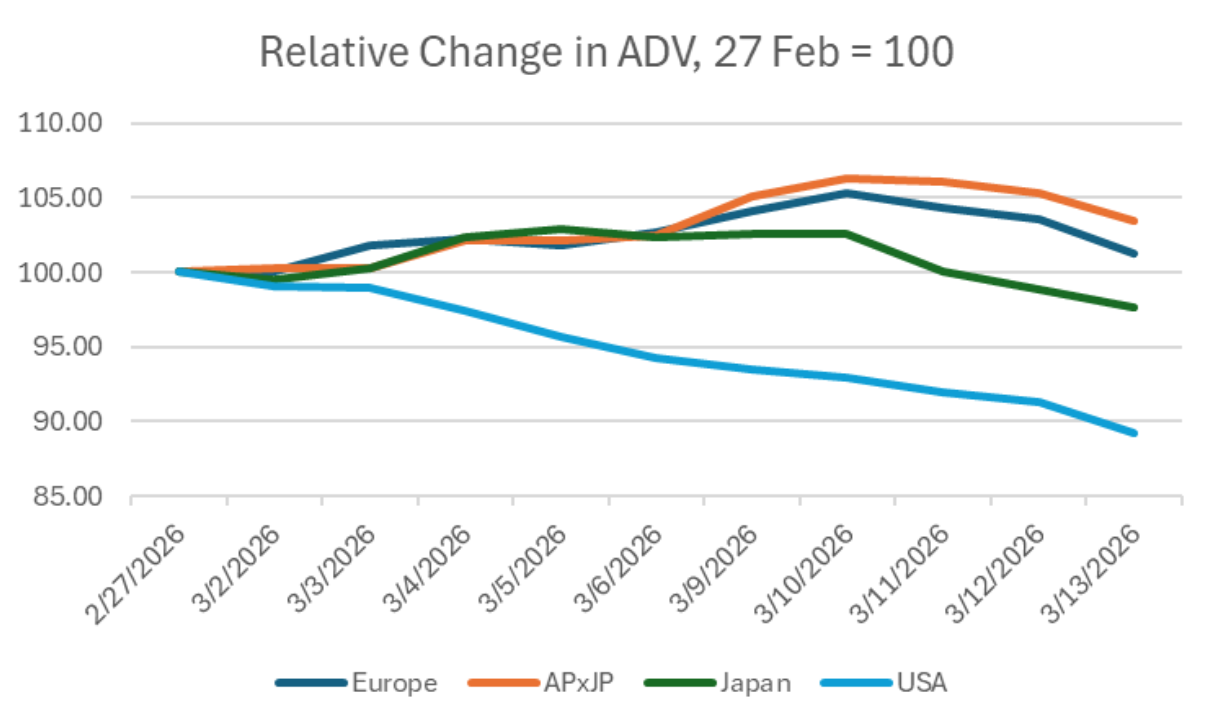
Typically when markets are in crisis, we see increases in volume as investors rebalance and liquidate positions that have become too risky. While we saw modest increases in volume in Europe and Asia ex-Japan, we have seen decreases in the two most liquid world equity markets, the US and Japan. This might mean that the liquidity available (and the more diversified economies of the two countries) give investors a greater ability to “wait and see” how the current crisis resolves:
The following chart does not appear in the equity risk monitors but is available on request
You may also like


