
EQUITY RISK MONITOR HIGHLIGHTS
WEEK ENDED MAY 01, 2026
- Market returns, breadth, trading volume and Technology dominance
- Macroeconomic and US style factor returns in April vs. March
Market returns, breadth, trading volume and Technology dominance
Despite declining consumer confidence, a disappointing first quarter GDP print and, of course, the continuation of hostilities in the Middle East and elsewhere, stocks posted gains last week in most major markets. Markets were buoyed by strong and better-than-expected earnings reports as well as renewed enthusiasm for the AI trade.
April was not just your run-of-the-mill good month for stocks. With a return of 10.4% core US equities turned in their best month (and first double-digit return) since November 2020, and their ninth-highest monthly return since 1982. Core Developed Markets ex-US equities lagged the US by just one percentage point, producing the highest return for that region since November 2023 and the 22nd-highest since January 1997. Emerging Markets equities were strong as well, gaining 10.2%, which also ranked 22nd of the almost 30 years since 1997 and the best since November of 2022.
Markets’ climb upward was also quite steady in April. The STOXX Developed World index rose in 15 of the month’s 22 days, a far higher hit ratio (68%) than usual (closer to 55%). STOXX Emerging Markets was up in 14 of the 22 days. Only STOXX Europe 600 and STOXX Australia saw positive returns in less than half of the days in April.
While the US has now pulled ahead of Europe year to date, both still lag most markets with the exception of Australia and China.
The following table does not appear in the equity risk monitors, but is available on request
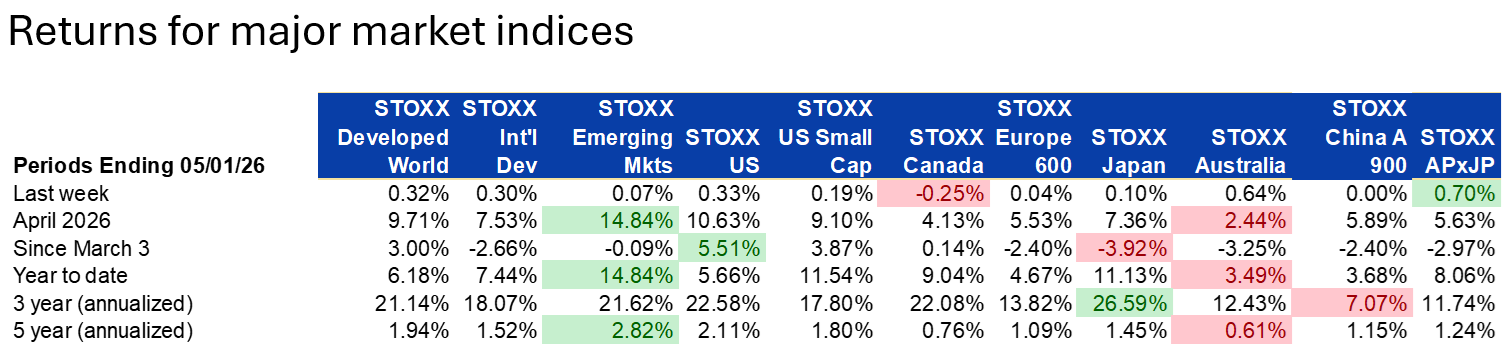
Note: Index with the highest return for the period is noted in green, and the index with the lowest is noted in pink.
While this all seems like extremely positive news, we feel the need to point out some potential issues underlying the strength.
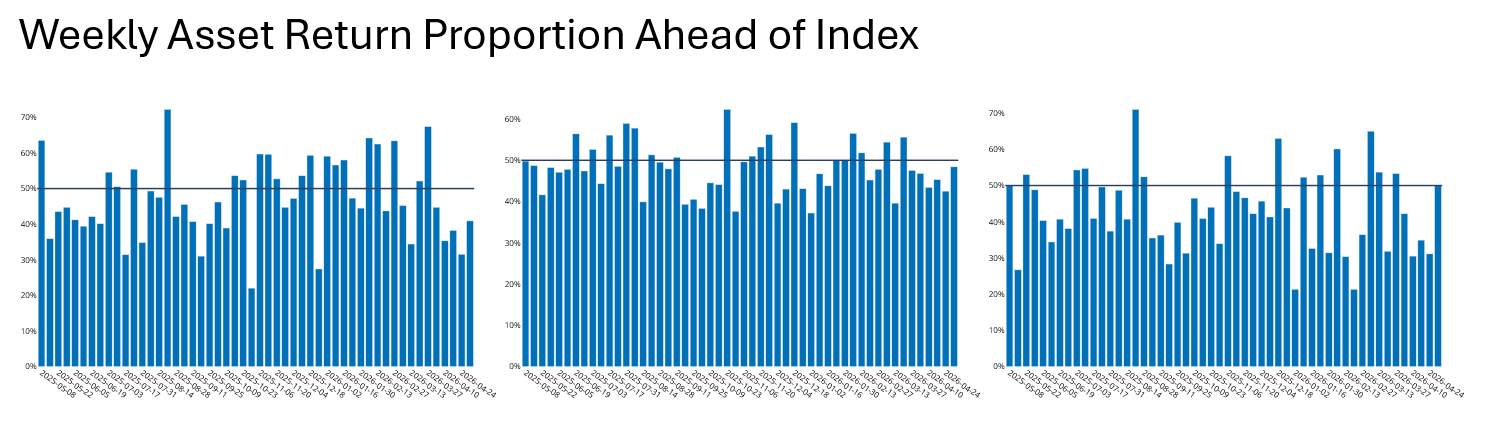
- Breadth has remained narrow, with 60%-70% of stocks failing to match the market’s return in the past five weeks in the US. Developed Markets ex-US saw better breadth, while Emerging Markets’ percent of stocks beating the market was more similar to what we see in the US, except for the last five days.
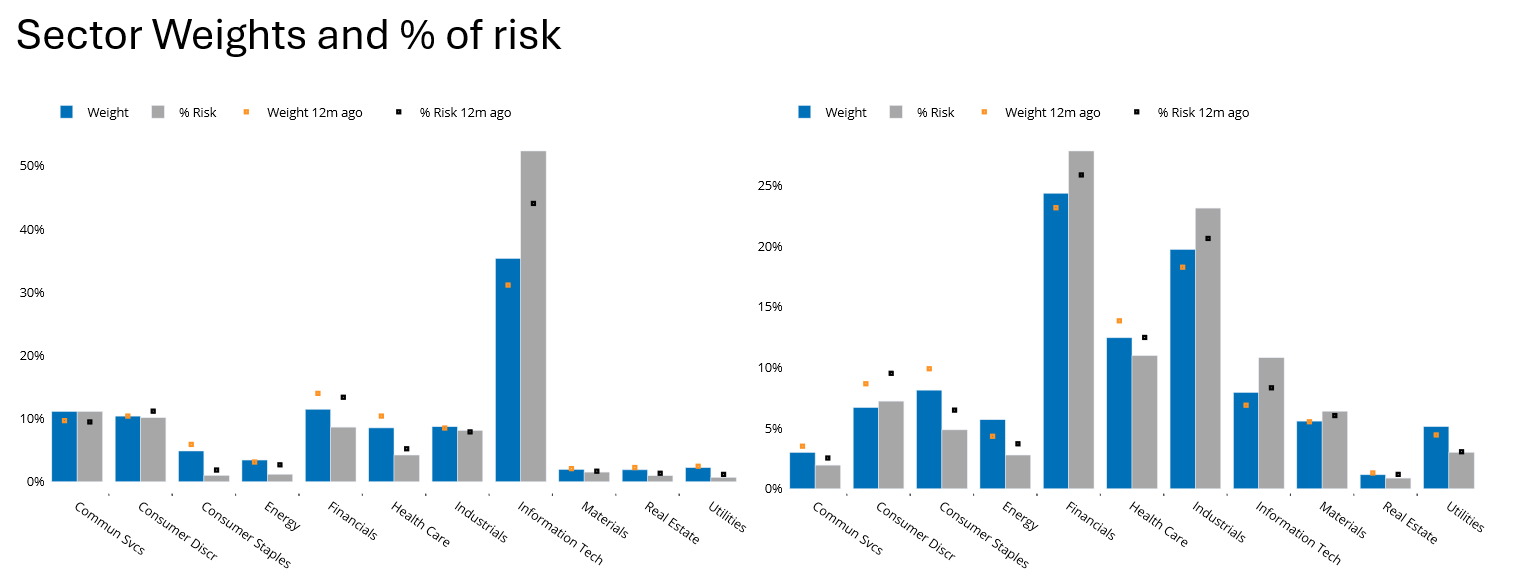
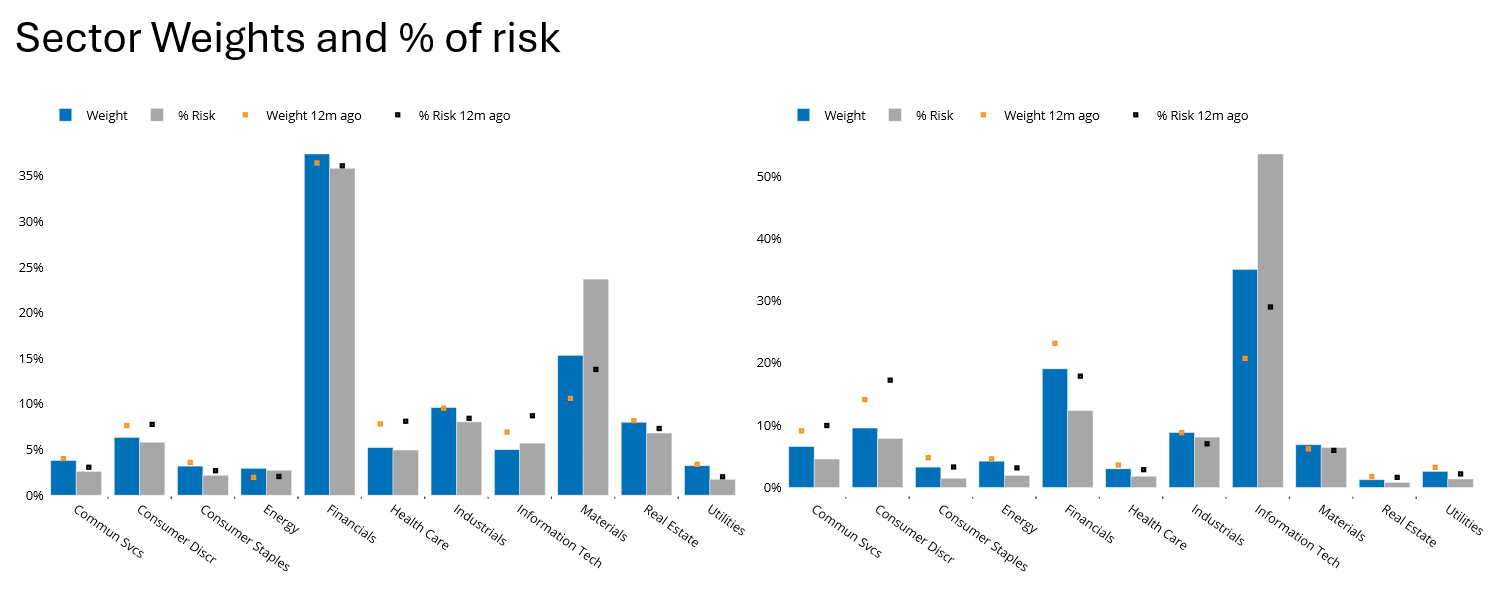
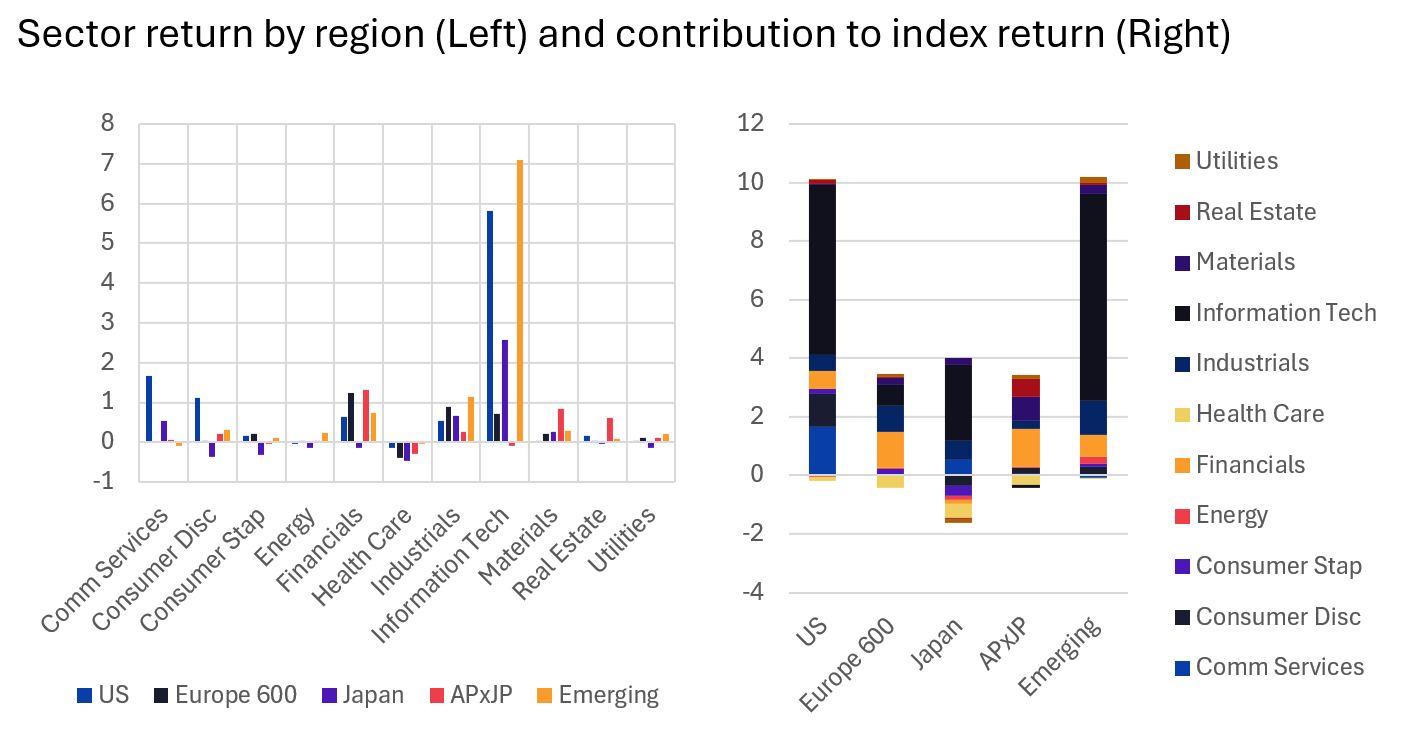
- Going hand-in-hand with the lower market breadth is the dominance of Information Technology in both magnitude of returns and contribution to index return, in the US, Japan and Emerging Markets. Europe and Asia ex-japan had both lower weight in Technology and the sector lagged in both as compared with the US, Japan ad Emerging Markets. The combination of low weight and lagging return kept those regions’ overall returns from being even higher. The bigger issue as we see it is the concentration of the other markets in Technology, a representation that will be difficult to sustain. Notably, Tech now accounts for more than 50% of the risk in the US, crowding out the ability for investors to add value in other sectors.
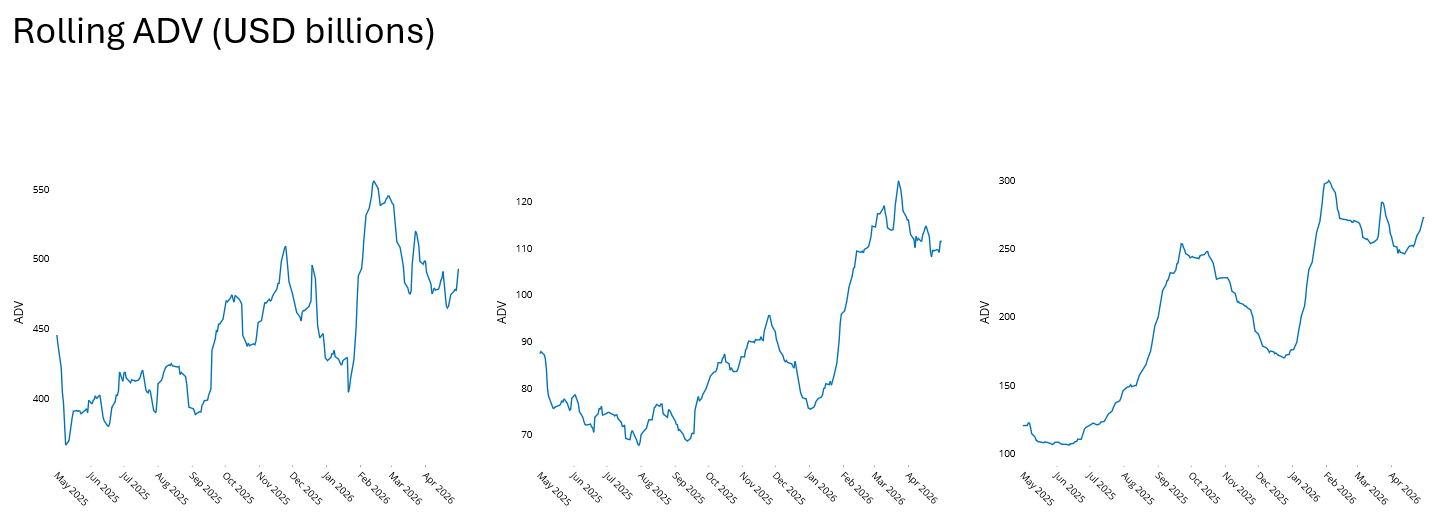
- Average daily trading volume has been muted, especially in the US, and especially given the euphoric nature of markets’ gains. This was also pointed out by my colleague Olivier d’Assier in his weekly ROOF (Market Sentiment) highlights, along with a more in-depth assessment of what has been happening in equity markets globally. You can find his most recent commentary here. We both believe that lower volumes mean less investor participation and therefore less stable support.
- Although there are many more issues to point to, we’ll end this section by revisiting a post we wrote earlier this year on LinkedIn. In the post we looked at 100 years of US equity market returns and note how unlikely it would be to see four years in a row of extremely high market returns. In fact, only three times since 1926 did the market gain 15% or more for four years in a row, and after three years in which annualized returns exceeded 20% per year, the next year is much more likely to produce a lower-than-average return. You can find the post here.
Please see the following charts from the STOXX US (Left), STOXX International Developed Markets (Middle) and STOXX Emerging Markets[MB1.1] (Right) Equity Risk Monitors as of May 1, 2026
Please see the following charts from the STOXX US (Left) and STOXX Europe 600 (Right) Equity Risk Monitors as of May 1, 2026
Please see the following charts from the STOXX Asia ex Japan 600 (Left) and STOXX Emerging Markets (Right) Equity Risk Monitors as of May 1, 2026
The following charts do not appear in the equity risk monitors, but are available on request Sector return by region (Left) and contribution to index return (Right)
Macroeconomic and US style factor returns in April vs. March
The macroeconomic uncertainty in March of this year driven by higher oil prices leading to higher inflation globally resulted in large returns for a number of the factors in the Axioma Macroeconomic Projection Model. March’s “normalized” (or risk-adjsted) returns (monthly return – long-term average monthly return, divided by the standard deviation of monthly returns) were high not only for Oil, but for inflation factors and credit spreads as well. In addition, Gold’s return was more than two standard deviations below its long-term average. Many factors seemed to “calm down” in April, however, with returns for all the factors within one standard deviation of the average except for Japanese term spreads, which continued to widen, and US, GB and EU credit spreads, which reversed course from March and narrowed substantially. The factors within one standard deviation of the average except for Japanese term spreads, which continued to widen, and US, GB and EU credit spreads, which reversed course from March and narrowed substantially. For more information about the Axioma Macroeconomic Projection model speak with your SimCorp representative. And here is a blog post that provides a bit more color.
The following chart does not appear in the equity risk monitors, but is available on request.
Axioma Macroeconomic Projection Model Risk Adjusted Returns, March and April 2025
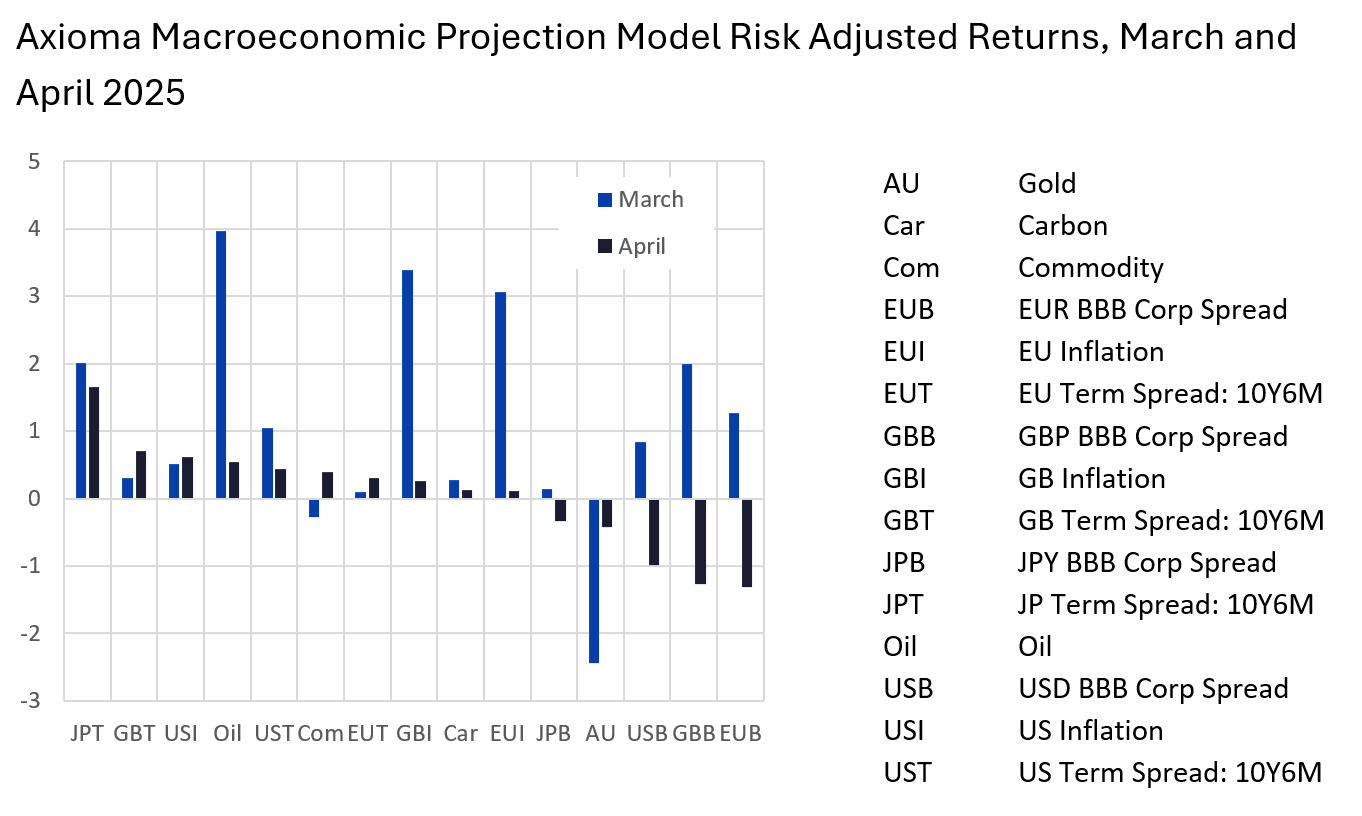
Note: Risk-adjusted return, also known as normalized return, is equal to the actual monthly return minus the long-term average, all divided by the long-term standard deviation of monthly returns
In contrast to the Macro factors, which by-and-large settled down in April versus March, the picture was more mixed for style factor returns in Axioma’s US5.1 equity model. The magnitude of the normalized returns (as described above) did not see the heights reached by the macro factors in March, and in many cases the magnitude was larger in April than in March, most notably for Downside Risk, Market Sensitivity, Medium-Term Momentum, Residual Volatility and Value.
We also observed that a number of factors’ returns changed direction (just like the market), especially Earnings Yield, Investment, Leverage, Market Sensitivity and Profit Quality. Overall, however, factor returns were largely in the expected direction in April. We would be worried about something “bubbling under the surface” if factors started to “misbehave” and produce large-magnitude returns in the opposite direction of expectations. That can be a harbinger of a sustained change in market direction, so this is one concern we can down-weight, at least for now.
The following chart does not appear in the equity risk monitors, but is available on request.
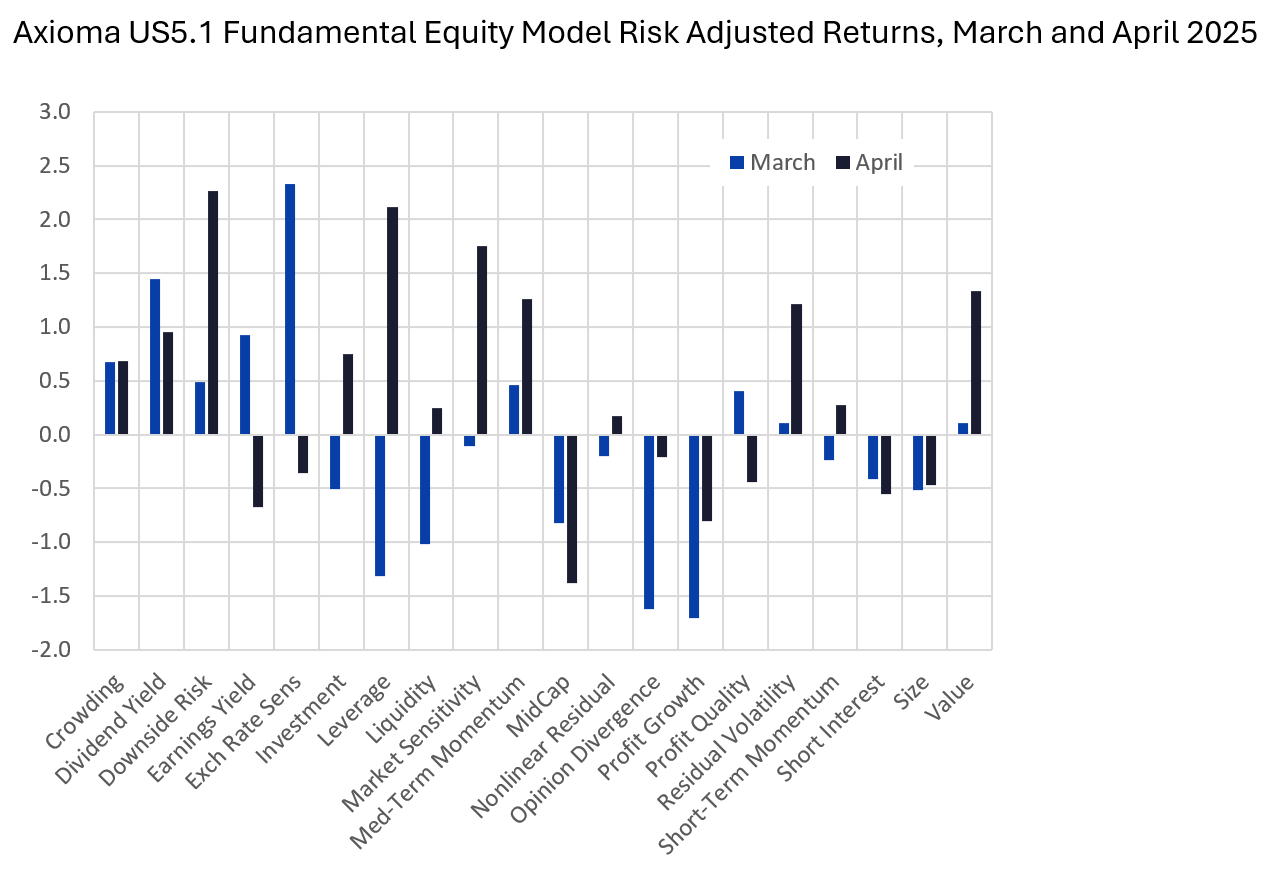
Note: Risk-adjusted return, also known as normalized return, is equal to the actual monthly return minus the long-term average, all divided by the long-term standard deviation of monthly returns
You may also like
.png%3Fh%3D810%26iar%3D0%26w%3D1080&w=3840&q=75)
.png%3Fh%3D810%26iar%3D0%26w%3D1080&w=3840&q=75)
