
EQUITY RISK MONITOR HIGHLIGHTS
WEEK ENDED MAY 08, 2026
Axioma Risk Monitor: Participation in the US market rally remains narrow; Mega Caps lead, but style factors tell a deeper story; Pockets of misbehavior among style factors
Participation in the US market rally remains narrow
US equities advanced to fresh highs last week, supported by stronger-than-expected earnings releases and labor market data. At the same time, investors appeared to largely dismiss the drop in US consumer sentiment reported by the University of Michigan survey.
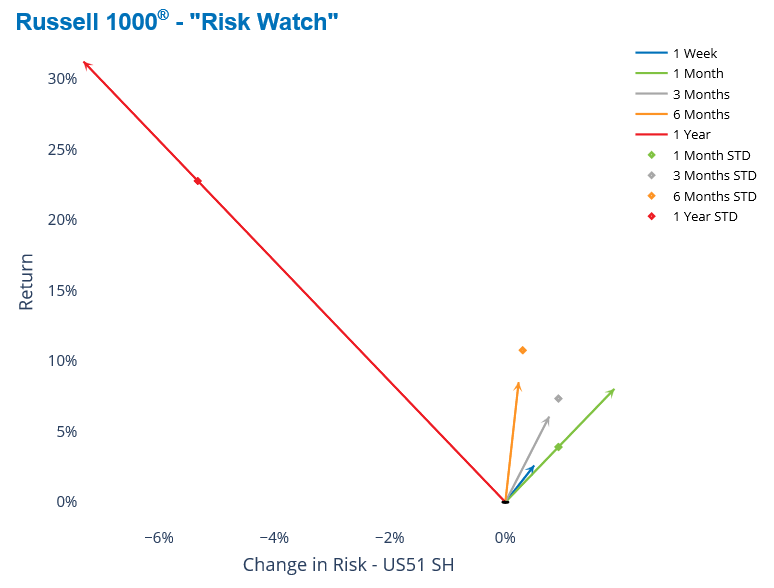
The Russell 1000 Index gained roughly 2% over the week, extending its streak to a sixth consecutive weekly advance. While the weekly move remained within one standard deviation of expectations at the start of the period, the monthly gain is now two standard deviations above expectations, as measured by the Axioma US fundamental short-horizon model.
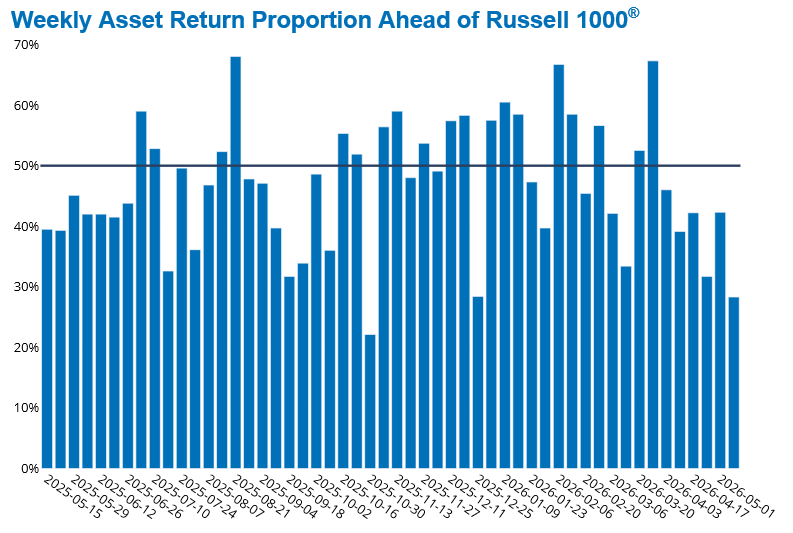
That said, participation in the rally remained narrow. A relatively small subset of stocks drove the advance, primarily the largest names, which continue to exert a disproportionate influence on index-level performance. In fact, last week recorded the lowest breadth of the past six weeks, with only about 25% of stocks outperforming. Over 80% of the Russell 1000’s cumulative six-week return can be attributed to mega-cap companies.
See charts from the Russell 1000 Equity Risk Monitor as of May 8, 2026:
The chart below is not included in the Equity Risk Monitors but is available upon request:
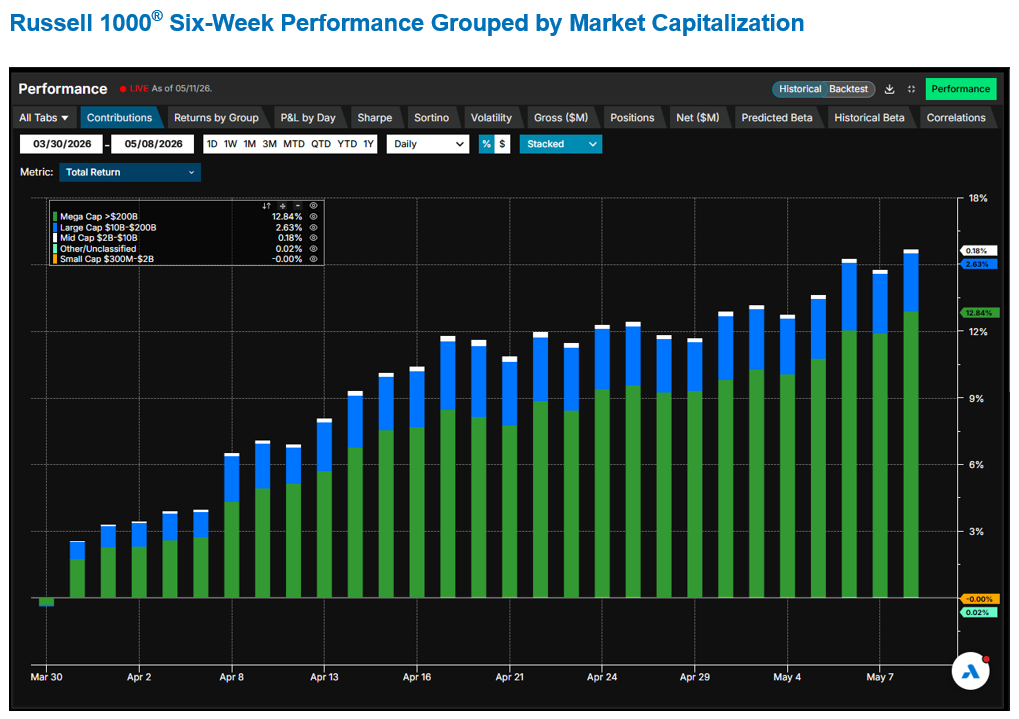
Source: Arcana
Mega Caps lead, but style factors tell a deeper story
While headline performance points to mega-cap dominance, style factor behavior reveals a more nuanced underlying pattern. Market Sensitivity posted the largest positive return over the past six weeks, reinforcing the concentration in larger, high-beta names. However, other factors suggest that investors are also rotating into smaller-size, higher-value stocks with strong momentum and elevated volatility.
This shift is evident in the strong performance of Downside Risk, Residual Volatility, and Medium-Term Momentum, alongside a surprisingly pronounced negative return to Size. The explanation for the latter is that the Size factor distribution is heavily skewed toward the largest mega-cap stocks, such that even smaller mega caps exhibit negative Size exposure, with all stocks in the Large-Cap group ($10B-$200B) carrying negative loadings on the Size factor.
From a valuation perspective, Profit Growth delivered slightly negative returns, while Value generated notably positive performance, indicating a tilt away from growth-oriented exposures.
The chart below is not included in the Equity Risk Monitors but is available upon request:
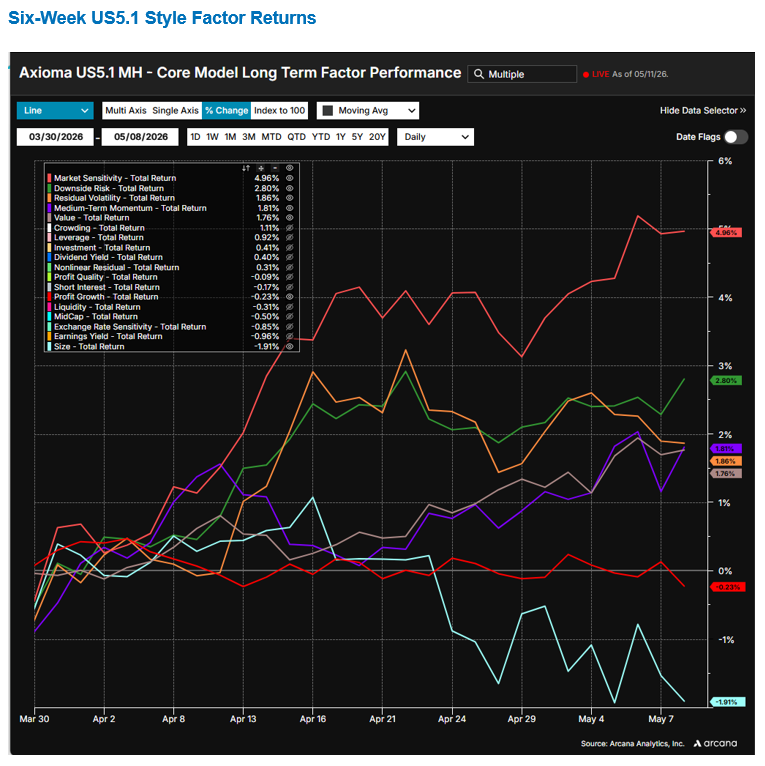
Source: Arcana
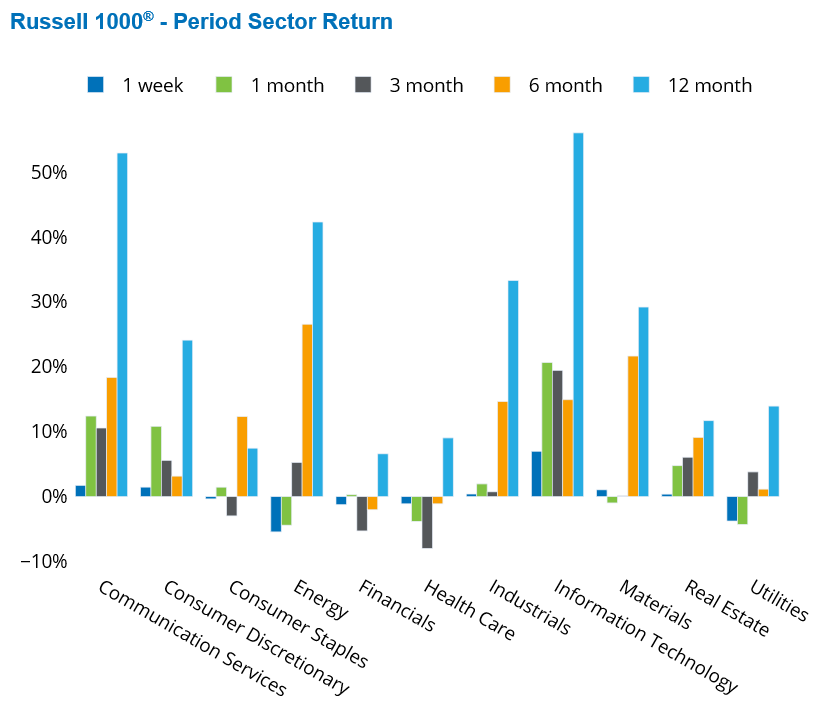
Market Sensitivity’s oversized return is also reflected in the winners and losers in the sector space Information Technology and Communication Services, the two sectors with the highest positive exposure to Market Sensitivity, recorded the strongest gains over the past month. In contrast, Energy and Utilities, which exhibit the most negative exposure to Market Sensitivity, experienced the largest declines.
See charts from the Russell 1000 Equity Risk Monitor as of May 8, 2026:
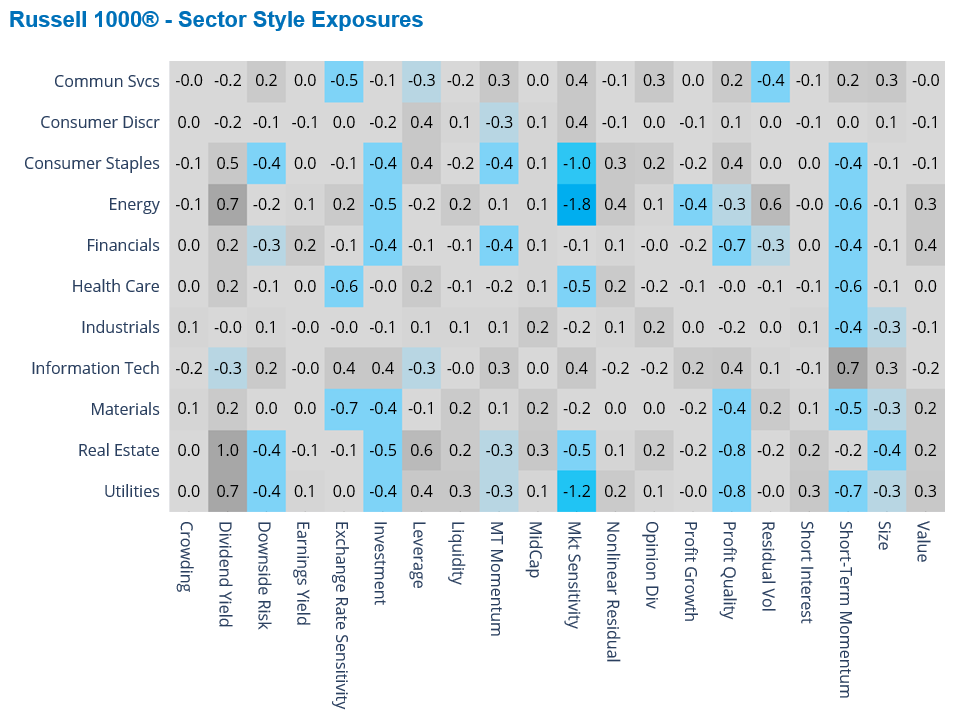
Pockets of misbehavior among style factors
Several style factors continued to behave in ways that diverge from their typical long-term patterns. Most notably, Downside Risk saw a strong positive return over the past six weeks despite historically being associated with a negative risk premium. Conversely, Liquidity and Profit Quality—factors that generally see positive long-term returns—have delivered negative performance. Profit Growth and Exchange Rate Sensitivity (ERS), which are typically weakly rewarded, have also posted unexpectedly strong negative returns.
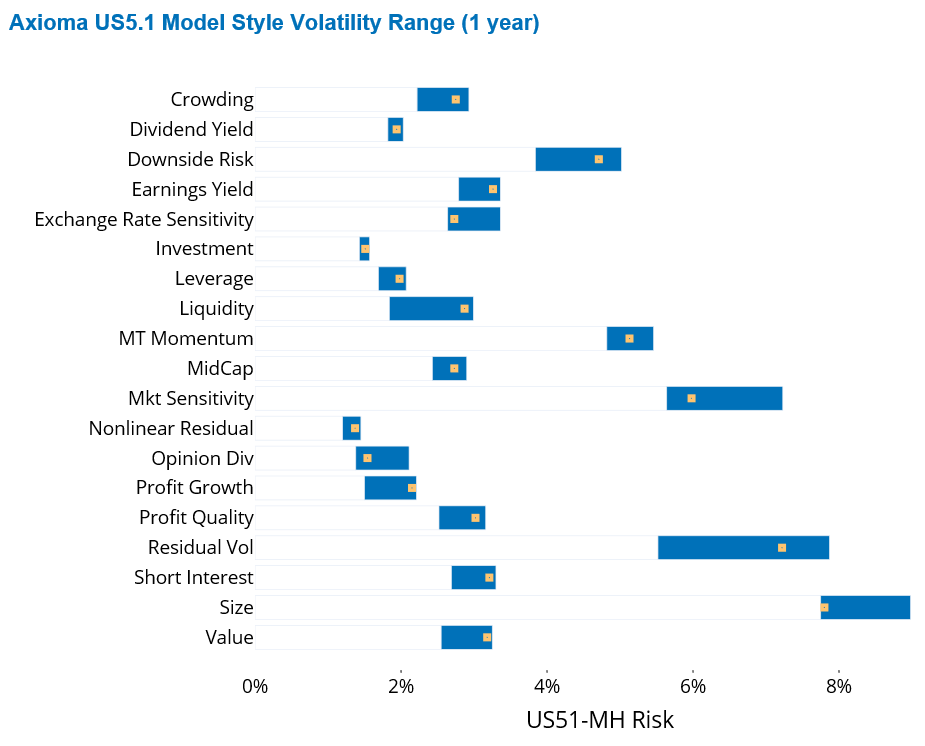
Risk dynamics across these factors further underscore the shifting landscape. Size, Downside Risk and Market Sensitivity are the riskiest factors. Size and Market Sensitivity have reached similar volatility levels in the recent past and are currently positioned near the lower end of their respective one-year volatility ranges. In contrast, Downside Risk is approaching the upper end of its one-year volatility band.
Profit Quality, Liquidity, and Profit Growth sit around the middle of the risk spectrum within the US5.1 fundamental medium-horizon model, yet all three are currently near the high end of their respective one-year volatility ranges. ERS is the exception, remaining closer to the lower end of its range.
Taken together, these developments point to significant risk across style factors. As a result, careful monitoring of factor exposures is increasingly important.
See chart from the Russell 1000 Equity Risk Monitor as of May 8, 2026:
You may also like
.png%3Fh%3D810%26iar%3D0%26w%3D1080&w=3840&q=75)
.png%3Fh%3D810%26iar%3D0%26w%3D1080&w=3840&q=75)
