

EQUITY RISK MONITOR HIGHLIGHTS
WEEK ENDED MAY 29, 2026
Note: In this week’s highlights we focus mainly on Axioma’s Medium-Term Momentum style factor, as its performance was notably good during the early stages of the current market rally, but has stalled out recently even as markets have continued to climb.
Momentum has had a banner year, and performance has not gone unnoticed in the financial press. There have been a number of articles recently on the strength of the Momentum trade that was accompanying new market highs. See, for example “Momentum Trade at New Extremes Is Drawing Wall Street Warnings,” Analysts attributed the strong factor performance to a continuation of the AI trade in the familiar names and a better-than-expected first-quarter earnings season, among other triggers.
Indeed, quarter-to-date performance of the Momentum factor across models (corresponding to the current market rally) was stellar – until it peaked on May 13 in most major regions; the factor’s continued strength in Asia ex-Japan and Emerging Markets were the clear exceptions.
The following charts are not in the Equity Risk Monitors, but are available on request:
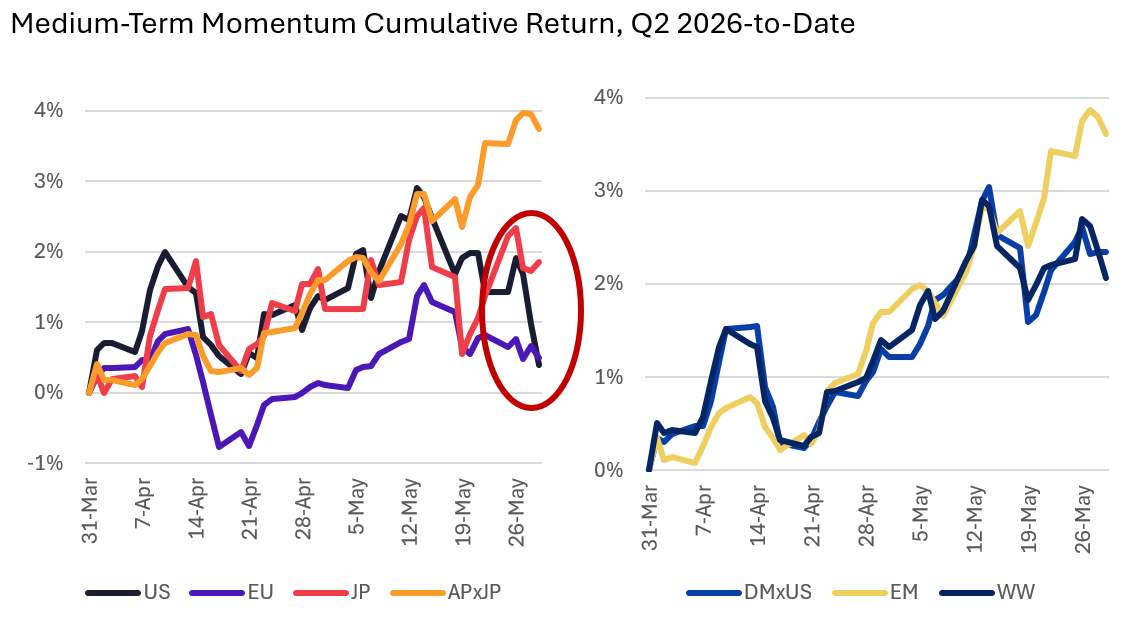
Note: Returns are based on Axioma’s medium-horizon models
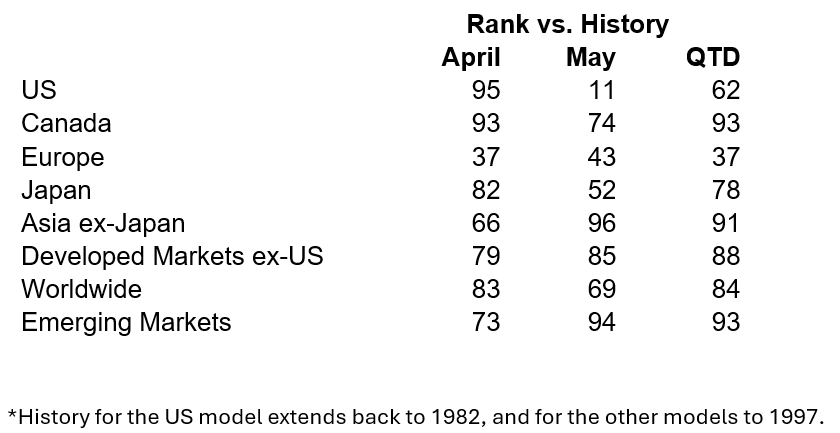
April’s Momentum factor return was decidely strong in most countries and regions: in the top decile relative to history in the US and Canada, in the top quintile in Japan and the Worldwide model, and only below average in Europe. Momentum’s return accelerated in May in Asia ex-Japan and Emerging Markets, but fell sharply in Japan and especially the US, where the return for the month fell just outside of the bottom decile relative to history.
We dug a little deeper into Momentum’s performance the US, where it has tanked the most this month. While the factor’s return in the US was positive in 17 of the 30 days from April 1 through May 13 (56.7%, roughly equal to the long-term average of positive return days), the return fell into the top quintile 47% of days (vs. an expectation of 20%), so the headline optimism was clearly warranted. From May 14th on, however, the return was in the bottom decile in seven of the 11 days (and in the bottom 2% in four of them), clearly far more frequently than expected and a sharp fall from grace that likely led to some whiplash for Momentum investors.
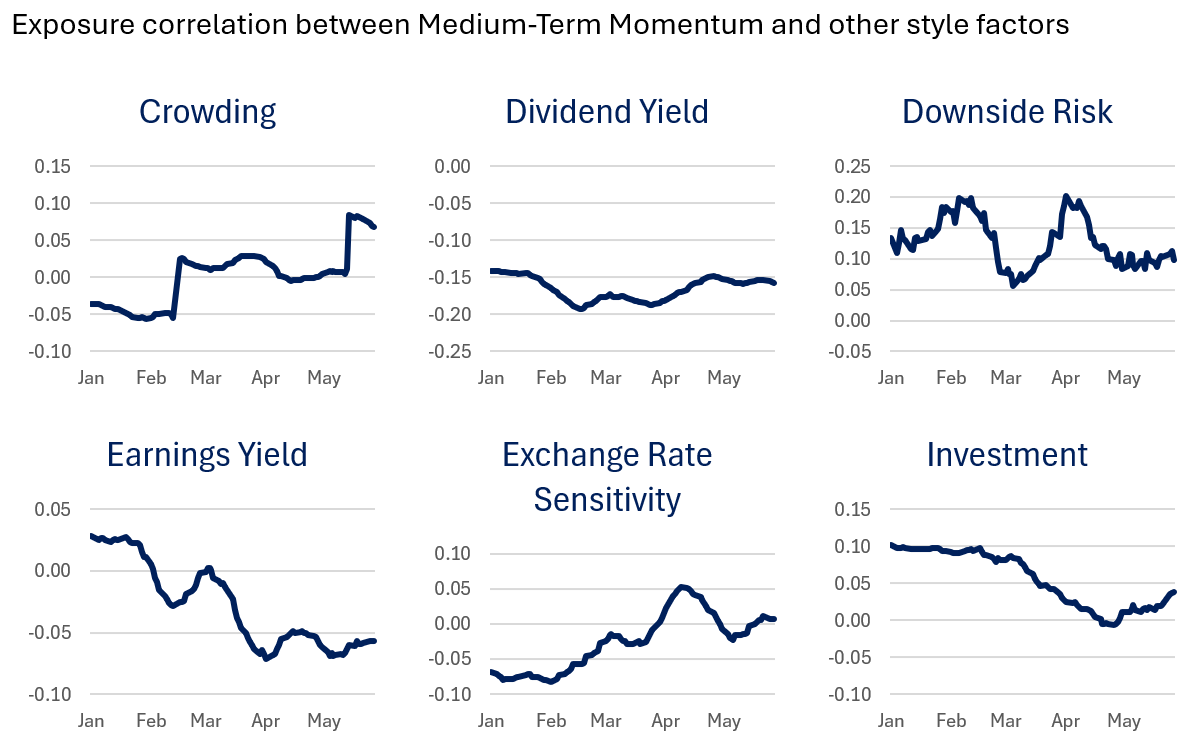
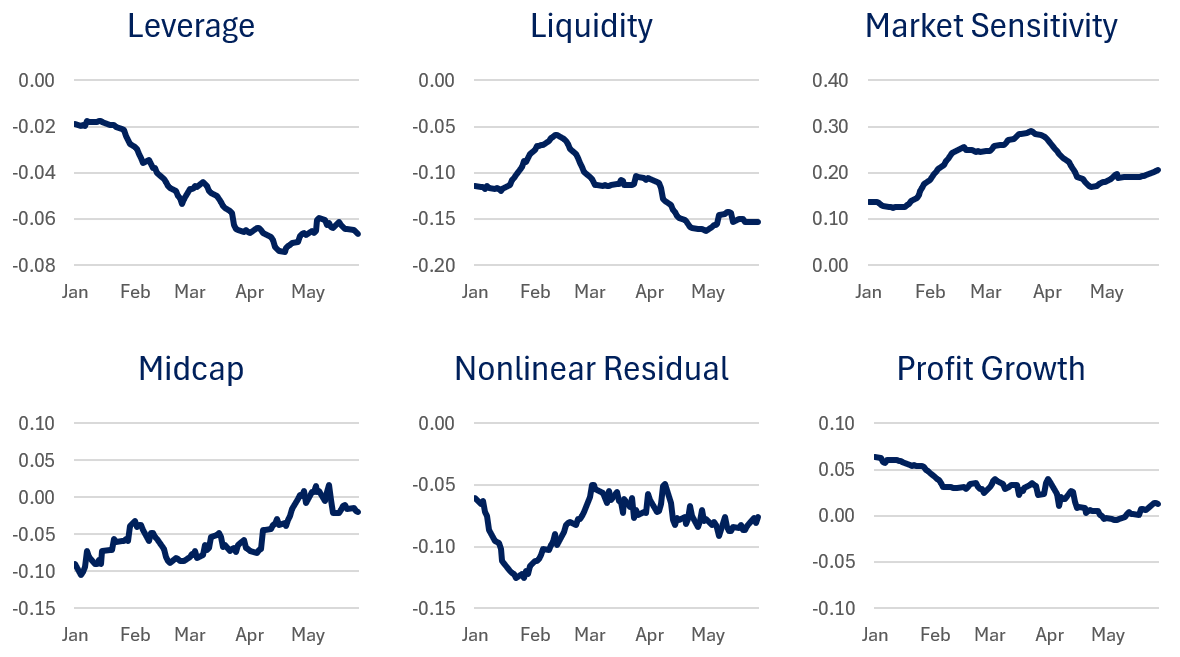
Correlating Momentum exposures with those of other factors…
The Axioma definition of Medium-Term Momentum, following the industry standard, is basically the asset return over the past 12 months excluding the last month1. Therefore, we would expect Momentum’s return to lag as new market leadership emerges in that “missing” one-month period. In addition, because of the 11-month return, Momentum is not a particularly high turnover factor: the average monthly autocorrelation in exposures is about 92% (to be expected from the 11/12 months), so we do not expect to see huge changes in exposure from one month to the next. In addition, when Momentum has positive returns, the stocks going into the period with good Momentum will continue to rank highly, also dampening turnover. From the end of April to the end of May the correlation was a relatively-high 93%, so we know some exposures would have changed even if the changes were relatively small.
To see where Momentum is moving we looked at the daily exposure correlations between Momentum and the other style factors. In general the correlations are small in magnitude, but we still found some patterns. For example, Momentum became more crowded over the quarter (or crowded stocks gained momentum) until the peak in Momentum performance, it became more expensive as its correlation with Earnings Yield dropped, stocks with higher Exchange Rate Sensitivity gained Momentum while higher Leverage and Investment lost Momentum. Initially this year high Momentum stocks also had increasingly higher short interest but that reversed in February and higher Momentum was associated with lower Short Interest as Momentum (and the market) rallied.
The volatility of Momentum, as defined by Downside Risk, Residual Volatility and Market Sensitivity is higher than average (i.e. the exposure is positive), and while that correlation has varied year to date, Momentum has lower Downside Risk and Market Sensitivity than it had at the beginning of the current rally. Momentum has been negatively correlated with Value and positively correlated with Size, with little change in those relationships.
The following charts are not in the Equity Risk Monitors, but are available on request:
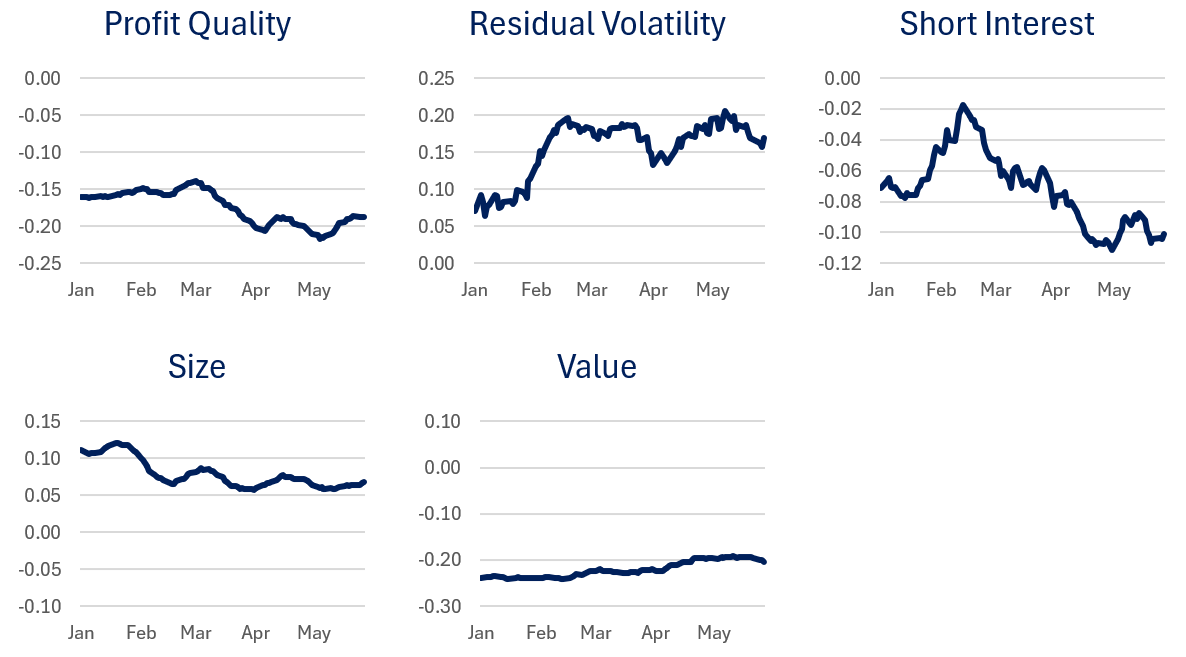
Note: These are based on the Axioma Medium Horizon 5.1 model
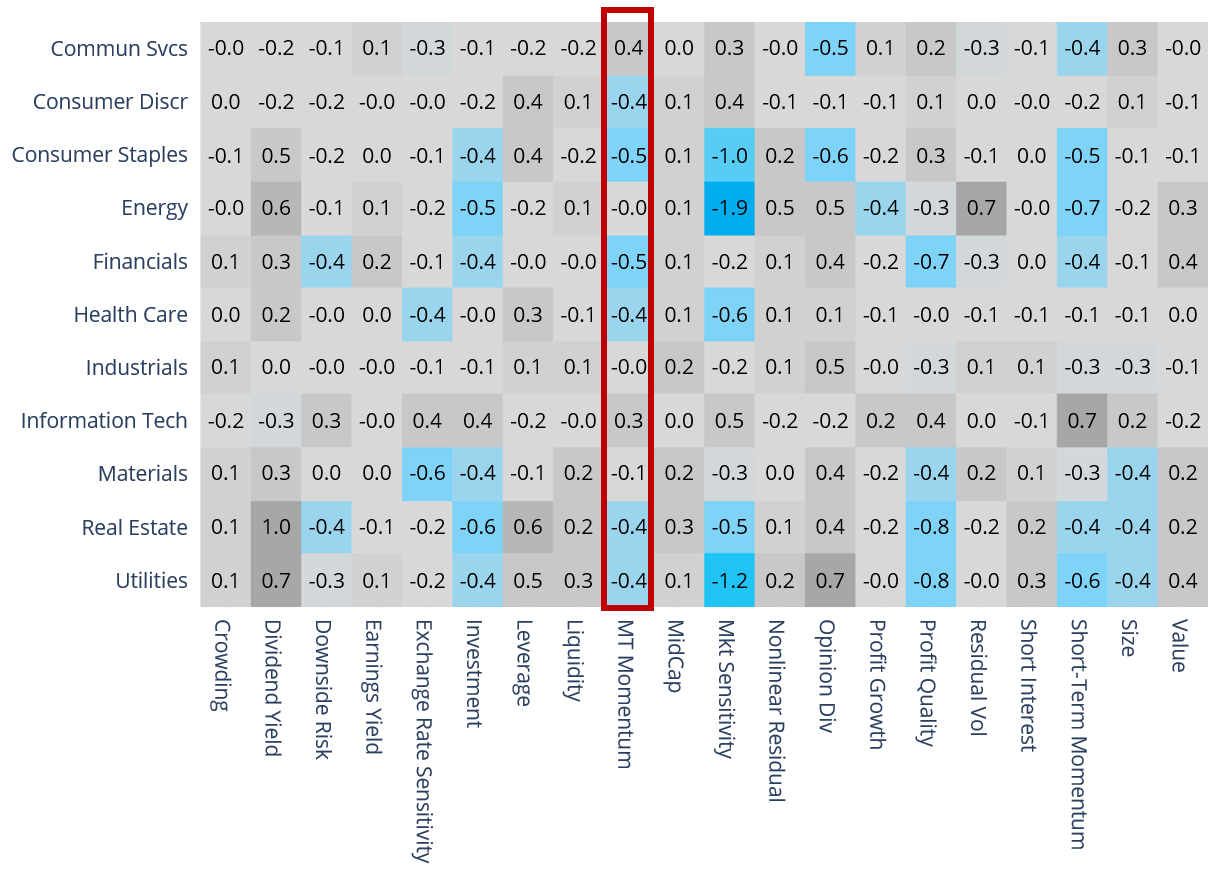
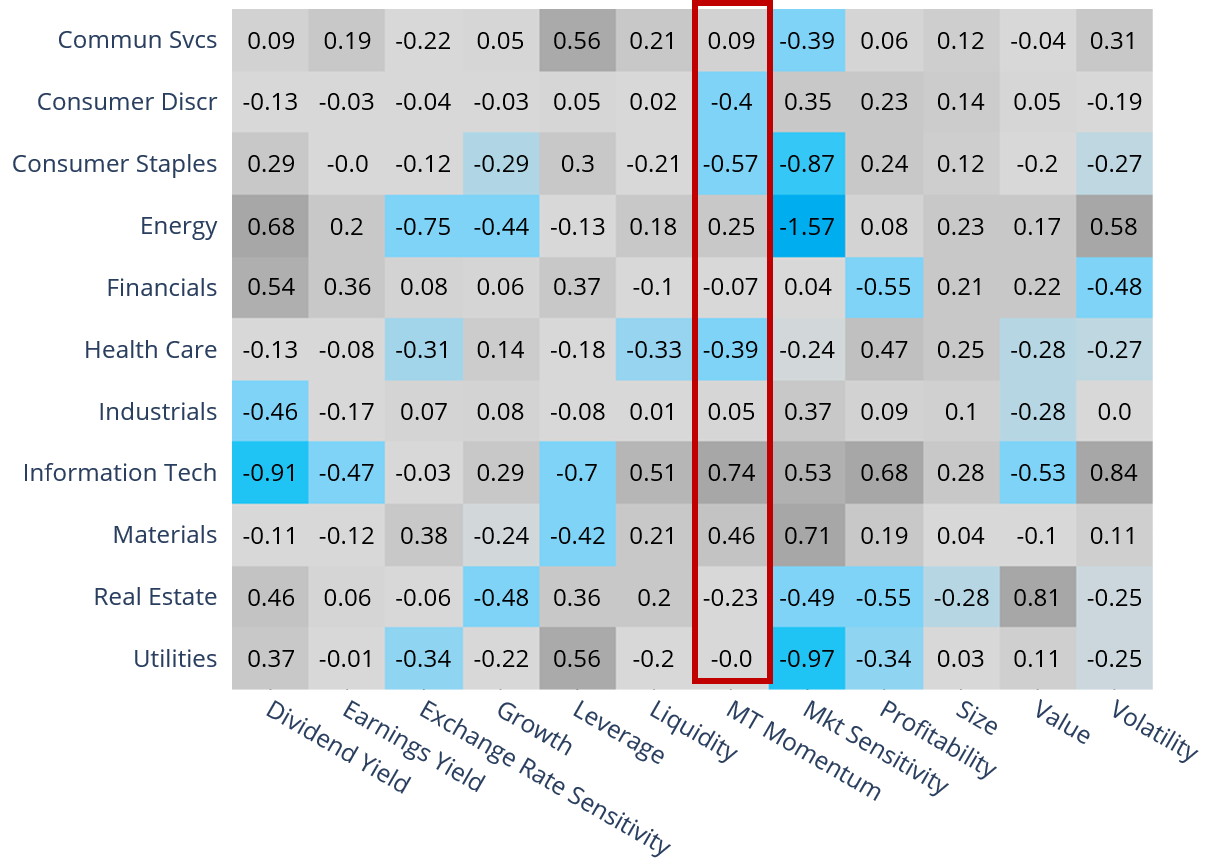
…and Sectors
Another way to identify where Momentum is and where it may be changing is in sector exposures. As of May 29, in both the Russell 1000 and the STOXX International Developed Markets Index, positive Medium-Term Momentum is clearly concentrated in Information Technology. In the US the Momentum exposure is also high in Communications Services, whereas outside the US, positive Momentum exposure can also be found in Energy and Materials.
Given the Momentum definition, the broadening out of the US market in particular in the past couple weeks is not yet incorporated in Momentum exposures. Thus, the increases in Momentum exposure since the rally began remain concentrated in Information Technology and Communications Services, both inside and outside the US. – We believe the higher breadth still favors the AI trade, but across more segments of the market, as more and more companies are adopting AI2 – We may very well see these Momentum exposures changed by next month. (For more on the spread of AI optimism across sectors, see our recent blog post.)
However, the broadening mentioned above also seemed to be fleeting, as market breadth, especially in the US, narrowed again for the five days ending last Friday. If the narrow but rising market continues, we would expect to see Momentum regain its upward trajectory. If the overall market should turn south, however, we would be more likely to see poor Momentum returns until investors decide upon a new set of stock-market leaders.
See the following charts from the Russell 1000 and STOXX International Developed Markets Risk Monitors as of May 29, 2026
Russell 1000 Sector Style Exposures
STOXX International Developed Markets Univ. Sector Style Exposures
Weekly Asset Return Proportion Ahead of Index
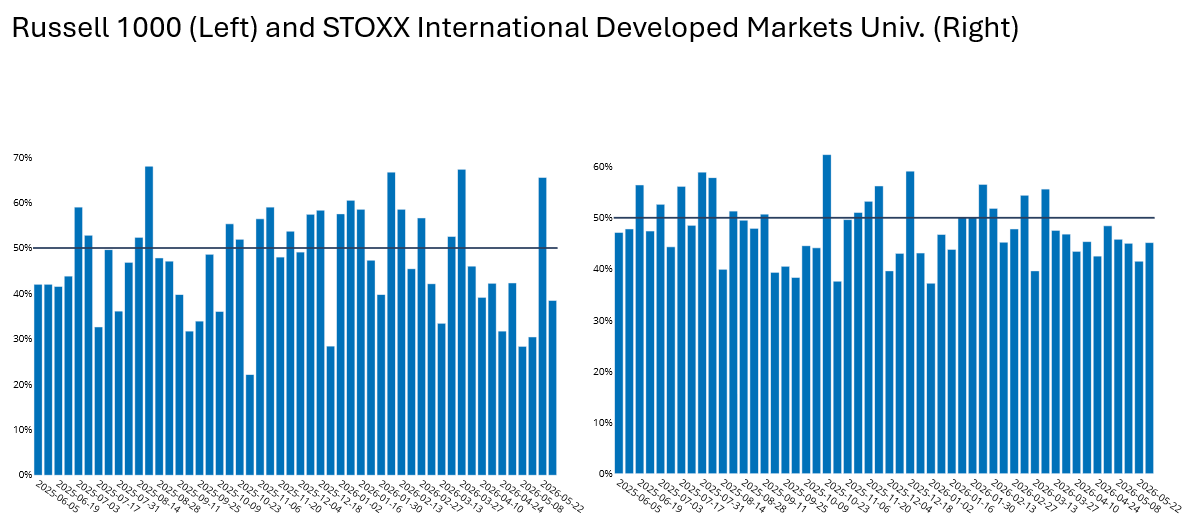
Note: Bars represent the percent of stocks in the relevant index that have beaten it over rolling five-day periods
Footnotes
1 There are a few modifications to this simple formula, such as how the weights decay, but this describes the basic idea.
2 Of course a broadening market may reflect other investor sentiment as well, such as the expectation that earnings strength in many sectors in the first quarter will continue, hopes that the US and Iran will reach a deal, etc.
You may also like


.png%3Fh%3D810%26iar%3D0%26w%3D1080&w=3840&q=75)