

EQUITY RISK MONITOR HIGHLIGHTS
WEEK ENDED JUNE 05, 2026
Technology "Air Pockets"
When one considers the seemingly ludicrous appreciation some shares in the Technology sector have had YTD 2026, a day like Friday June 5th should not be treated as an indicator of anything other than some “modest” profit-taking in light of a surprising US jobs report. While the Semiconductor selloff had already begun on the 4th after the “disappointing” guidance from Broadcom (AVGO) after the close on the 3rd, the unexpected strength in US hiring gave investors more incentive to take profits, as this newly rate-sensitive sector faces prospects of higher interest rates for longer.
Here are the top 20 gainers in the IT sector of the Russell 1000 index YTD through May 29th and their 1-day losses on June 5th. For emphasis, we’ve added the “implied” annualized return given each stock’s return over the first 100 trading days of the year:

Source: Arcana
When we look at it this way, it doesn’t seem so bad, does it? Once you get the water out of your eyes, it is clear that these are modest pullbacks when taken in context. Here is SNDK’s YTD chart vs. the IWB (Russell 1000 ETF):
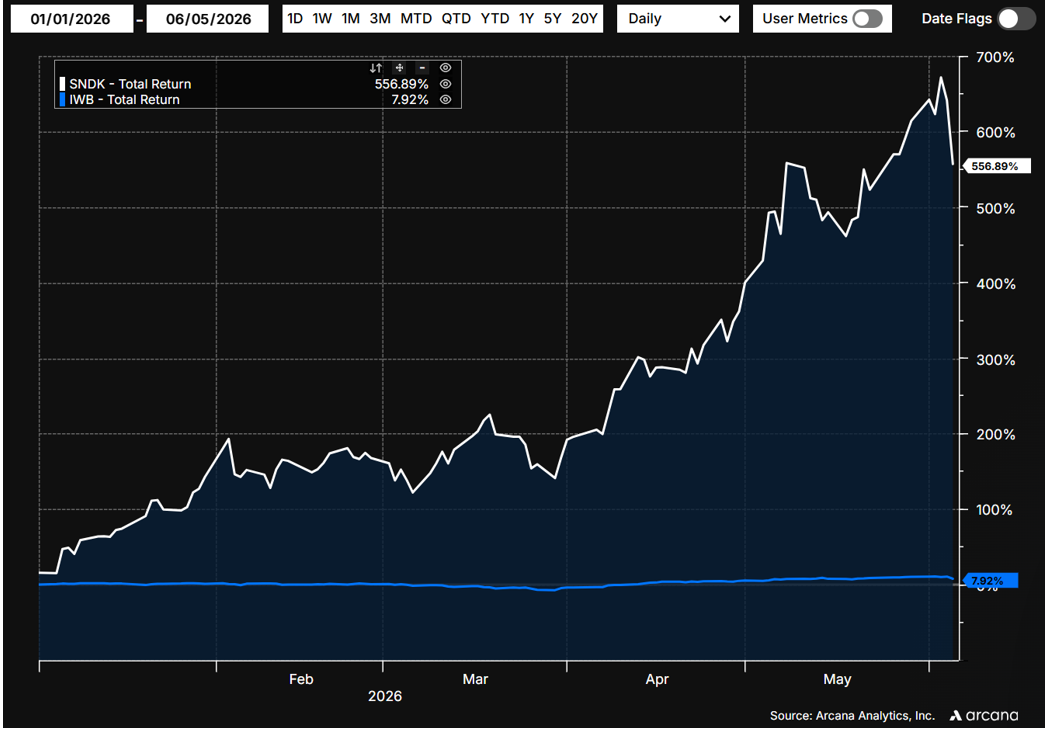
Source: Arcana
The 11.4% loss on the 5th was not even a 2 standard deviation move relative to SNDK’s forecast annualized volatility, and thanks to the magic of compounding it is still up an astounding 557% on the year.
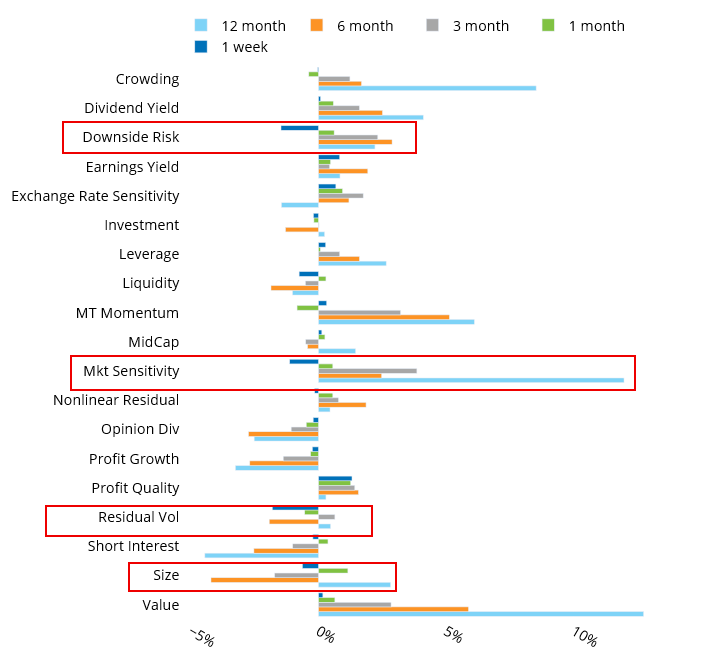
From a style factor perspective, the 5th looked like a classic “risk-off” move. Given the risk repricing almost required by the jobs report surprise (Fed easing less likely, persistent inflation more likely), this is probably healthy. The factors with the biggest drawdowns in the US were: Market Sensitivity, Residual Volatility, and Downside Risk, all of which had been up over the prior 3 months. Throw in a drawdown for Size (which had been trending further upward in the prior month) and you have a complete picture of what may be a brief pause on our way to the ”AI utopia”.
See Chart 17, US Equity 5.1 Risk Monitor, June 5, 2026
Many commentators have focused on the lack of breadth in the US market, and indeed it is a concern - both from the perspective of historic concentration (the top 10 companies in the Russel 1000 are 37% of the total index) and from a liquidity perspective. The lack of opinion divergence in these names can cause sharp moves from highly unbalanced order books, even on stocks with large floatation. However, there is an upside to this, particularly for active managers that are not so sanguine about the coming AI utopia:
See Chart 27, US Equity 5.1 Risk Monitor, June 5, 2026: Weekly Asset Return Proportion Ahead of Index
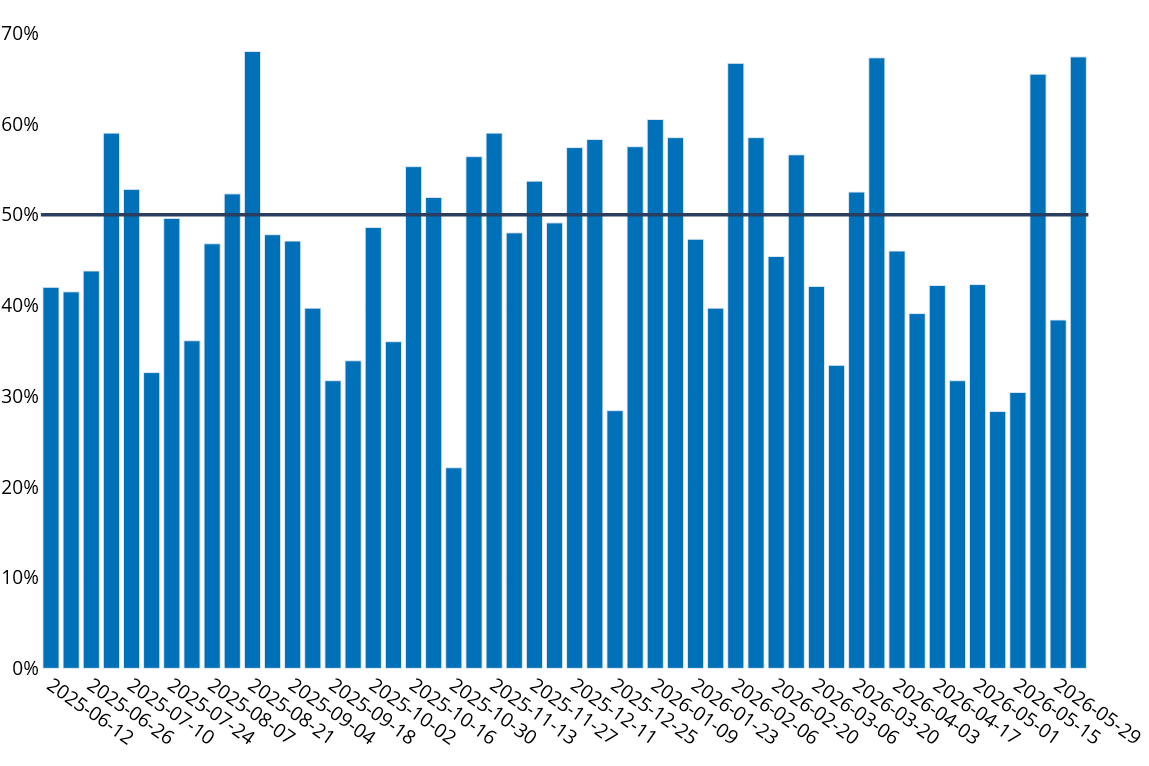
Almost 70% of the names in the Russell 1000 beat the index last week, as the big tech leaders bore the brunt of the selloff on Friday.
You may also like


.png%3Fh%3D810%26iar%3D0%26w%3D1080&w=3840&q=75)