

EQUITY RISK MONITOR HIGHLIGHTS
WEEK ENDED JULY 24, 2026
In this week’s highlights we focus our analysis on the differences in performance and risk between US Large Cap and US Small Cap stocks
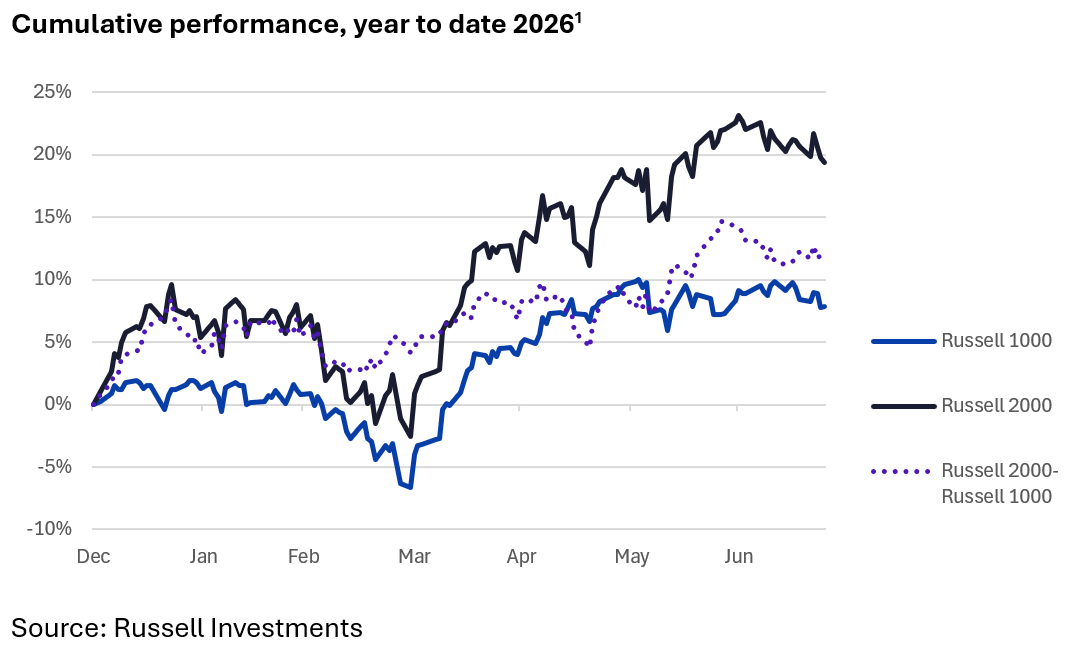
This year, small caps have substantially outperformed large caps despite the popular narrative about the AI and semiconductor trade favoring certain mega-caps. As measured by the Russell 1000 and Russell 2000, small caps’ year-to-date return is roughly double that of large caps, and the trend of relative performance has been positive for most of this year. This “stealth” performance is also apparent when comparing the US to its global counterparts. The STOXX US index, which has a large- and mid-cap composition, has underperformed other developed markets (STOXX US is up 8.7% versus STOXX International Developed Markets Universal’s 9.9% gain), but the gap is even wider between the US and STOXX Japan (+19%) and STOXX Emerging Markets (+17.2%).
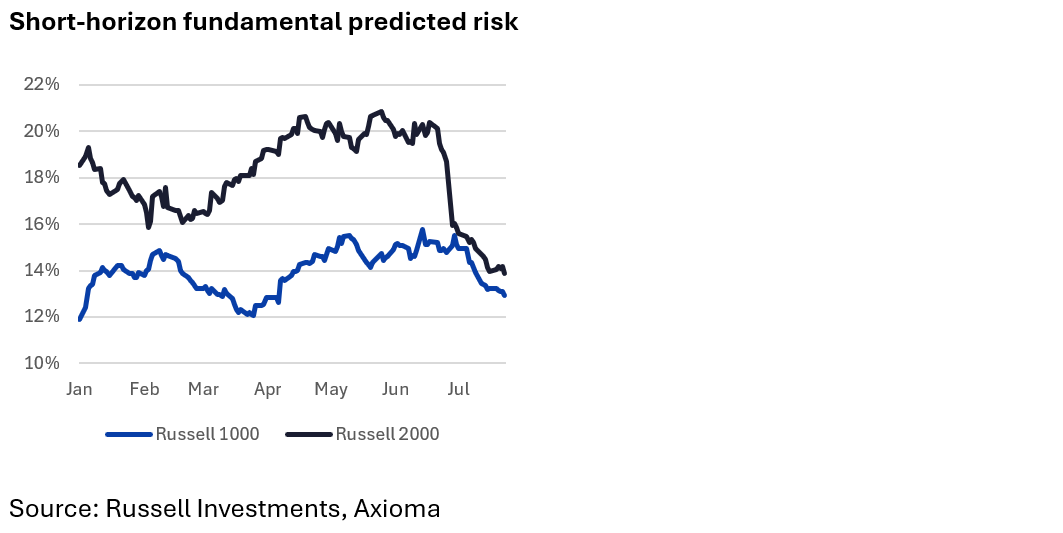
The risk picture also illustrates the changing landscape. The Russell 2000 started this year with short-horizon fundamental risk that was 36% higher than that of the Russell 1000. The risk gap fluctuated throughout the year – narrowing to just 10% in early February, but increasing back to about 35% by the end of March as small-cap risk marched steadily upward while large-cap risk declined throughout the first month of the Iran conflict. From that point, both indices saw predicted risk climb, then flatten, until late June, when the annual Russell rebalance led to a sharp drop in Russell 2000 volatility. We wrote about that in more detail in these weekly highlights. Since the end of June predicted volatility took a dive for both indices, and the gap has narrowed to less than 7%.
A new look at statistical versus fundamental forecasts, or “risk spreads”
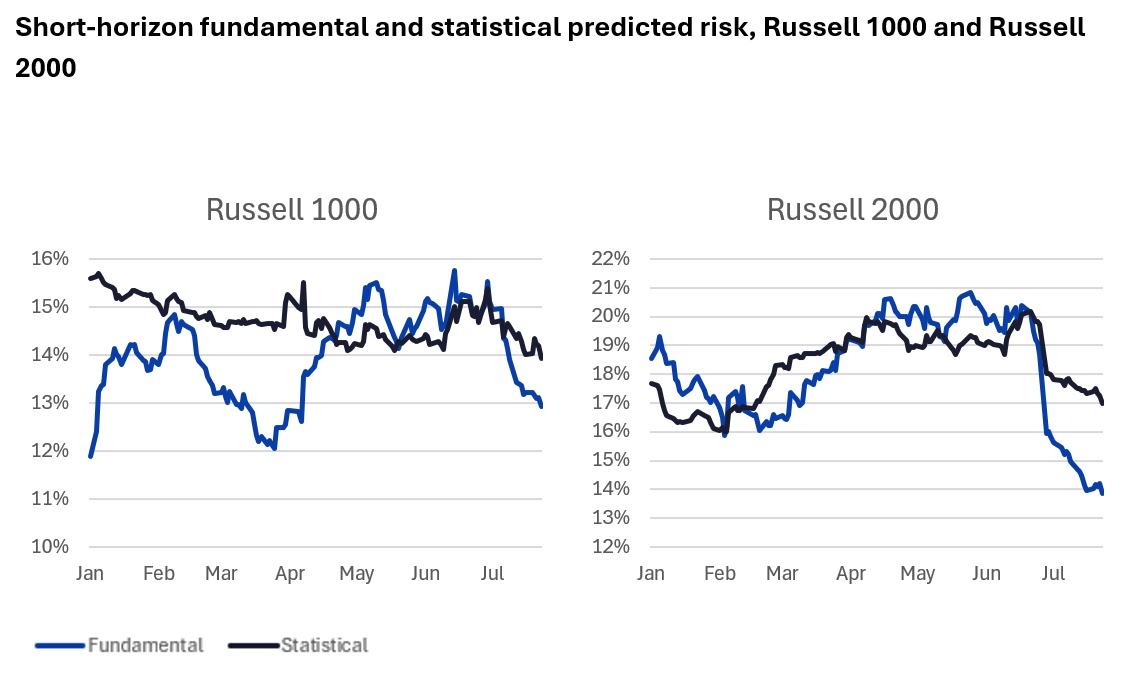
This risk backdrop raises a related question: whether statistical models are detecting concentrated themes that are less visible in fundamental model forecasts. Just this week, our SimCorp colleagues released a very interesting report about finding an “AI Risk Factor” in the US. It turns out it has been there for a while in the Axioma statistical model. They found that “Statistical Factor 2” is now explaining a growing share of US market risk and were able to trace that factor back to an AI investment theme. You can find the report here.
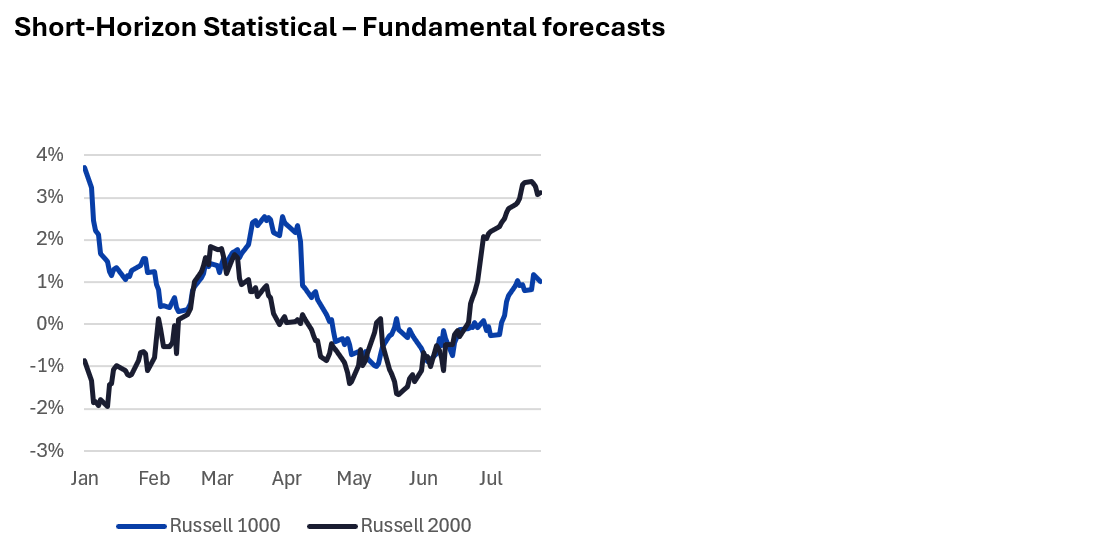
To follow up on their research, we looked at current spreads between the statistical and fundamental models, using the Axioma US5.1 model suite for the Russell 1000 and the US4 Small Cap model for the Russell 2000. We found that both the Russell 1000 and Russell 2000 are currently experiencing a higher risk forecast from the short-horizon statistical model variants compared with the fundamental models suggesting a source of risk in these indices not seen by the fundamental models. Using model data as of July 24, 2026, sure enough, about 42% of the risk of the Russell 1000 is coming from “Statistical Factor 2,” which is what was identified as the “AI” factor in the paper. The conclusion that AI is driving the risk spread is less clear-cut for the Russell 2000, where about 24% of the risk is in Factor 2, but almost 70% of the risk is in Factor 1, usually thought of as the Market factor, which is also reflected in the fundamental model. Using US5.1’s short-horizon statistical model as the basis for the Russell 2000 analysis shows 72% from Factor 1 and 19% from Factor 2. Overall, AI-related risk appears more concentrated in large caps, while small-cap statistical risk remains more market-driven.
Footnote
1 Note that this week’s charts do not appear in the equity risk monitors, but are available on request


