

EQUITY RISK MONITOR HIGHLIGHTS
WEEK ENDED JULY 31, 2026
- Medium-Term Momentum Goes Up YTD
- Then, Medium-Term Momentum Goes Down and Drags other Factors with It
- Medium-Term Momentum in Developed and Emerging Markets Also Subject to Gravity
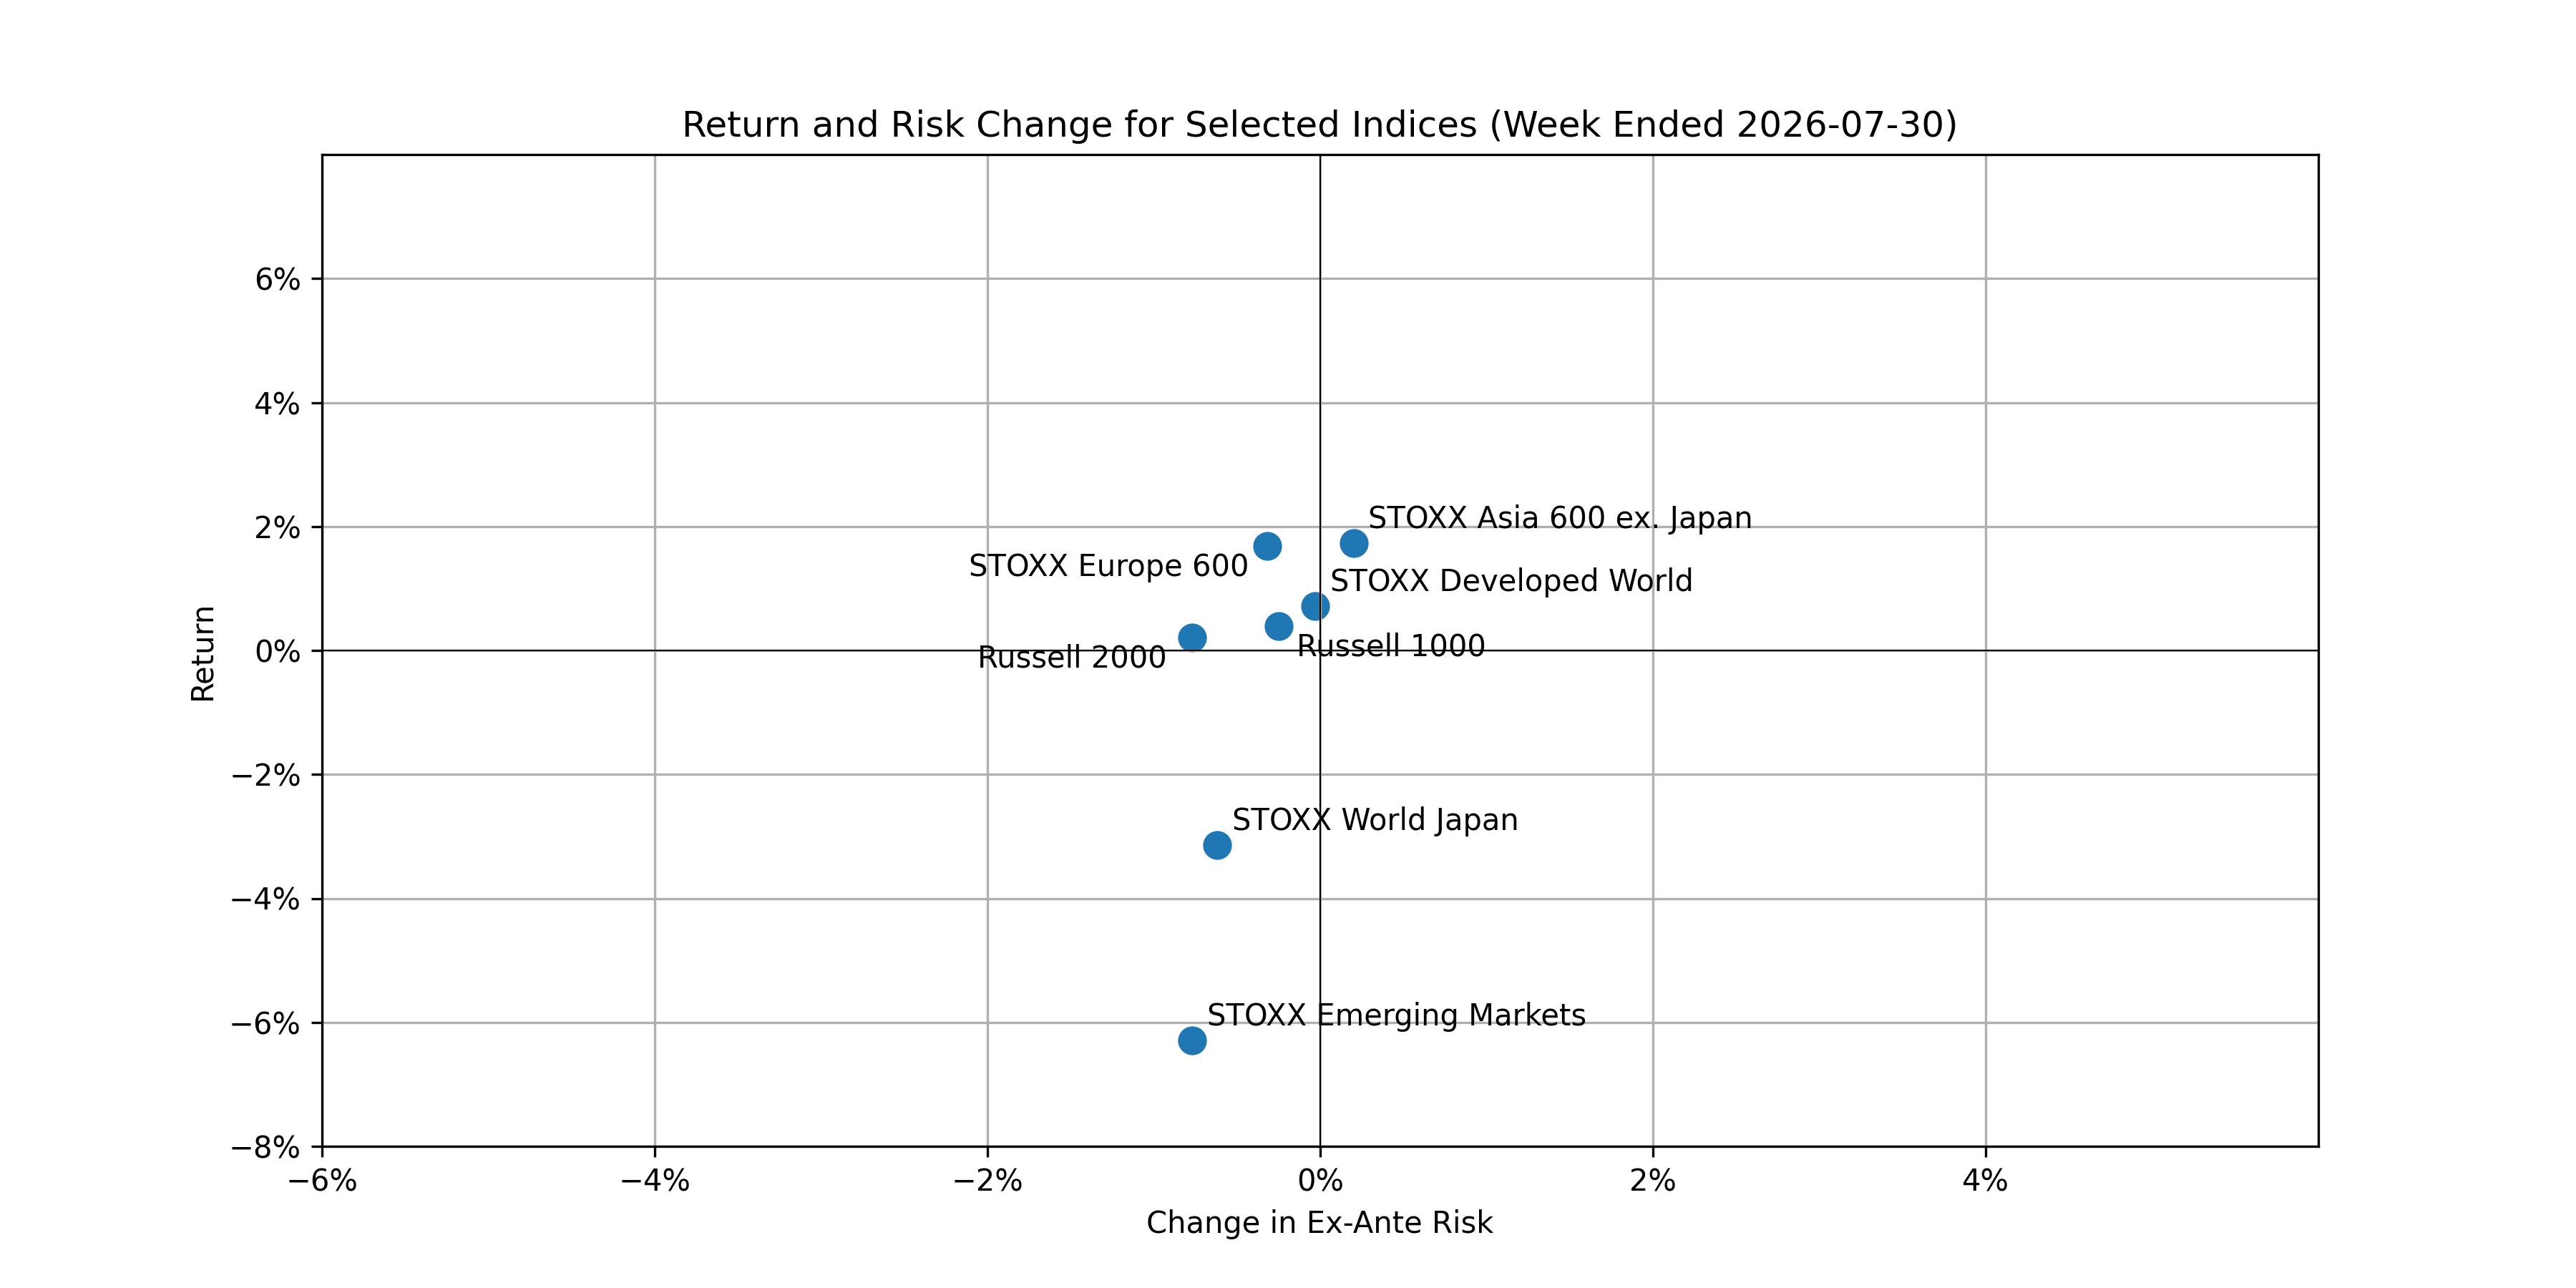
Markets finished July with one of the more volatile weeks of the year. Despite the intraweek swings, most of the indices we track finished modestly higher. Trader sentiment turned negative on Wednesday after Fed Chairman Kevin Warsh signaled little appetite for a near-term hike. Stocks recovered on Thursday, helped by a standout earnings beat from Microsoft that strongly lifted the technology names. Internationally, Emerging Markets and Japan were the notable laggards, both ending the week firmly lower.
Adding to the volatility around AI-linked names, Situational Awareness, the AI-focused fund run by 24-year old Silicon Valley “wunderkind” Leopold Aschenbrenner, saw roughly two-thirds of its July gains erased. As a result, the fund was forced to offload a large share of its equity holdings to Citadel in order to satisfy lender margin calls.
Despite the turmoil, all the indices we track showed flat to decreasing risk for the week, continuing the moderation in market risk seen over the last month. STOXX Asia ex-Japan 600 was the only index in the group to see risk tick higher.
The following chart is not included in the Equity Risk Monitors but is available on request:
You Can Profit on the Irrational…
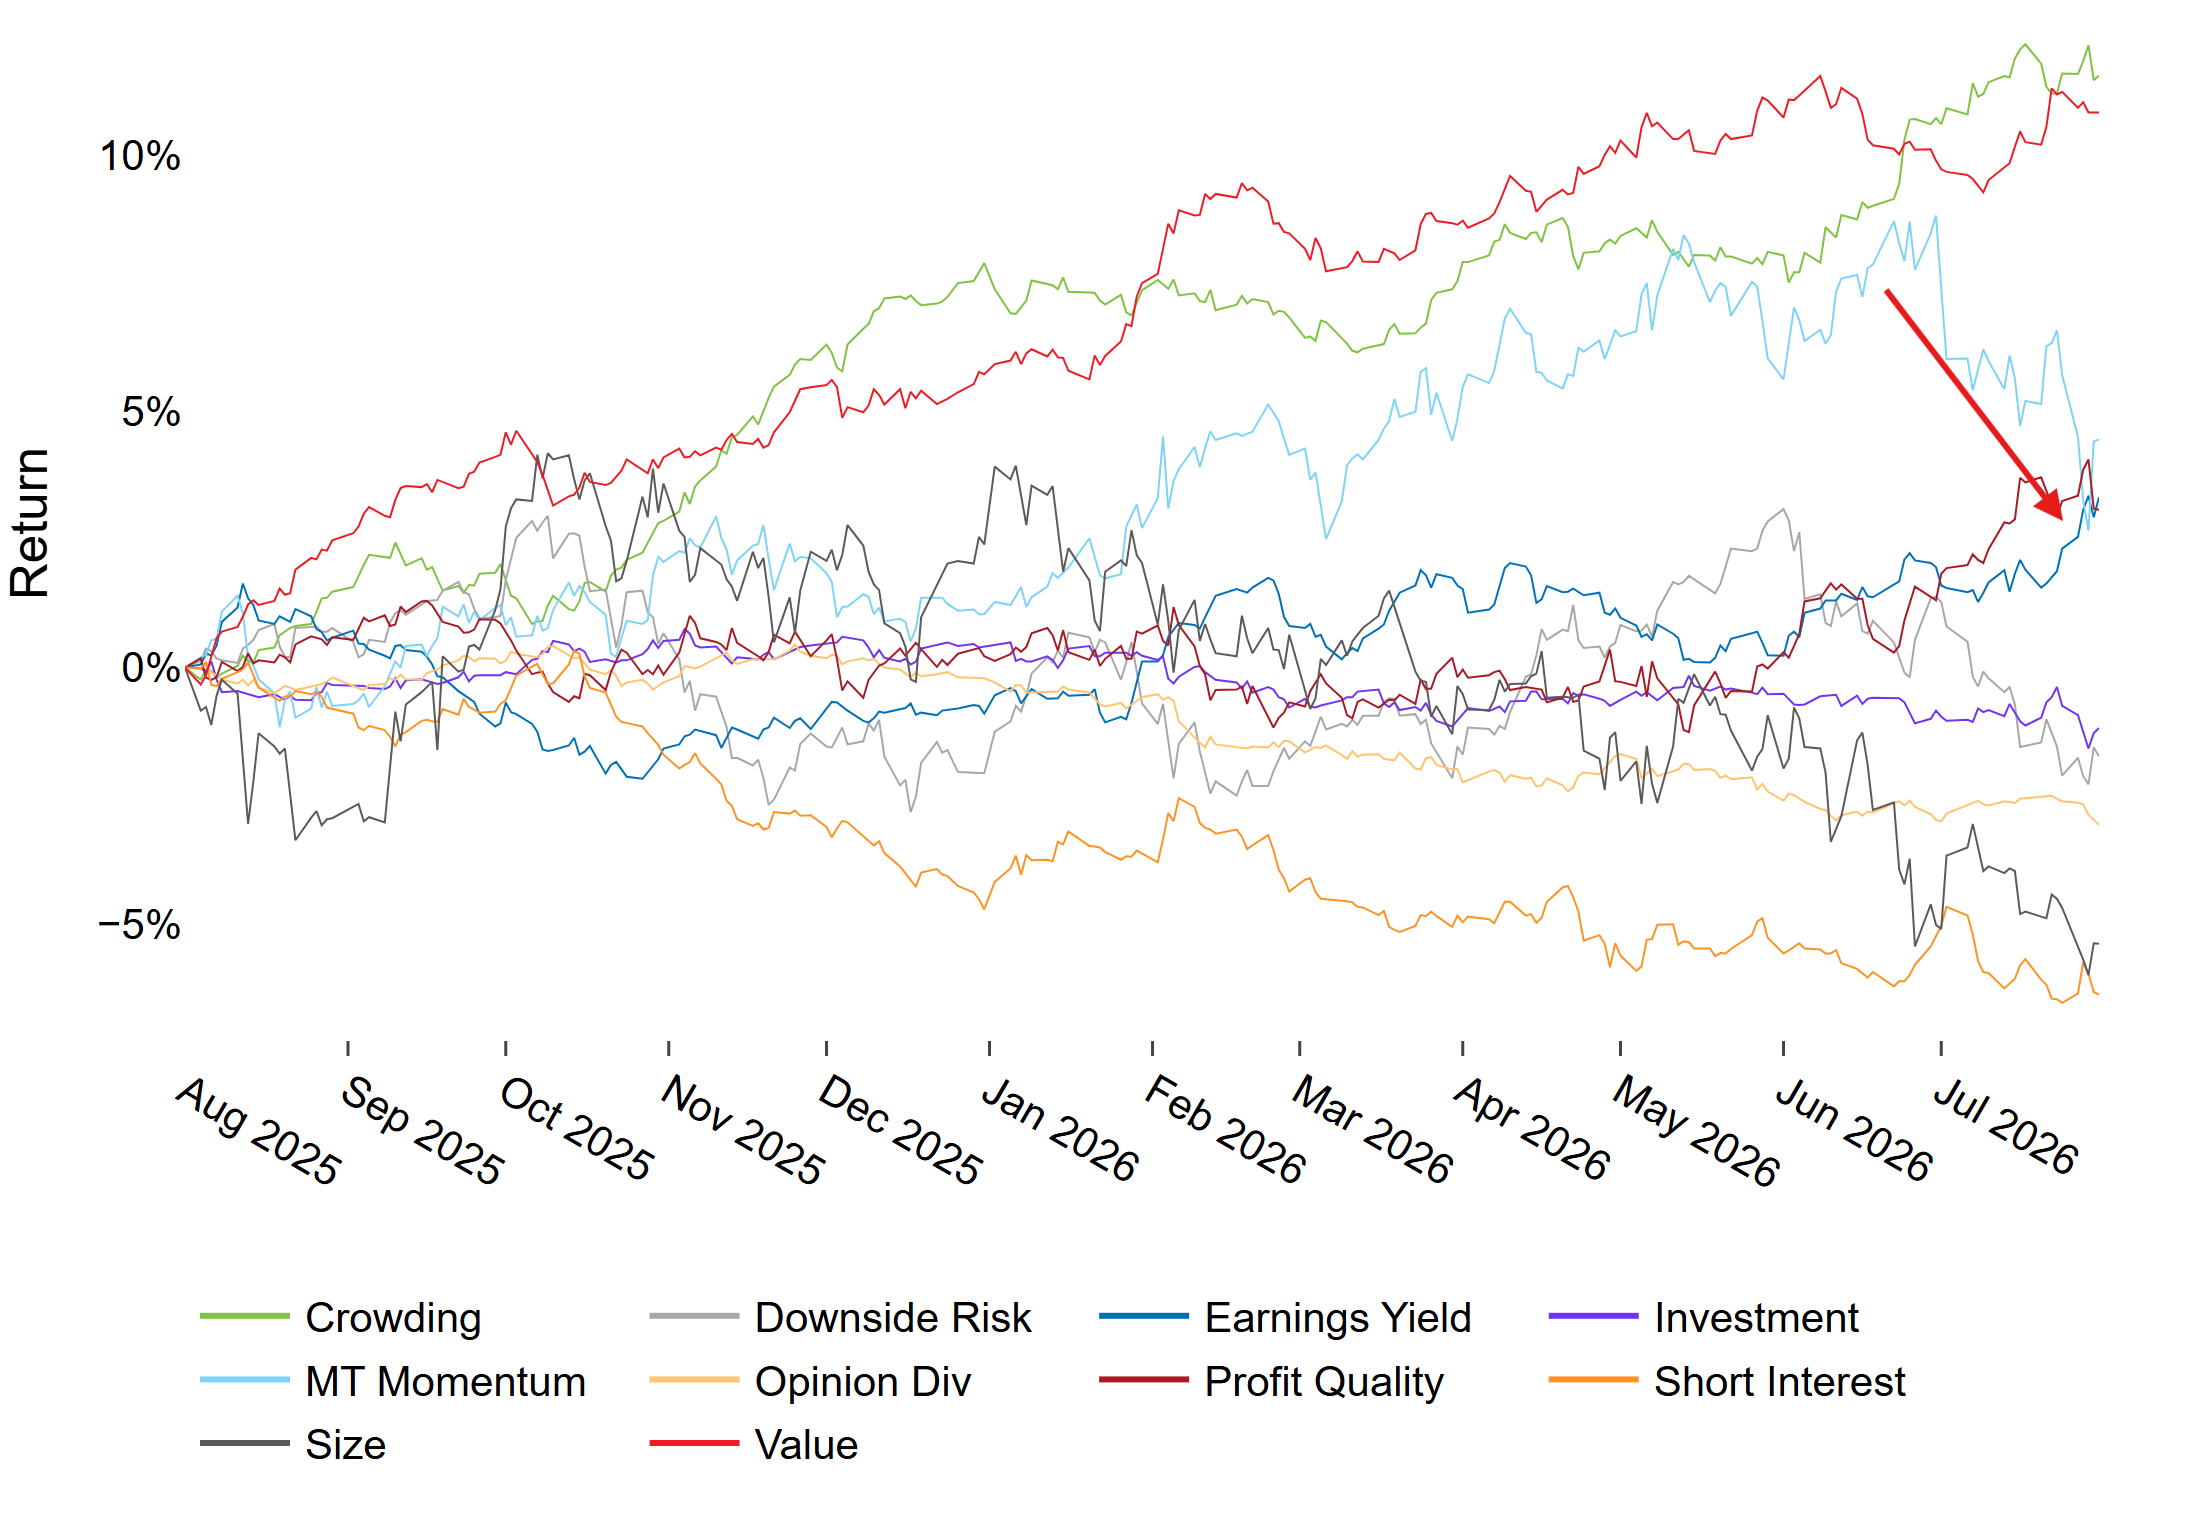
Before July, the Medium-Term Momentum factor in the US 5.1 Medium Horizon Risk Model was the 3rd best performing signal over the past year, but since the start of last month, the factor has taken a beating.
See chart from Russell 1000 – Axioma United States (AXUS5.1) Equity Risk Monitor as of August 3rd, 2026
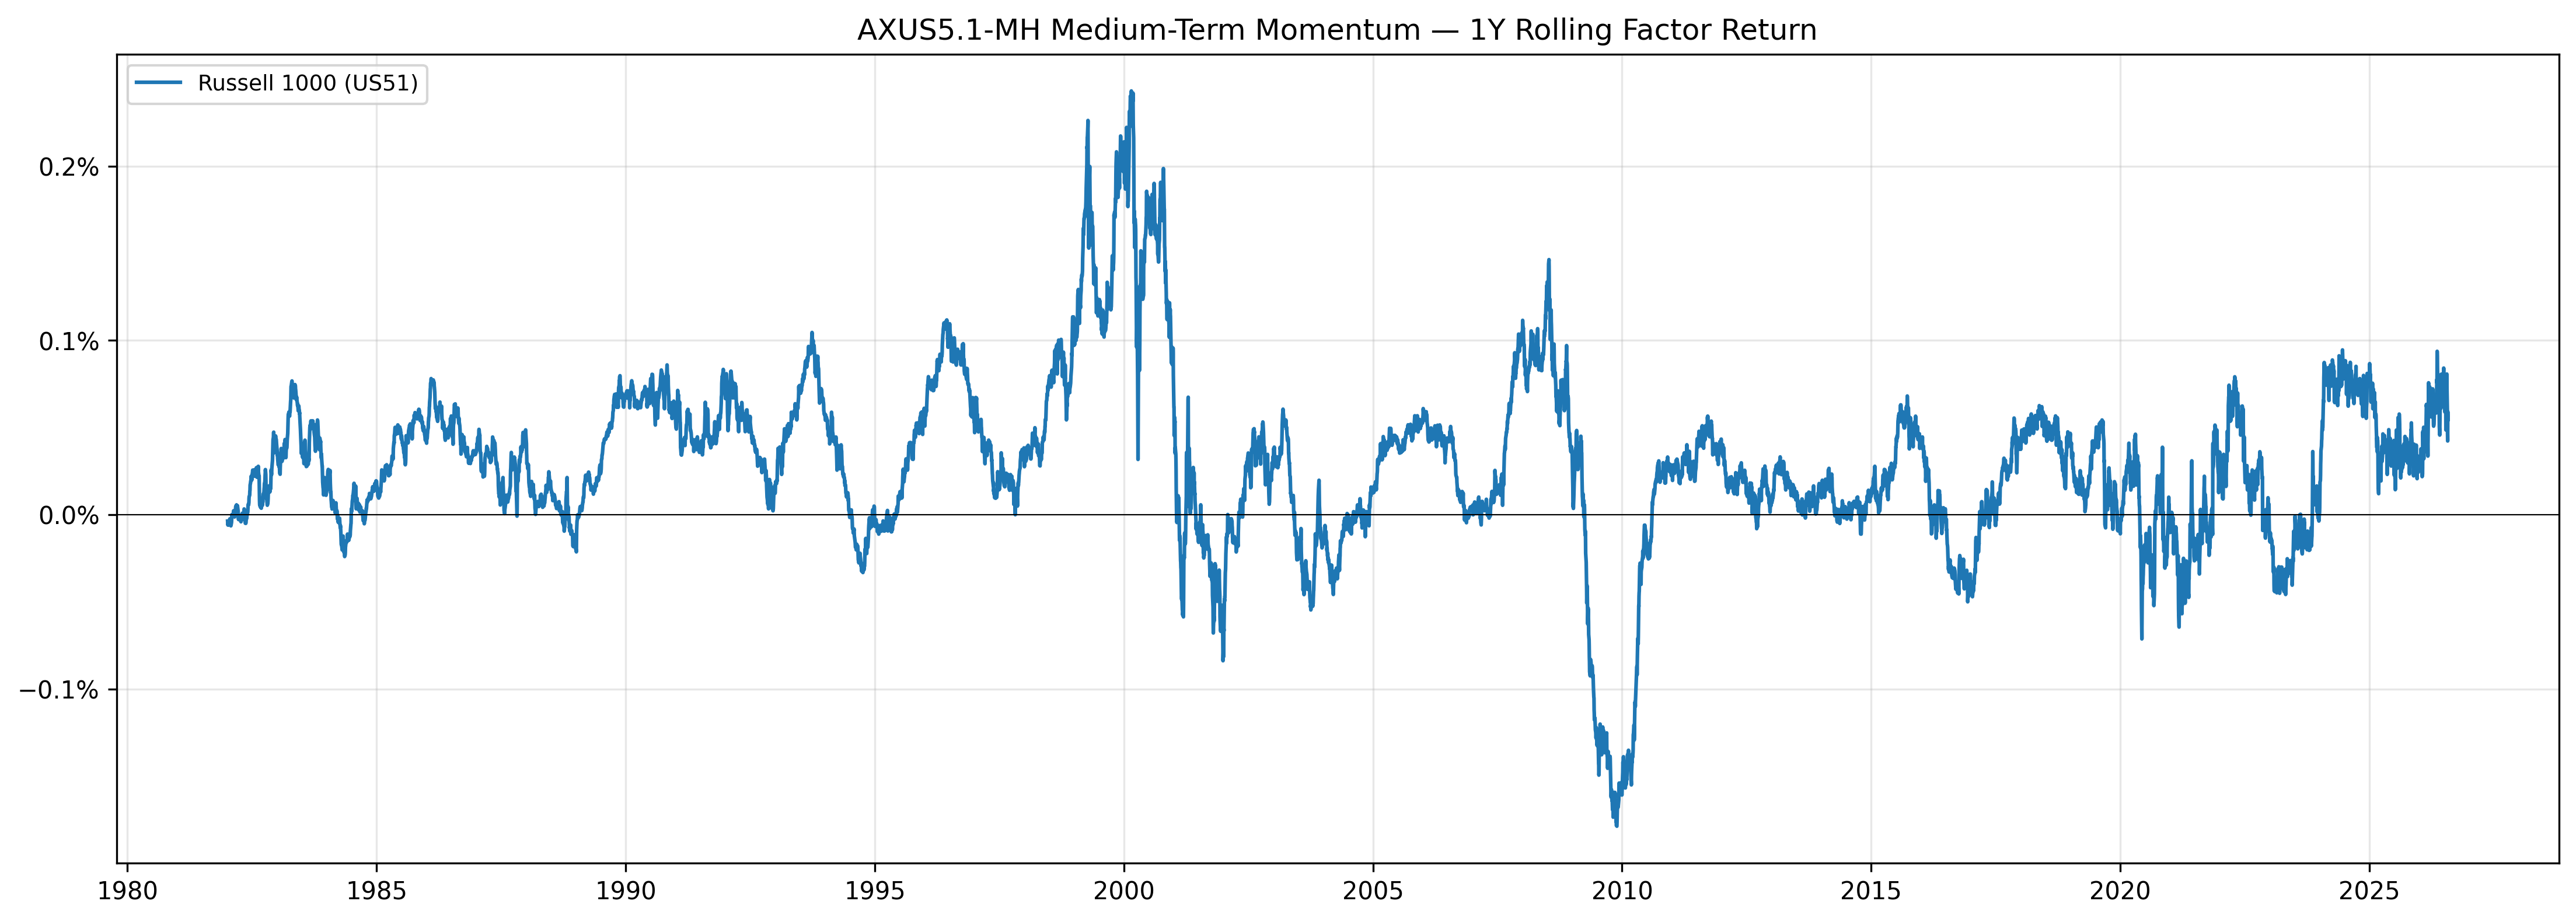
At its most recent peak, the rolling 1Y Medium-Term Momentum returns just barely passed the level reached at the end of 2024.Before 2024, the factor’s return had not performed this well over a one year period since the lead up to 2008’s Global Financial Crisis. In a recent piece, we noted that Momentum tends to perform much better than average just prior to a market peak, and that was certainly a good example.
The following chart is not included in the Equity Risk Monitors but is available on request:
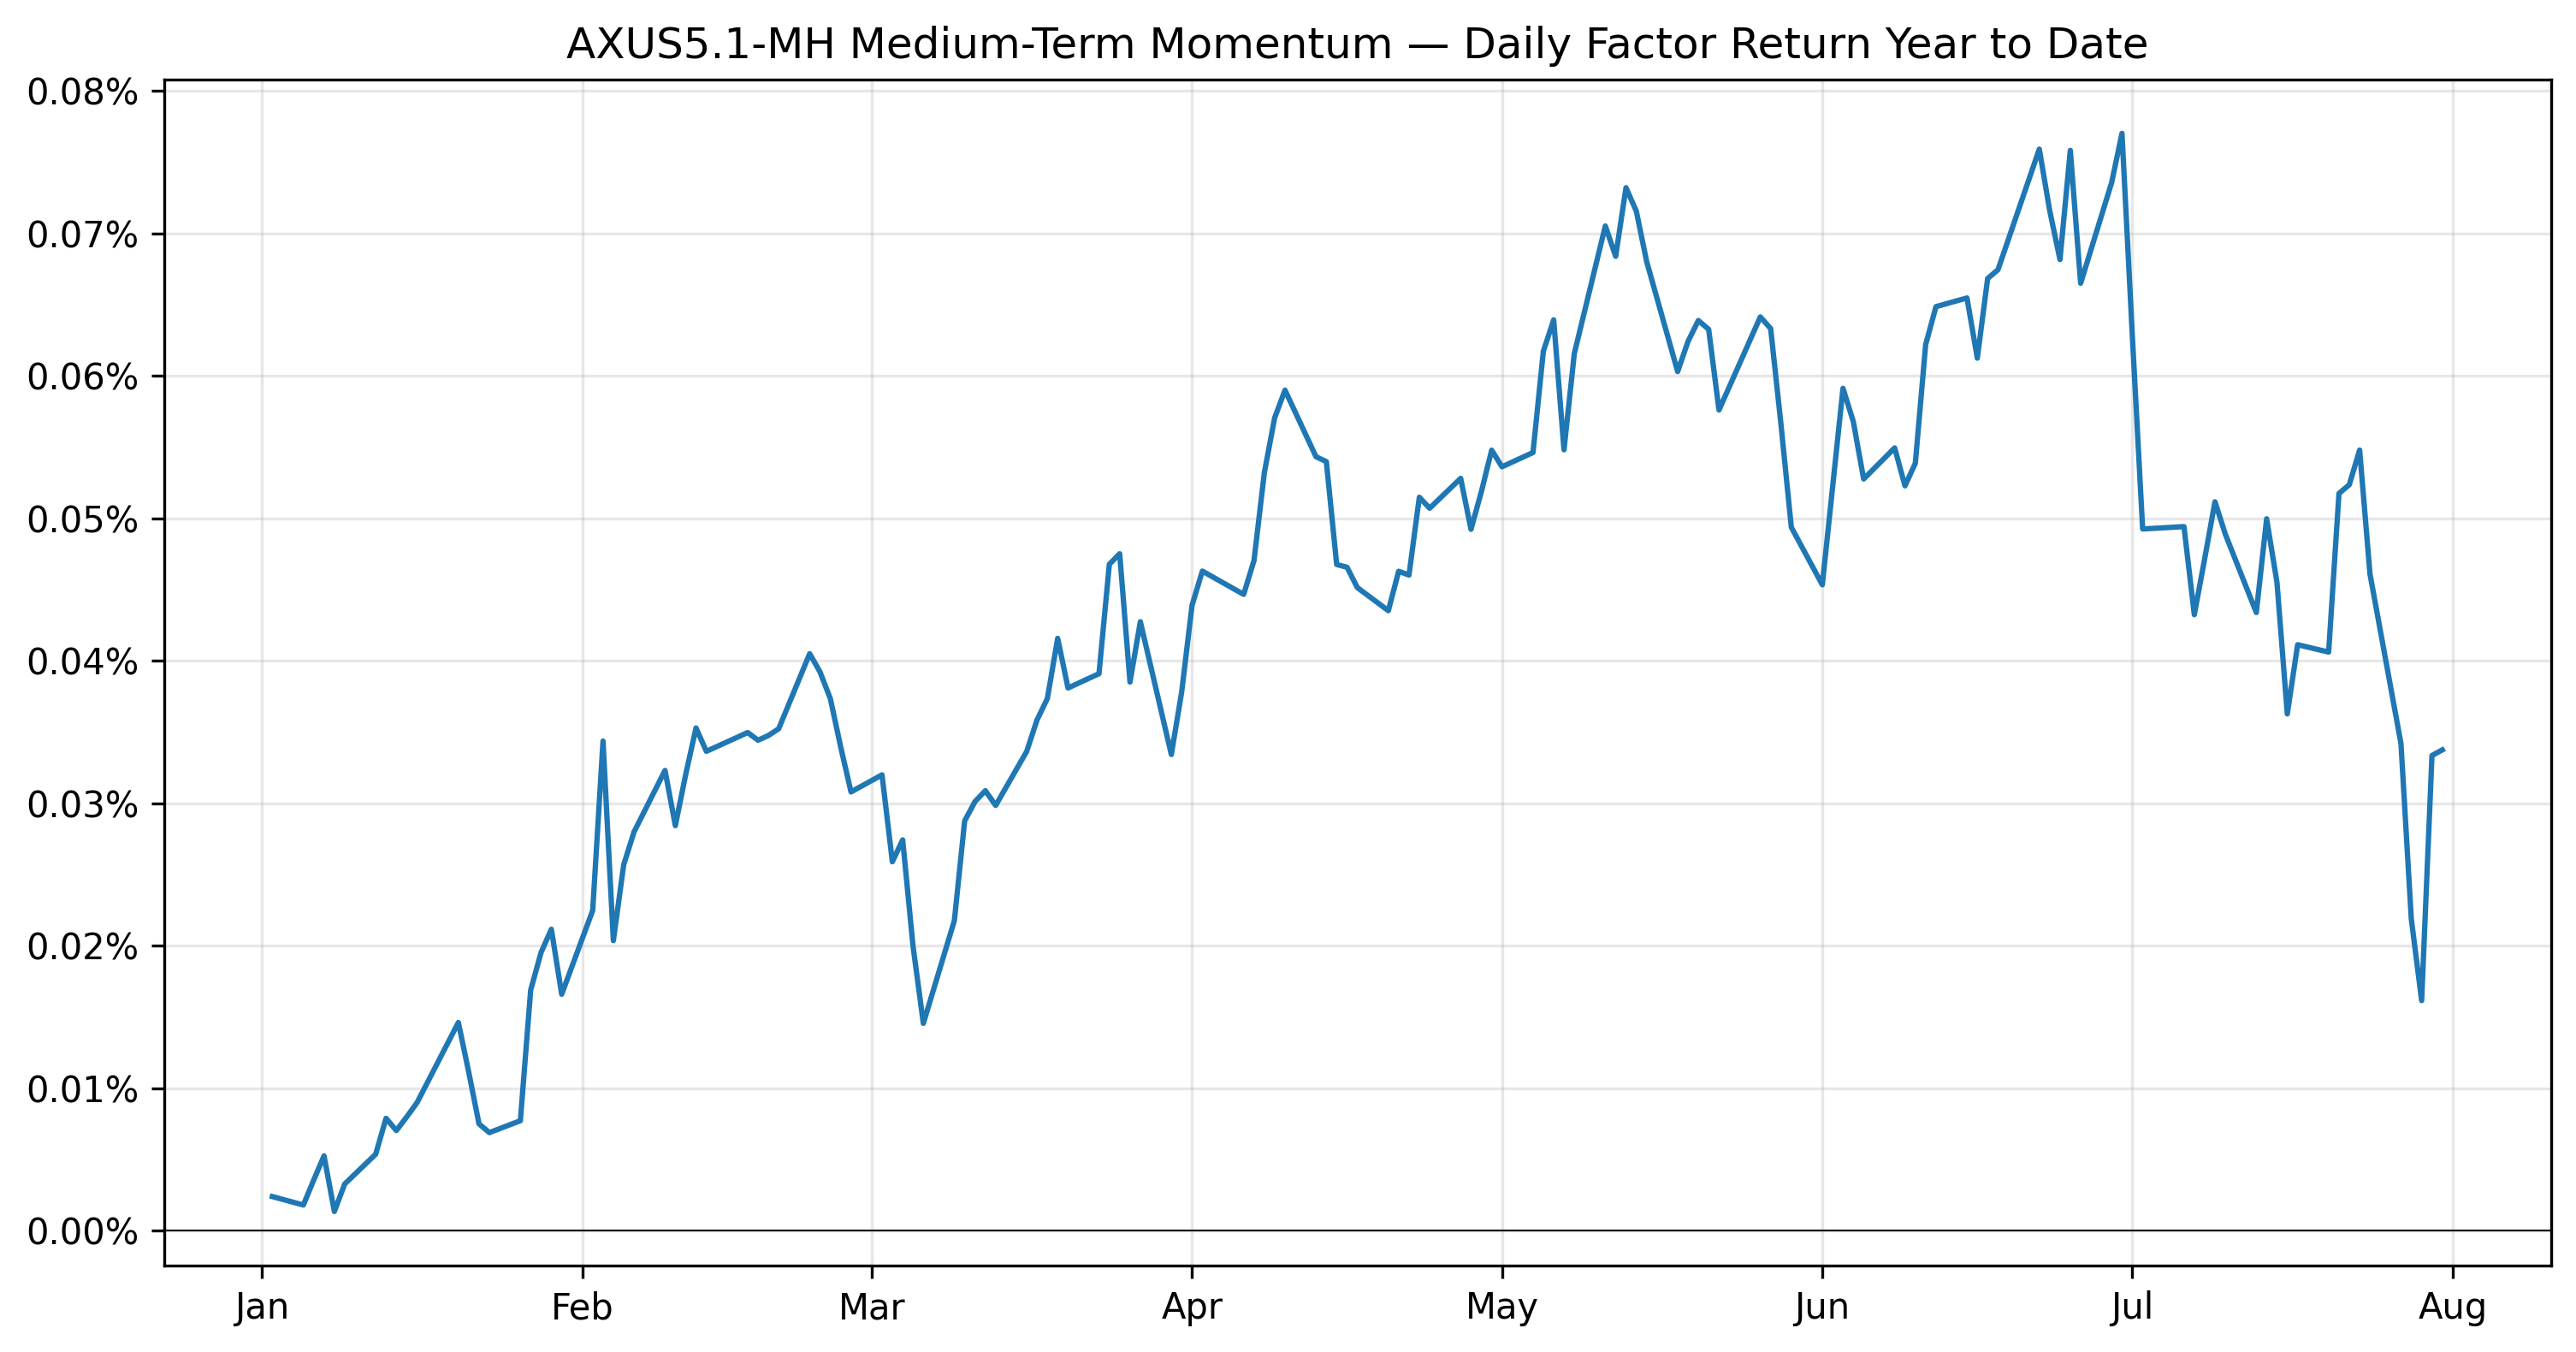
However, the factor’s drawdown in July has erased most of the gains year to date.
The following chart is not included in the Equity Risk Monitors but is available on request:
During the drawdown, multiple days saw one week rolling returns outside -three standard deviations below the mean, with 7/29 experiencing the largest Medium-Term Momentum drawdown since COVID.
The following chart is not included in the Equity Risk Monitors but is available on request:
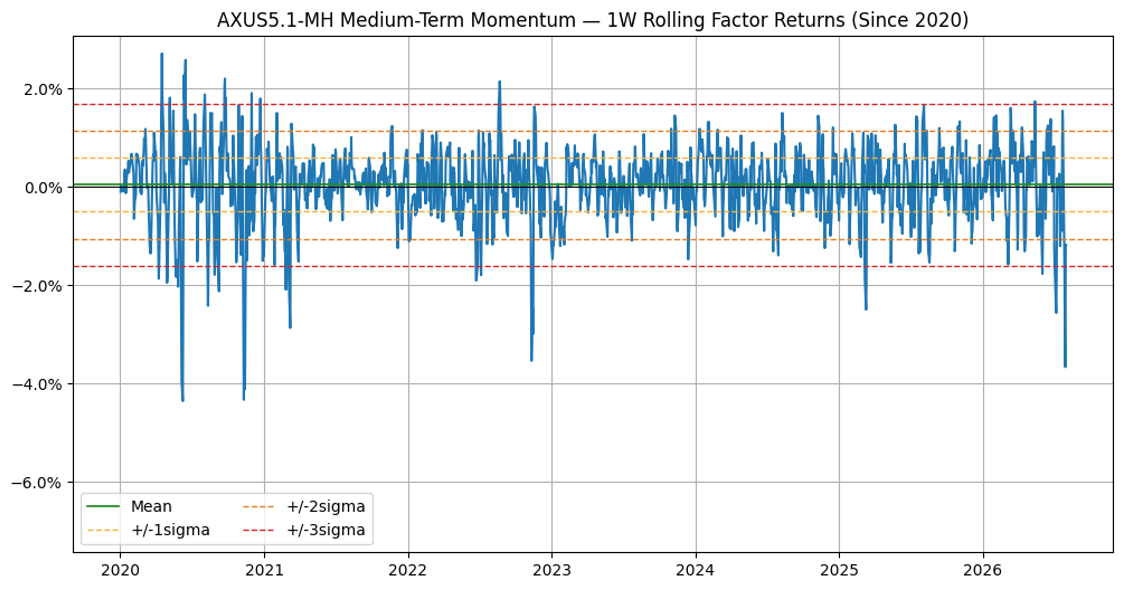
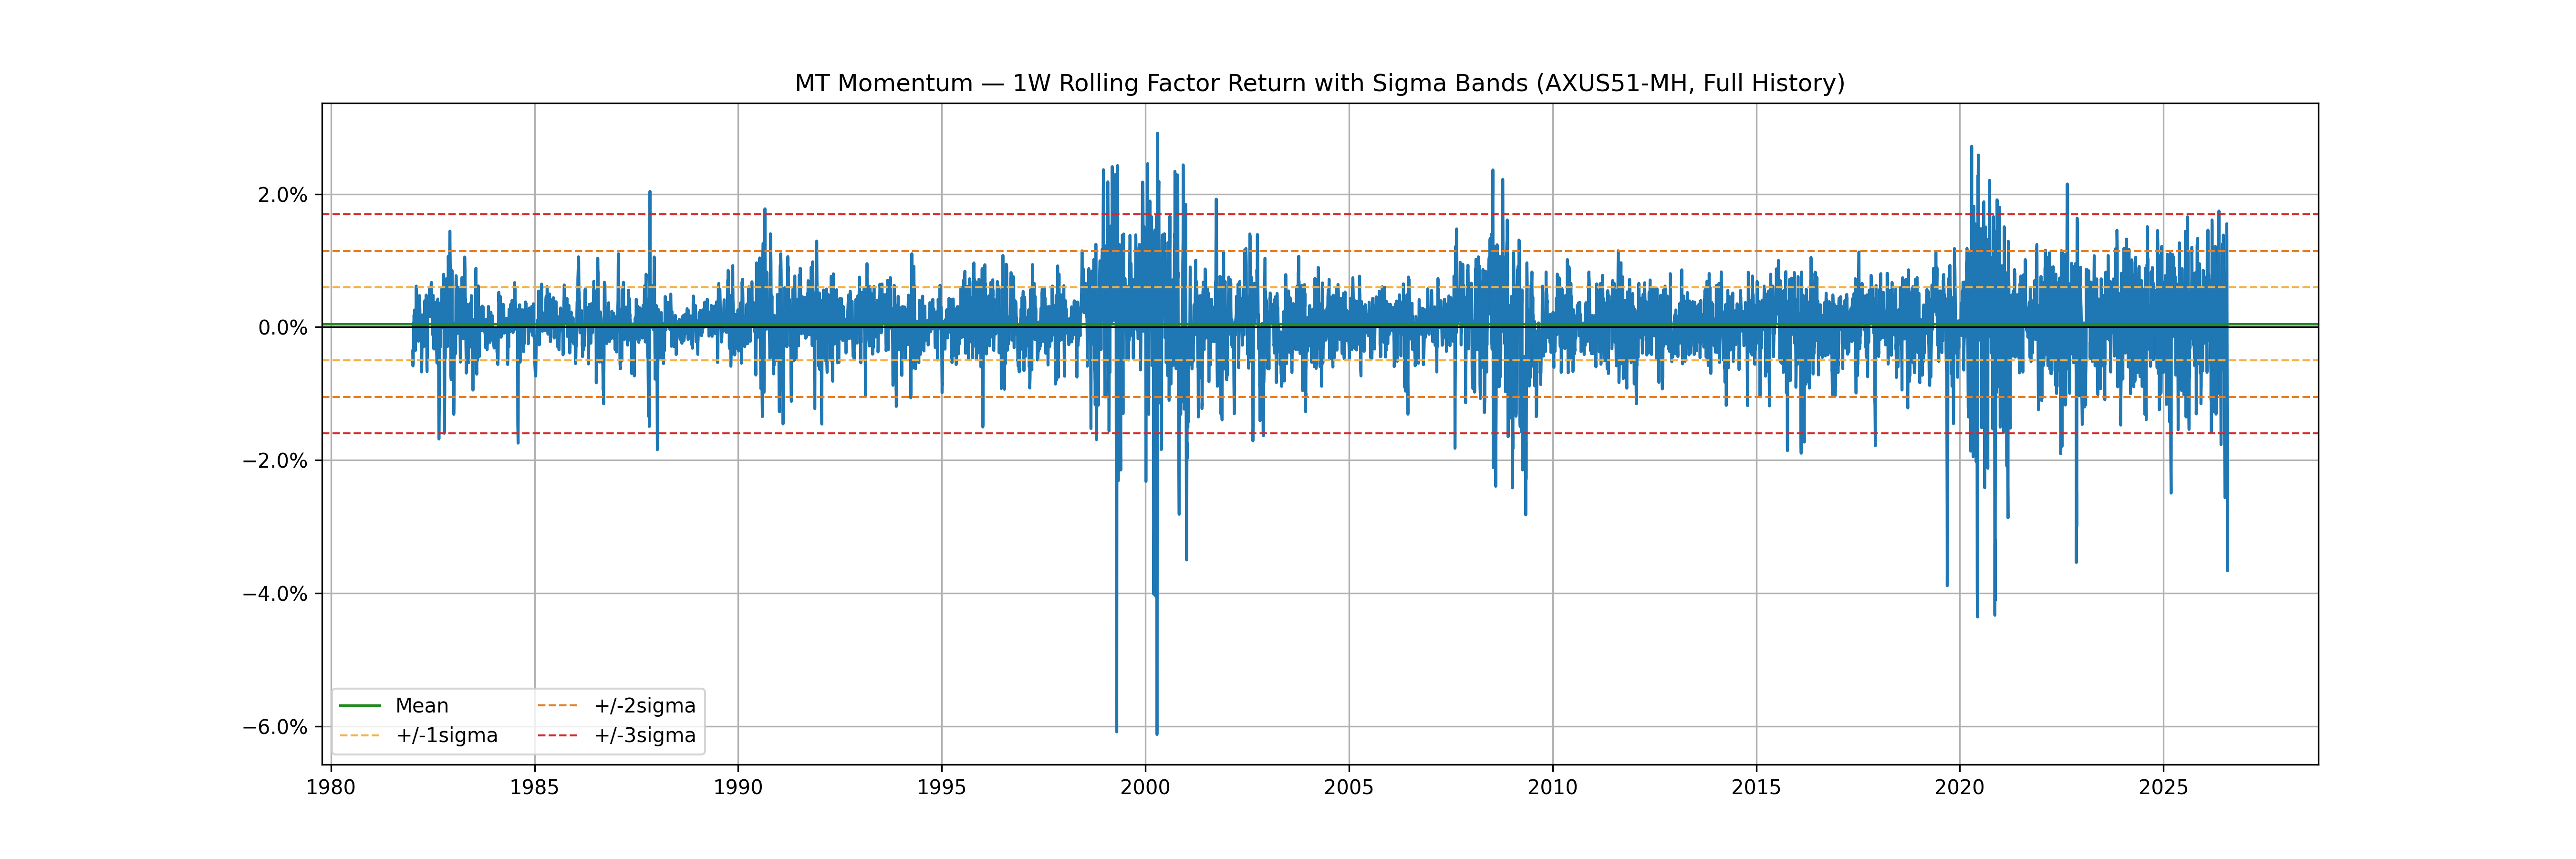
In fact, these large Medium-Term Momentum drawdowns have become more frequent since 2020.
The following chart is not included in the Equity Risk Monitors but is available on request:
…As Long as you Remain Solvent
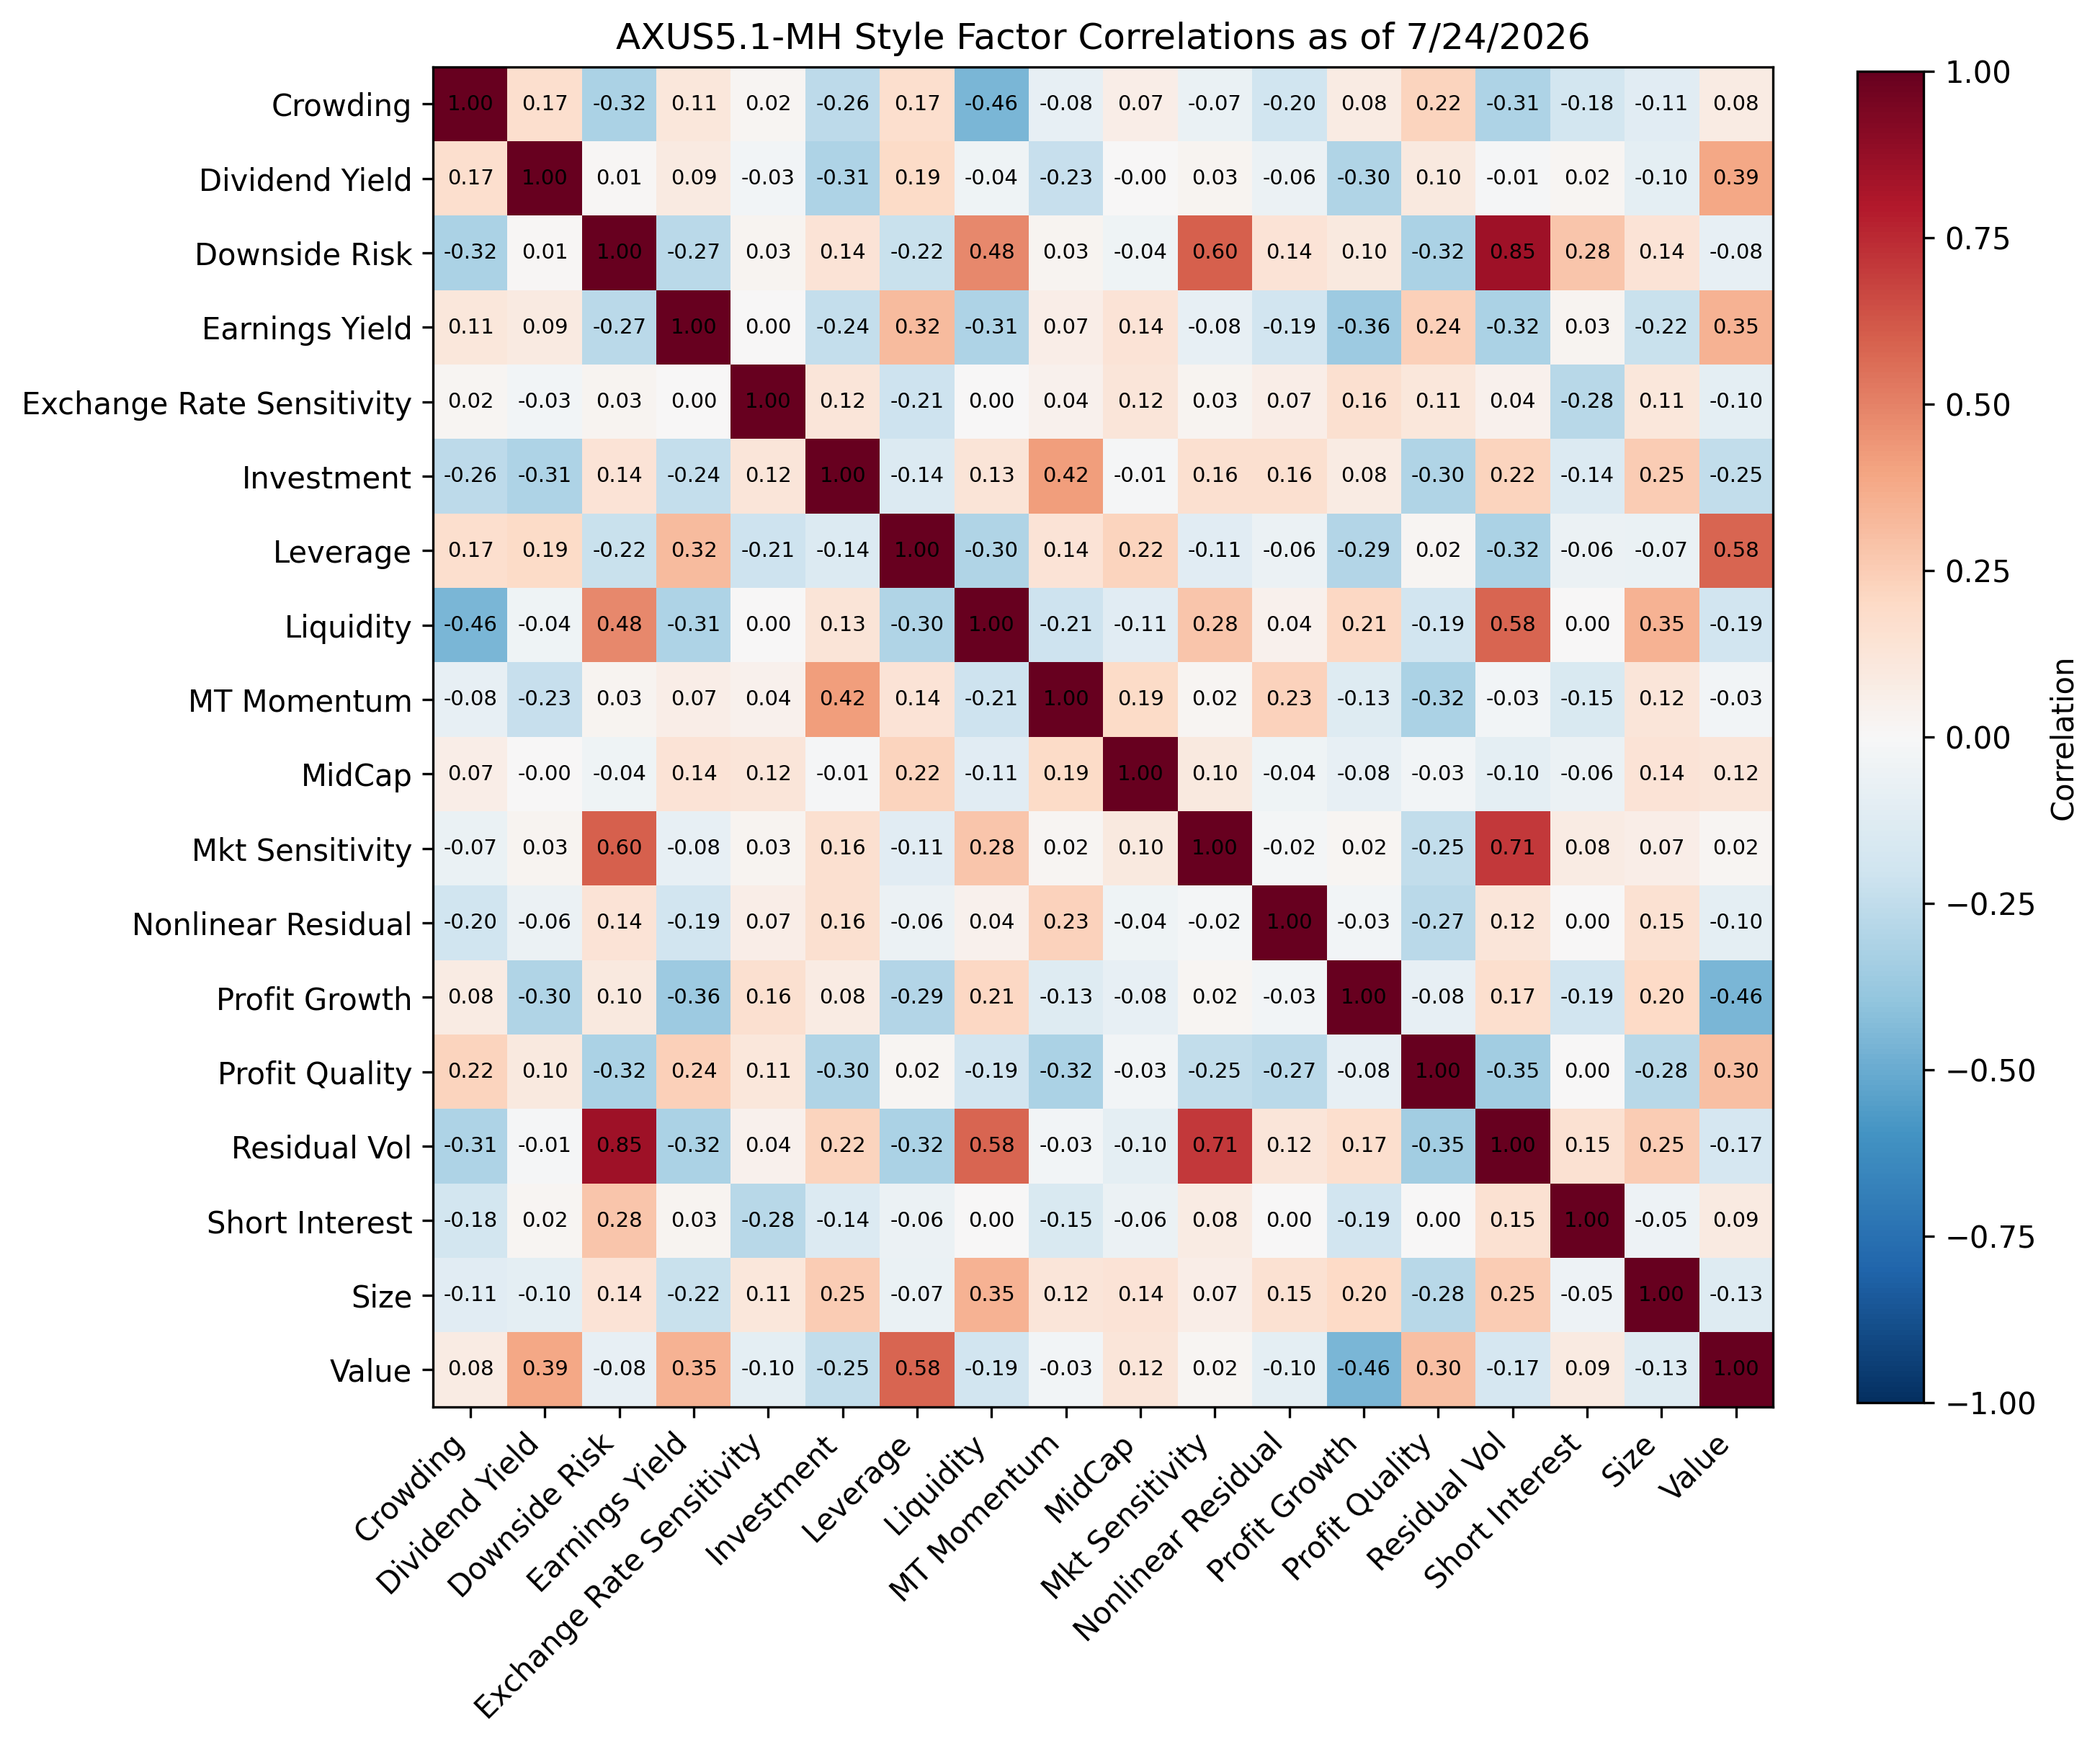
Let’s go back to the Friday, July 24th—from that vantage point, what kind of Style factor returns would we expect given a such large drawdown in Medium-Term Momentum moving forward? Taking a look at ex-ante AXUS5.1-MH Style Factor correlations on that date, we see that the factors with the most positive correlations are Investment and Nonlinear Residual, while Profit Quality has the strongest negative correlation.
The following chart is not included in the Equity Risk Monitors but is available on request:
If we look at the factor returns last week, we can see extreme returns in these factors in the directions we would expect given the model’s covariance matrix. We also see strongly positive returns in Earnings Yield and Profit Growth—which is logical if we view this sell-off as a reversal of the AI trade.
The following chart is not included in the Equity Risk Monitors but is available on request:
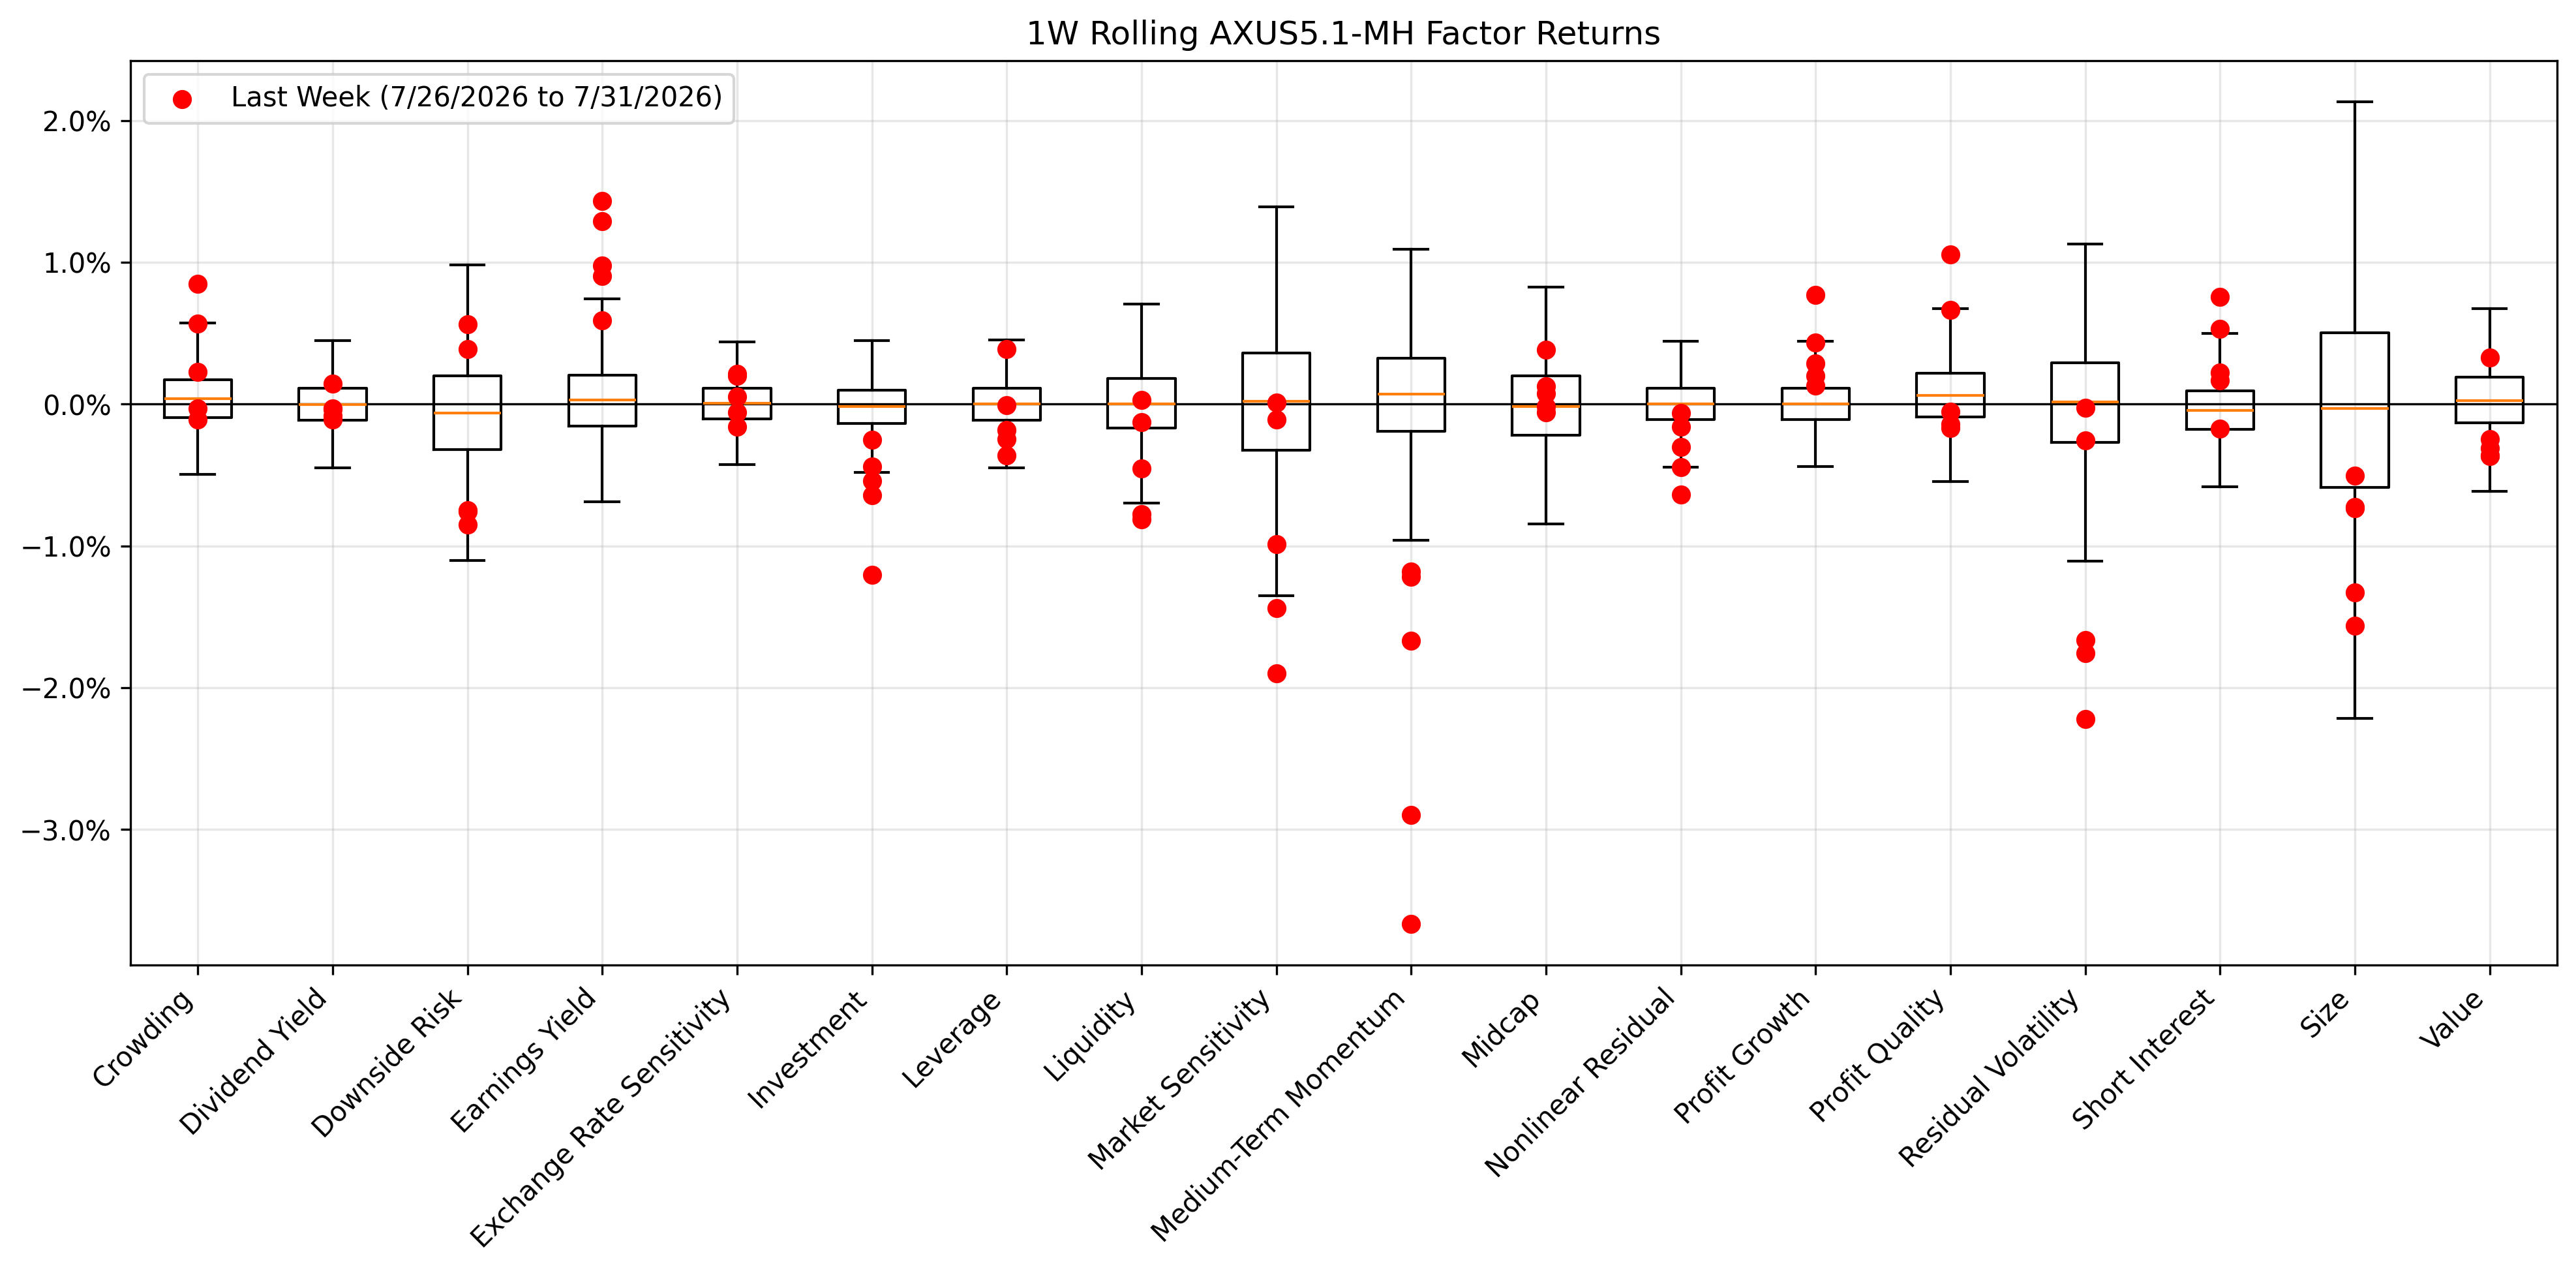
The magnitudes of the moves are shockingly large—these six factors all experienced weekly rolling returns of greater than +/-3 σ on 7/29. If we assume independent and normal distributions (I know, I know, go with me here), then the chances of seeing six readings this extreme out of the 18 style factors in the model is 0.000000000007%. Doing some additional back of the envelope math, that’s a once in ~283 billion year reading. Is this a vantablack swan event?
No, because the factors returns are not independent. They have non-zero correlation and that is what makes those fat tails, well, fat. Worried about the next extremely unlikely but seemingly inevitable market move? Consider stress testing.
"You can't get away from yourself by moving from one place to another"
Last week, the Medium-Term Momentum factor in both Developed (ex. US) and Emerging Markets experienced similar reversal. In the Emerging Markets model, we observe large movements in Volatility and Market Sensitivity as well, but Developed Markets saw more muted style factor returns.
The following chart is not included in the Equity Risk Monitors but is available on request:
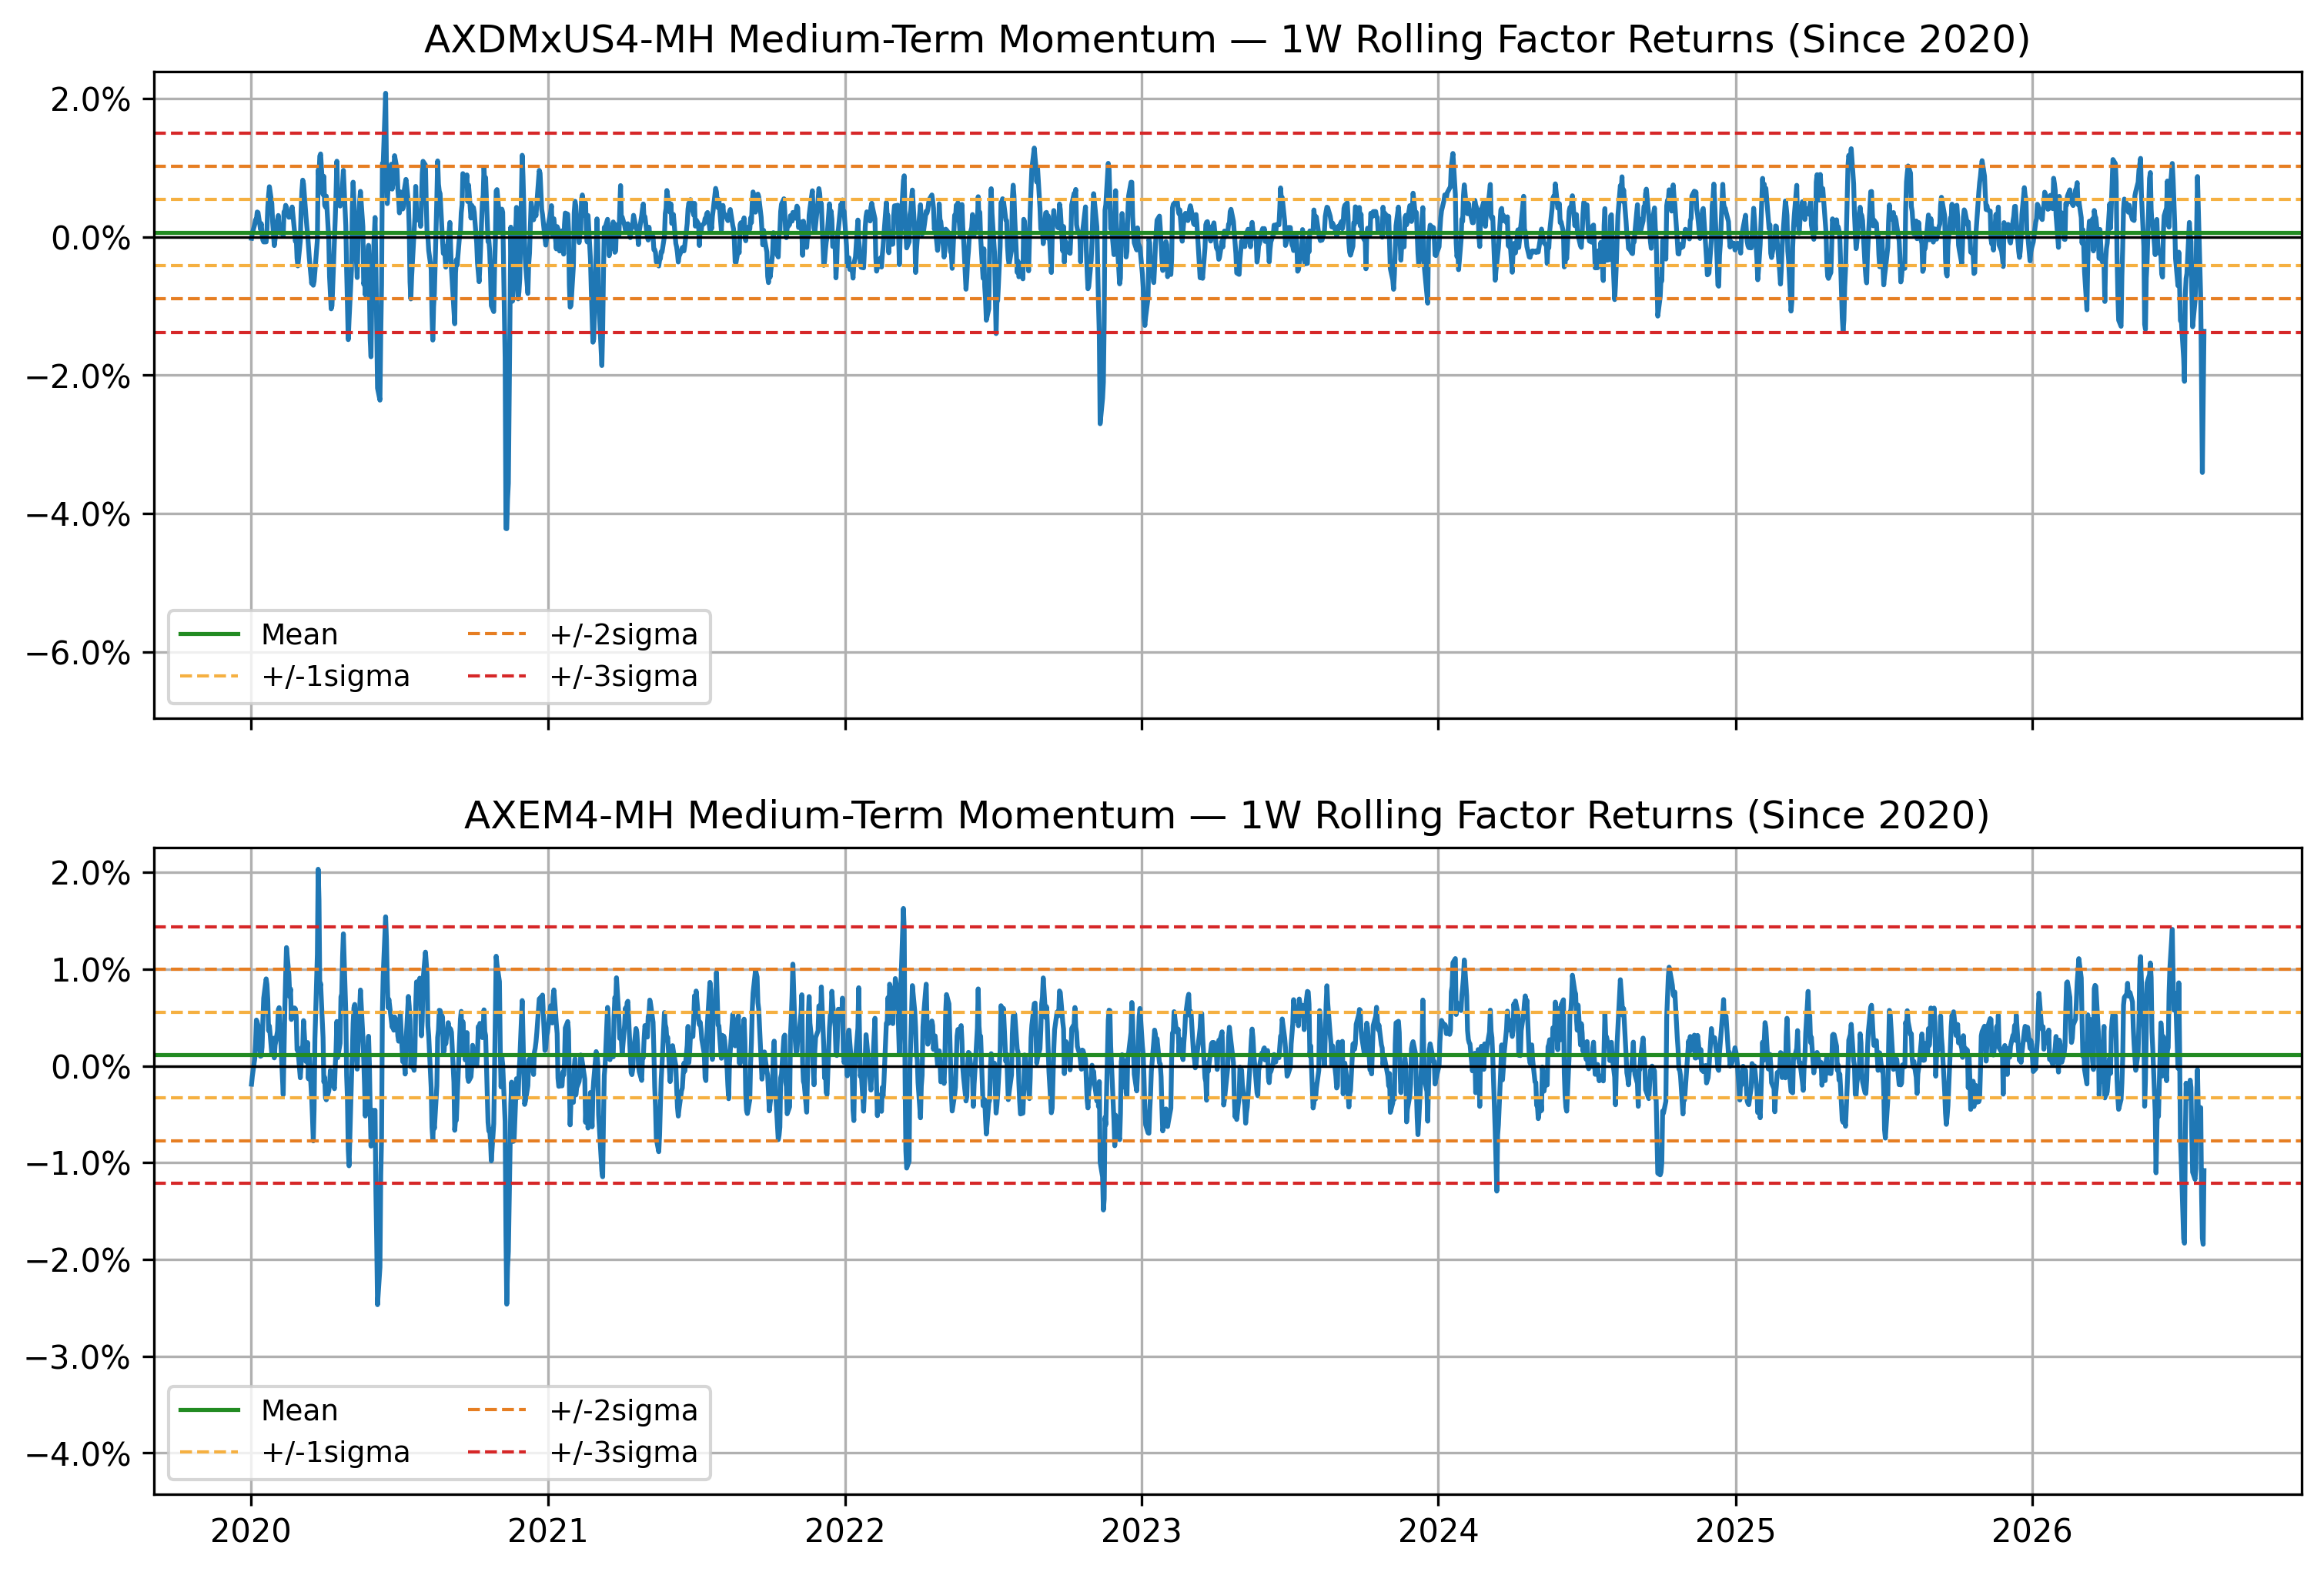
The following chart is not included in the Equity Risk Monitors but is available on request:
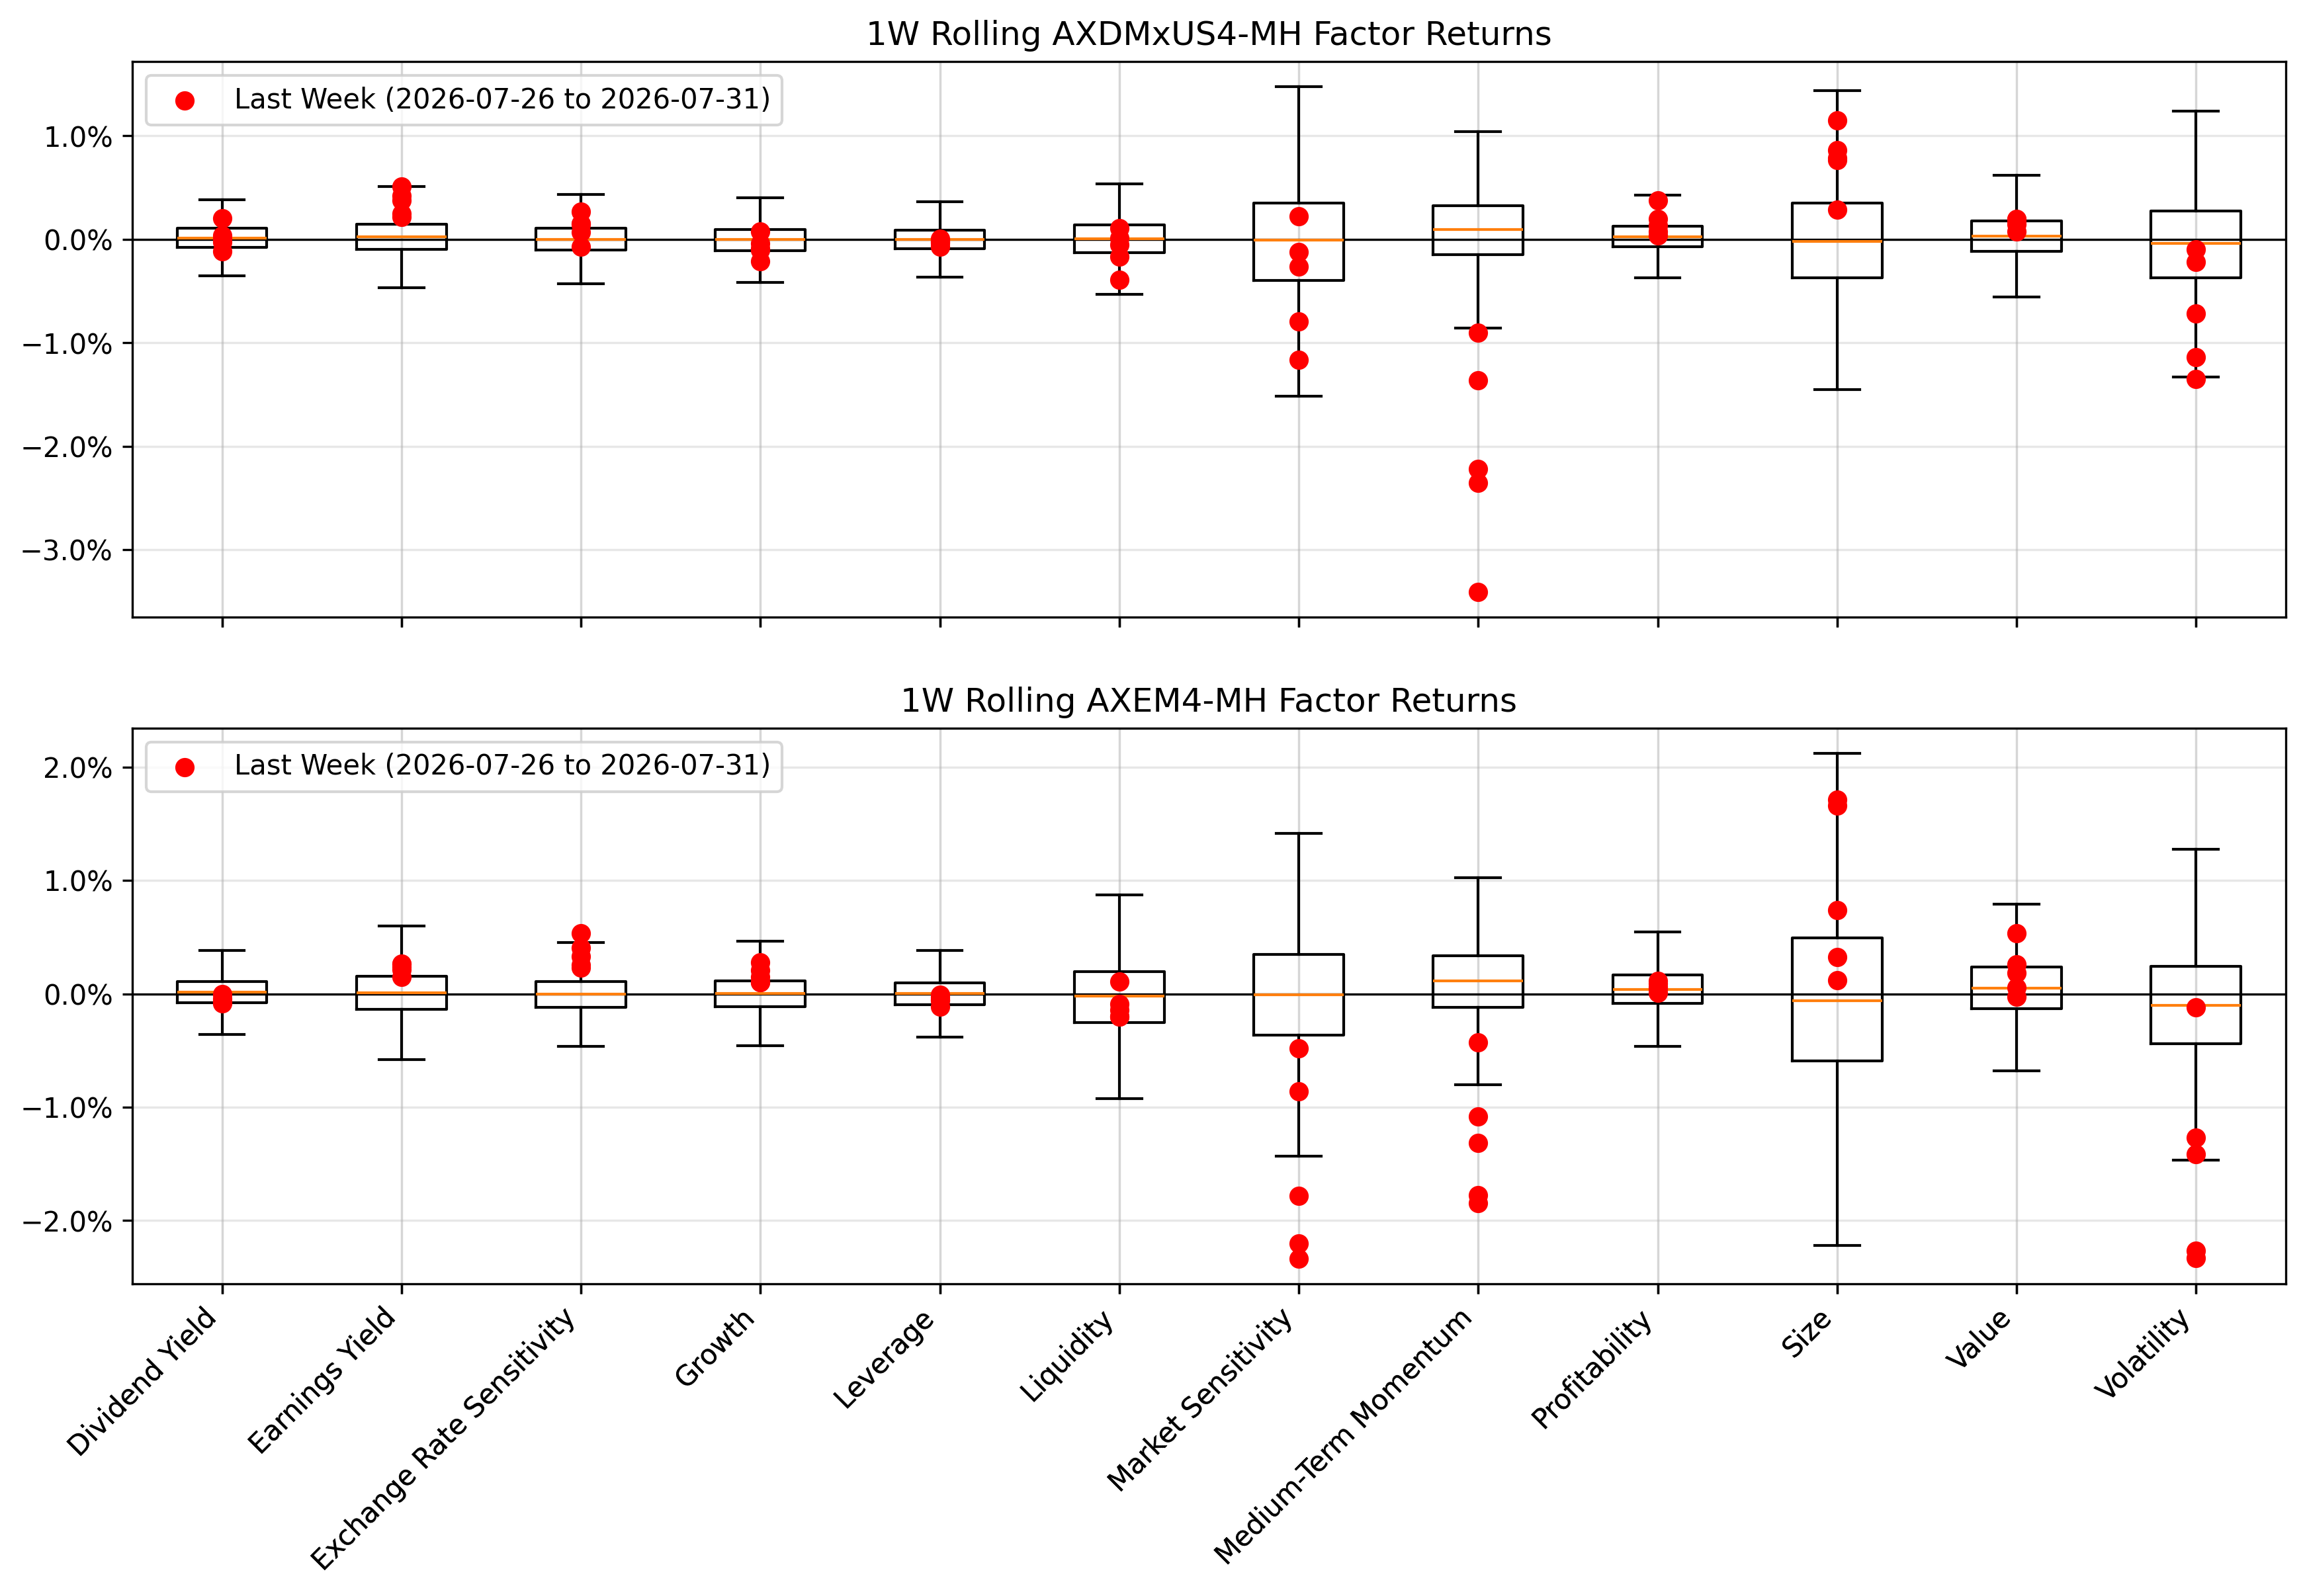
Interestingly, the Market Sensitivity and Volatility correlations to Medium-Term Momentum are negative in Emerging Markets, meaning we would expect them to move positively given the Medium-Term Momentum drawdown. That said, all the correlation magnitudes are significantly less than those found in the US model.
The following chart is not included in the Equity Risk Monitors but is available on request:
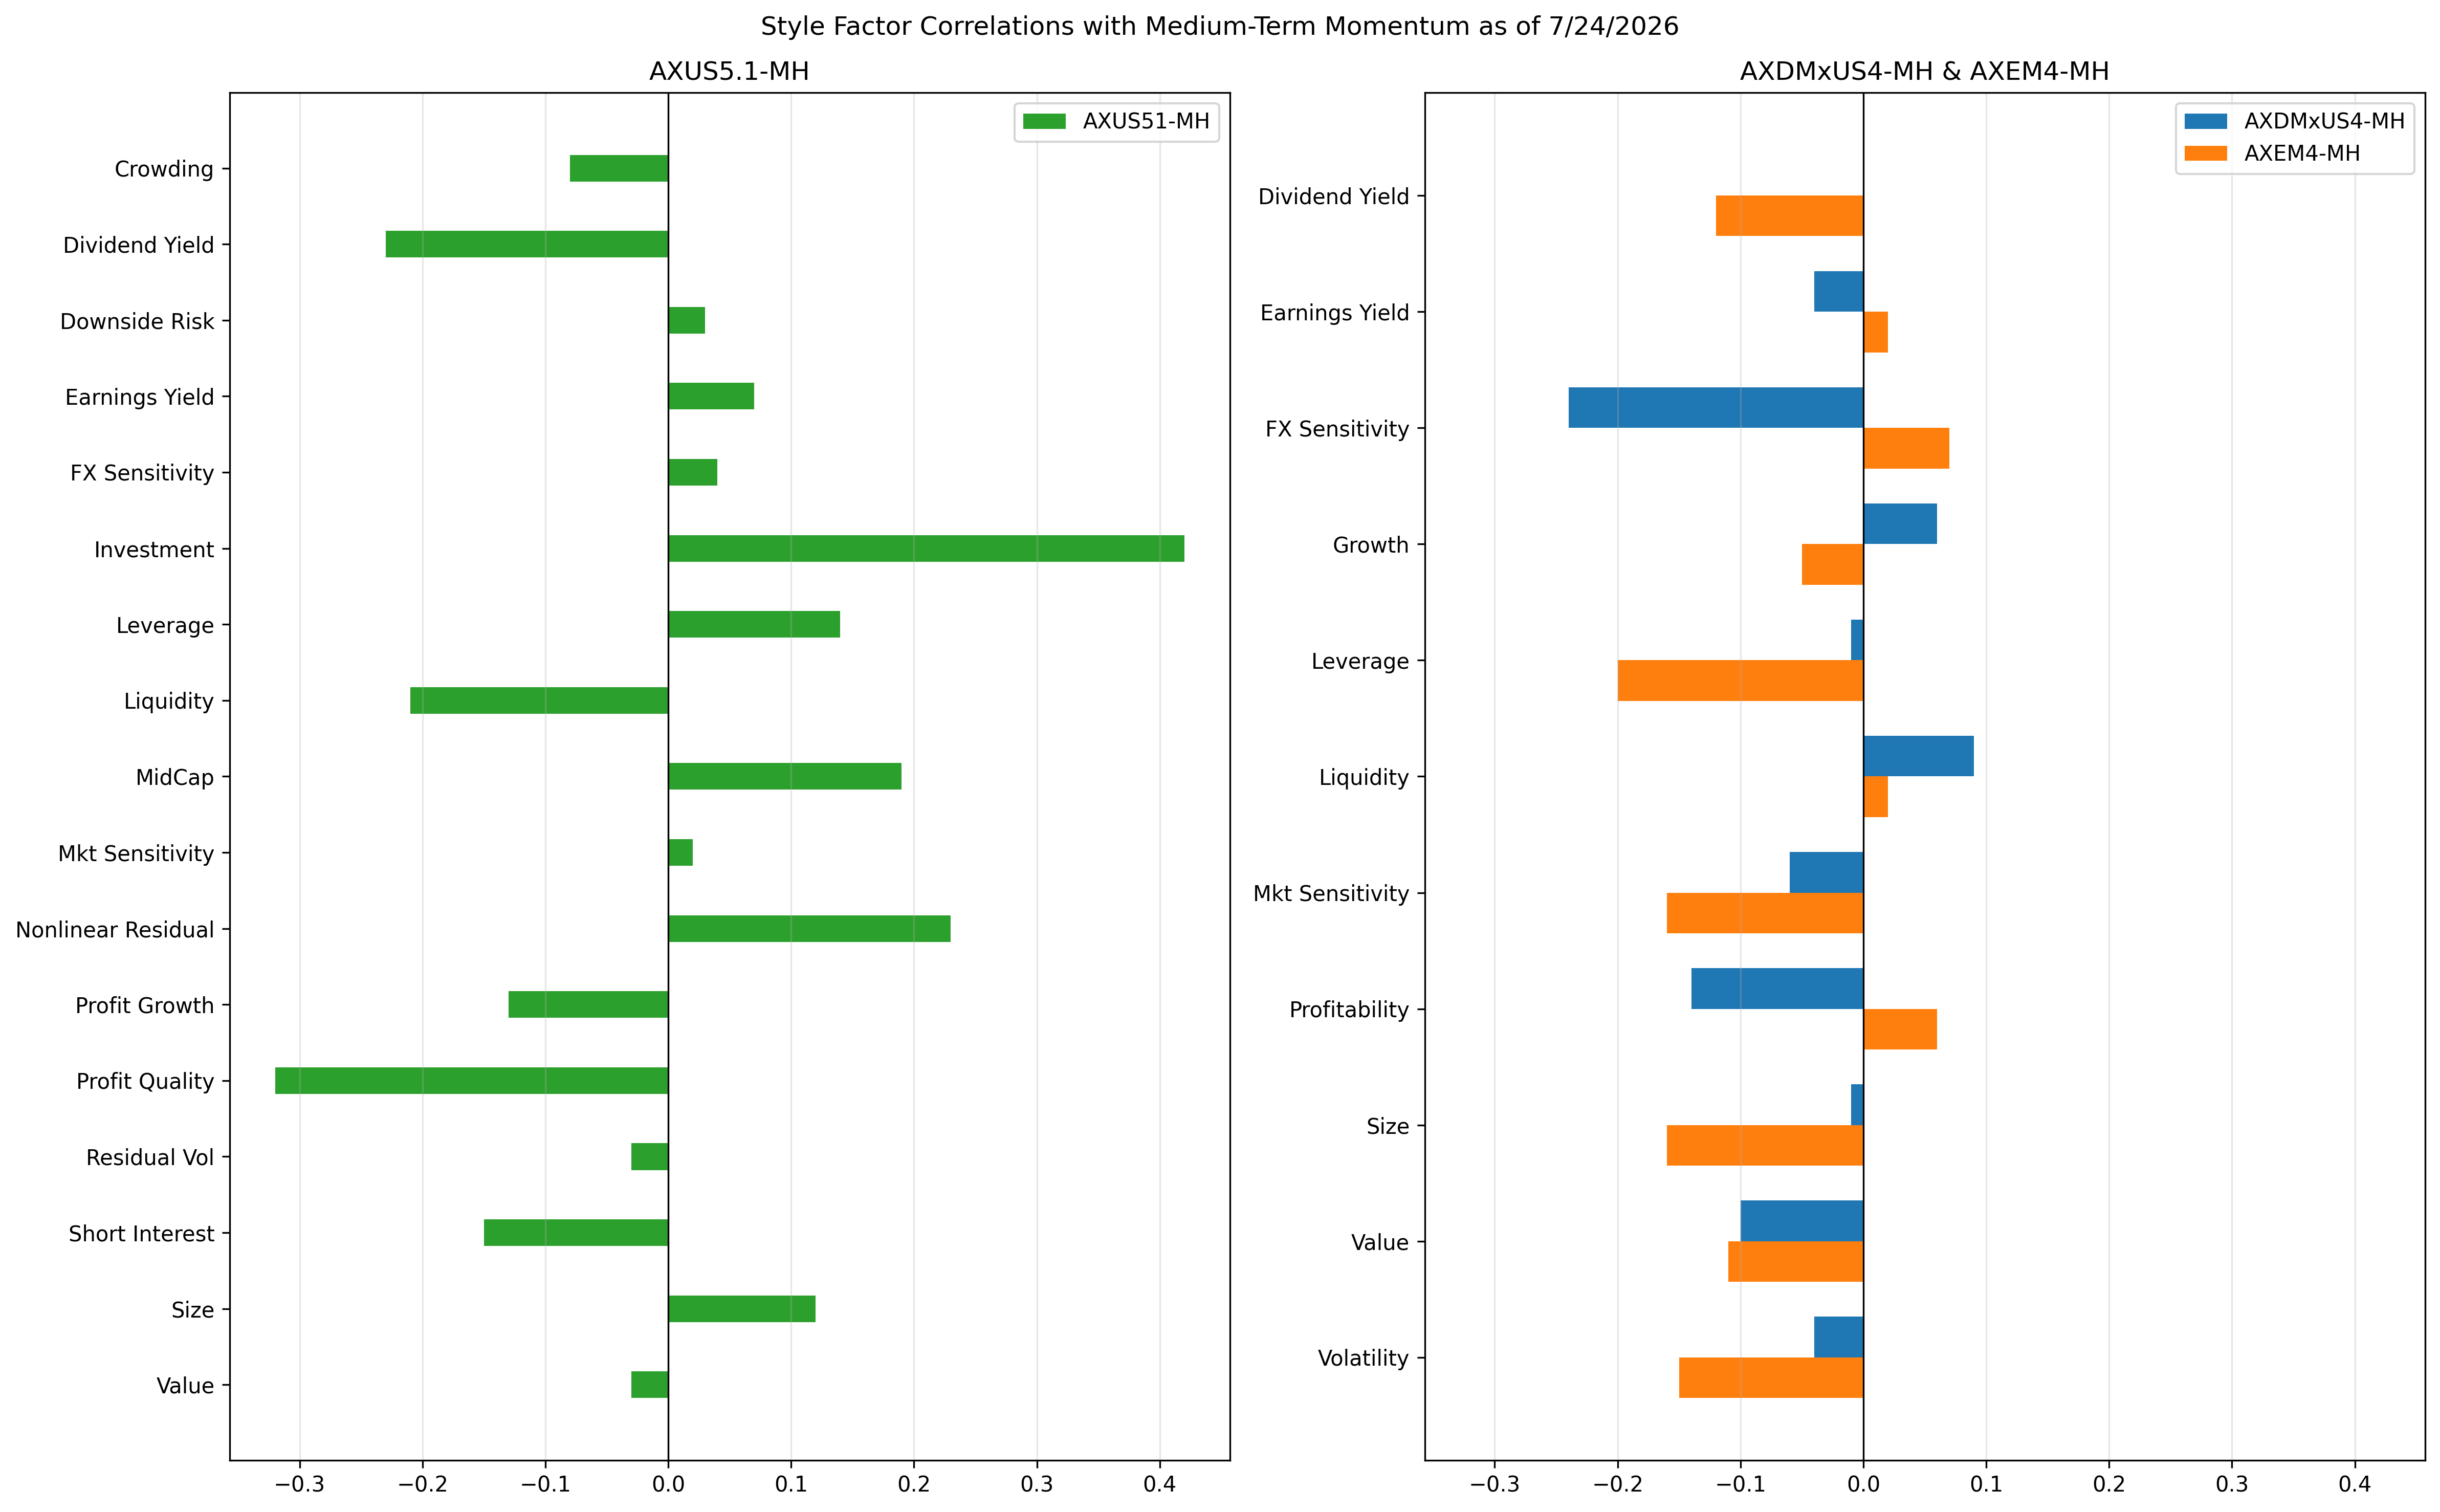
What does this mean together? Well, it’s much hard to create a narrative here compared to the fairly straight forward factor returns the US. Perhaps in Emerging Markets, the Market Sensitivity and Volatility factors are more independent from Medium-Term Momentum than the ex-ante covariance matrix indicates. We will continue to monitor this seemingly global momentum drawdown. But in general it has been our experience that when factors “go wild” it can signal a change in sentiment that ultimately leads to a change in market direction.
You may also like


