

EQUITY RISK MONITOR HIGHLIGHTS
WEEK ENDED AUGUST 14, 2026
Axioma Risk Monitor: Why the US market risk looks calm despite rising volatility; Record Industry Risk hidden inside the Russell 1000; Style Risk is also heating up beneath the surface
Why the US market risk looks calm despite rising volatility
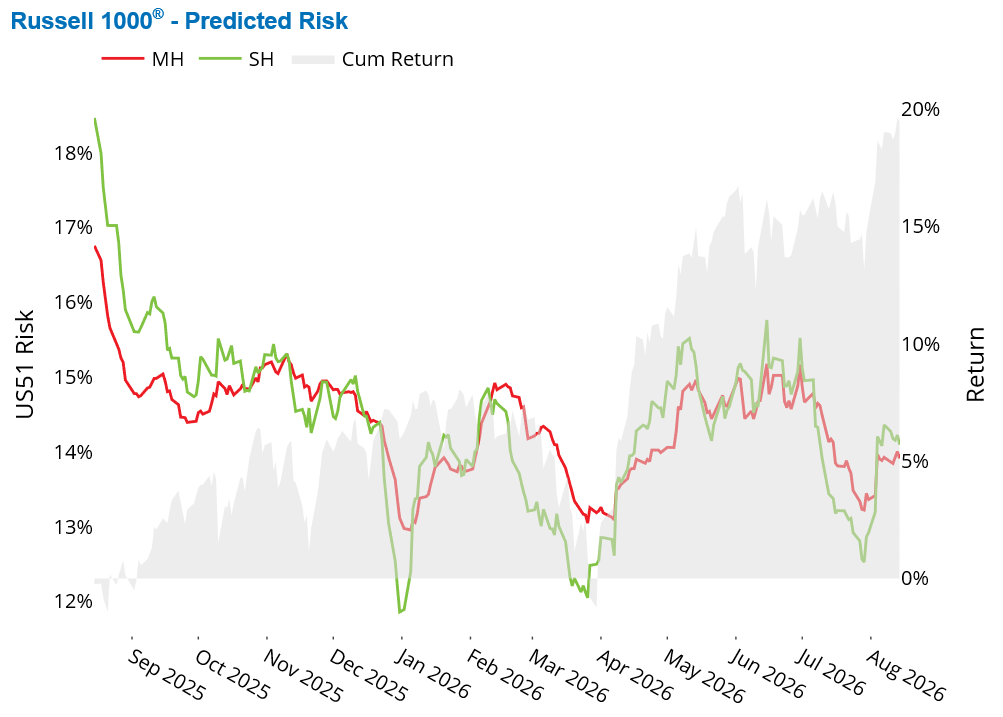
As US equity indices continued to notch fresh record highs in what seems to be a highly volatile environment, benchmark risk remained surprisingly subdued. The Russell 1000's predicted risk did rise in August, increasing by roughly 120 basis points, but it still sits only about 50 basis points above its long-term median, according to the Axioma US51 Fundamental Short-Horizon Model.
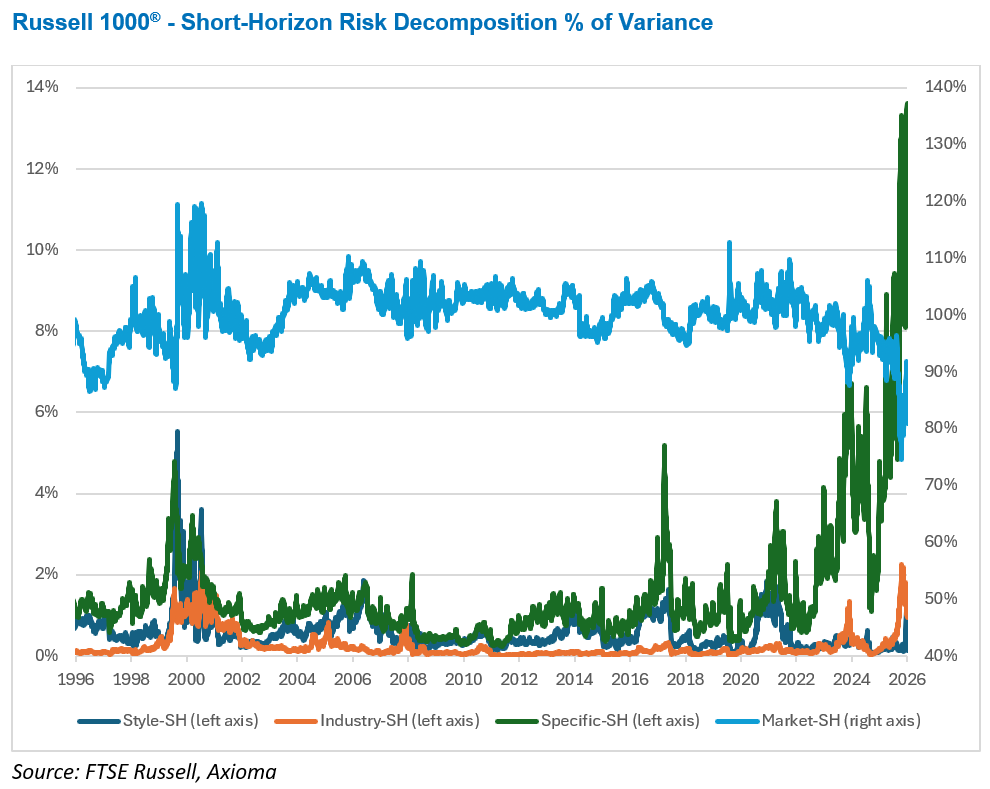
At the index level, risk is primarily a reflection of the Market Risk component, which accounts for 81% of the Russell 1000's variance. That is hardly surprising, as the benchmark effectively represents the US equity market itself. Market Risk has edged higher this year, rising about 10%, yet it remains slightly below its long-term median of 13%.
The market factor's share of variance, however, has fallen to levels never seen before this year — well below where it stood at the height of the dot-com bubble, through the Global Financial Crisis and in the COVID crash, when it accounted for essentially all of index variance.
In contrast, Specific Risk has surged. It has nearly doubled since the start of the year and now represents 12% of the Russell 1000's variance, compared with a long-term average of just 1.5%. While specific risk remains a relatively small contributor to overall benchmark risk, its share of variance reached a record high on Monday and is likely to be impacting active risk more than usual.
Industry factors tell a similarly intriguing story. Despite individual industry factor risk soaring, the industry block contributes about 1% of total index variance, and that is due to diversification, as we will see in the next section below. Meanwhile, style factors in aggregate are contributing 0.14% of the Russell 1000 variance. (Note that these are not covariance-distributed risk contributions; therefore, the market, industry, style, and specific components do not sum to 100%, with the factor covariance term accounting for the remaining 5.5%.)
See chart from the Russell 1000 Equity Risk Monitor as of August 14, 2026:
The chart below is not included in the Equity Risk Monitors but is available upon request:
Record Industry Risk hidden inside the Russell 1000
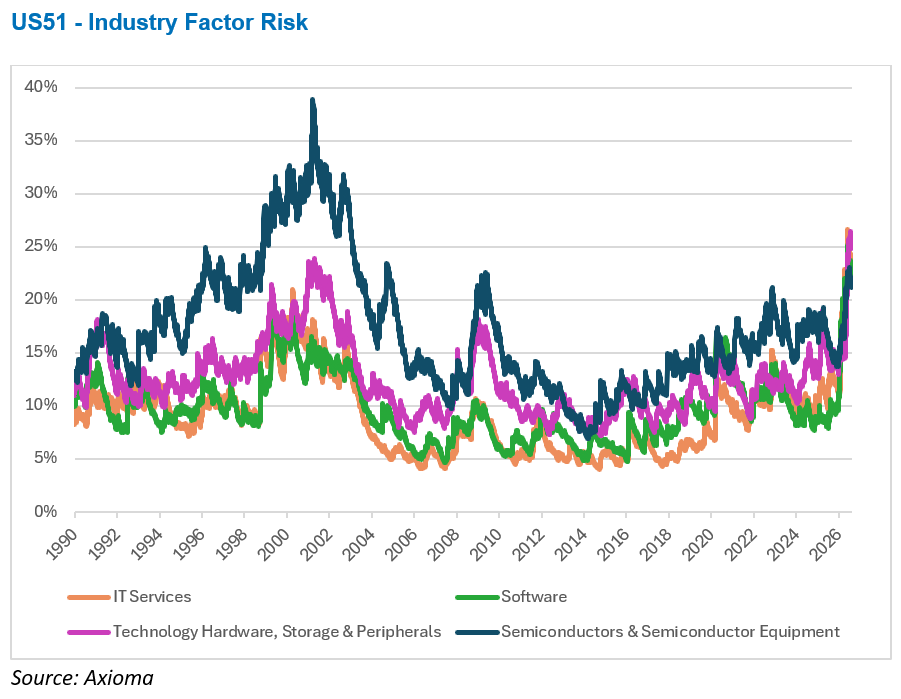
Industry Risk has doubled in the Russell 1000 since the start of the year, with every one of the 74 industry factors in the Axioma US51 Fundamental Short-Horizon Model recording higher volatility. The median year-to-date increase across all industries exceeds 35%.
Earlier this year, three industry factors reached their highest volatility levels in the model's history: IT Services, Software, and Technology Hardware, Storage & Peripherals. Although volatility has moderated somewhat since then, all three remain more volatile today than they were during either the dot-com bubble or the Global Financial Crisis.
Surprisingly, Semiconductors, often viewed as the epicenter of the AI boom, is not leading the volatility rankings. The industry factor currently ranks only 14th (of 74) in risk, although it did hit a 22-year high in early July. At the same time, Semiconductors’ volatility increase this year has been roughly half that of the three technology industries mentioned earlier.
The pattern suggests that the greatest turbulence has shifted beyond the chipmakers and toward the industries building and deploying AI infrastructure. Supporting that view, the Independent Power & Renewable Electricity Producers industry has reached its highest volatility since August 2009, while Construction & Engineering has risen to levels not seen since May 2009. Both industries sit at the center of the electricity generation and data center expansion required to support AI adoption.
Very little of this shows up in benchmark risk. Correlation is the key reason. Industry factors’ contribution to the aggregate Industry Risk offset one another. Zero out the off-diagonals and the index's Industry standalone volatility would be 4.98% while with the actual correlation matrix it is 1.44%. That is, were the industries uncorrelated the index's industry risk would be more than three times its actual level.
Interestingly, 55 of the 74 industry factors now move inversely to the Market Intercept factor, with the largest negative correlations recorded by defensive industries such as Food Products, Tobacco, and Beverages. However, the impact of these 55 negative correlations with Market Factor is outweighed by the large positive exposures the Russell 1000 has to two industries positively correlated with the Market Intercept: Semiconductors & Semiconductor Equipment and Technology Hardware, Storage & Peripherals.
For benchmark investors, these near-record levels of industry volatility are largely invisible because industry factors contribute 1.04% to the Russell 1000's variance. For active investors, however, the picture may look very different. The risks reshaping the US market are increasingly taking place beneath the surface.
The chart below is not included in the Equity Risk Monitors but is available upon request:
Style Risk is also heating up beneath the surface
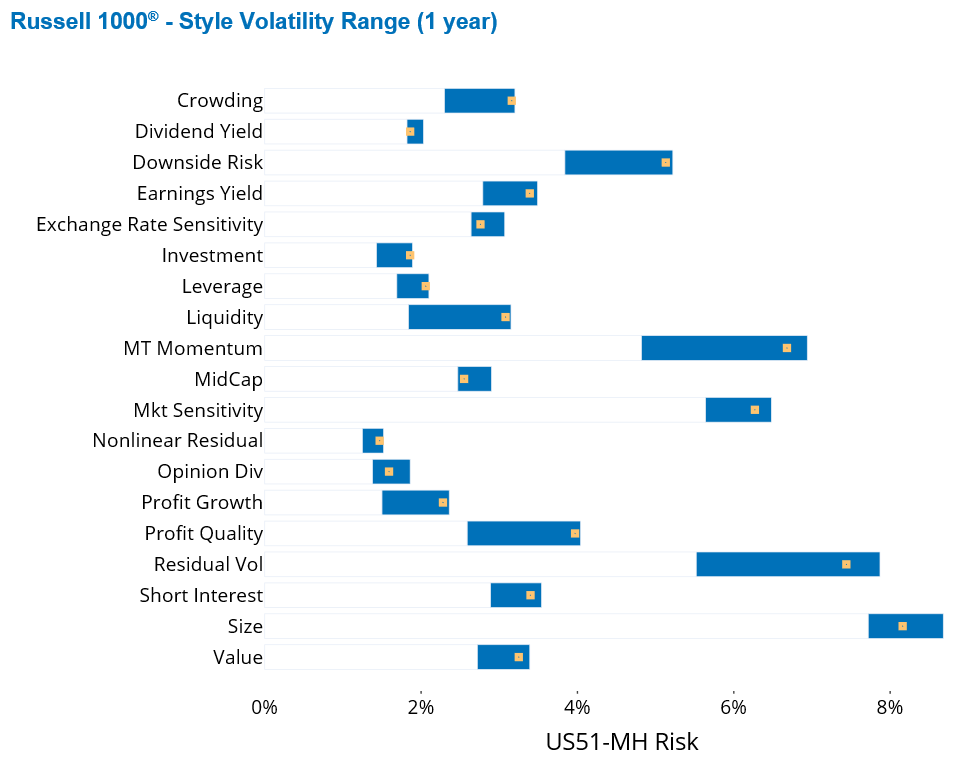
Eighteen of the 20 style factors in the Axioma US51 Fundamental Short-Horizon Model are more volatile today than they were at the beginning of the year, with a median increase of roughly 20%. Yet the rise has been far from uniform.
Short- and Medium-Term Momentum, Profit Growth, and Profit Quality have experienced the sharpest increases, with risk in each rising by more than 50% year to date. The latter three now rank within the top decile of their historical volatility ranges, while Profit Growth has reached its highest volatility level in a quarter century in early July.
As expected, the style factors most closely linked to overall market direction are Market Sensitivity, Residual Volatility, and Downside Risk. Each exhibits a stronger positive correlation with the Market Intercept factor than any industry factor in the model. At the opposite end of the spectrum sit Profit Quality and Short-Term Momentum, which show the most negative correlations to the market factor among style factors, while most other style factors cluster closer to zero.
Despite these developments, almost none of the increased style volatility reaches the Russell 1000 itself. Style factors are intentionally constructed so that a broad capitalization-weighted market portfolio is approximately style neutral, and the benchmark remains close enough to that theoretical portfolio to carry very limited style exposure.
As a result, rising style volatility has little impact on passive benchmark investors. The consequences fall primarily on active portfolios, where style exposures are intentional, concentrated, and increasingly important to portfolio risk. In other words, while benchmark risk appears calm, active managers are navigating a much more dynamic style landscape.
See chart from the Russell 1000 Equity Risk Monitor as of August 14, 2026:
You may also like


