
EQUITY RISK MONITOR HIGHLIGHTS
WEEK ENDED OCTOBER 2, 2026
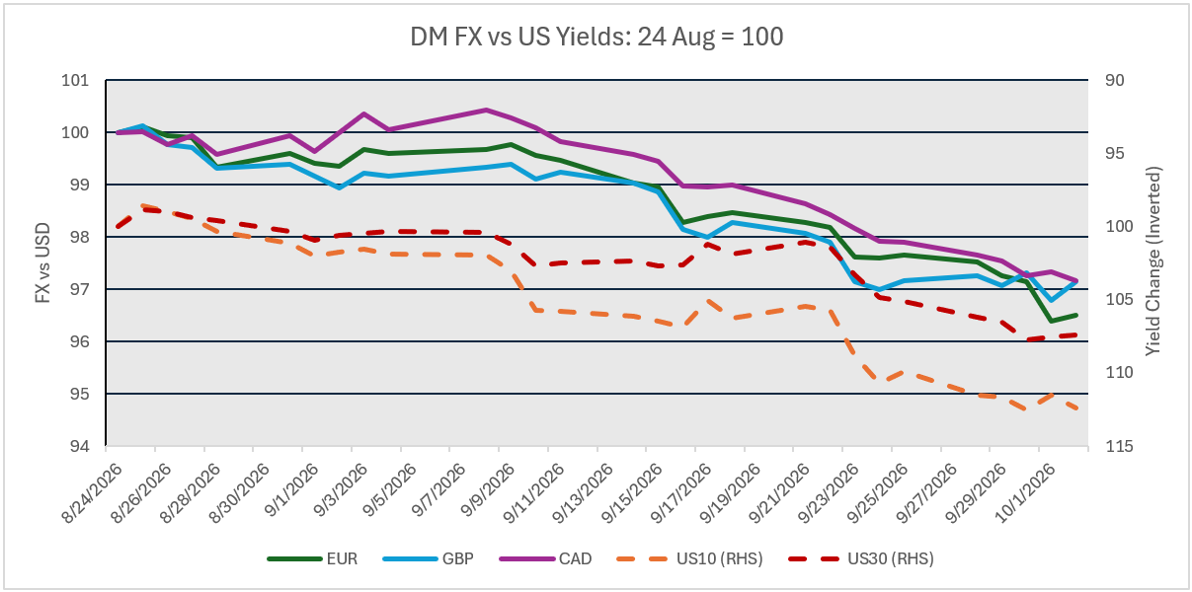
The week ended October 2 saw dramatic drops in developed markets currencies relative to USD, continuing a trend that started in late August and has followed US bond yields as they move higher. EUR, CAD, and GBP have dropped 3.5%, 2.9%, and 2.8% respectively since the 24th of August. In the same time, the US 10-year yield has increased by 12.4% from 4.7% to 5.28% and the 30-year went from 5.23% to 5.6% (a 7% change) in one of the most dramatic yield curve steepenings in recent memory:
This chart is not in the Equity Risk Monitors but is available upon request:
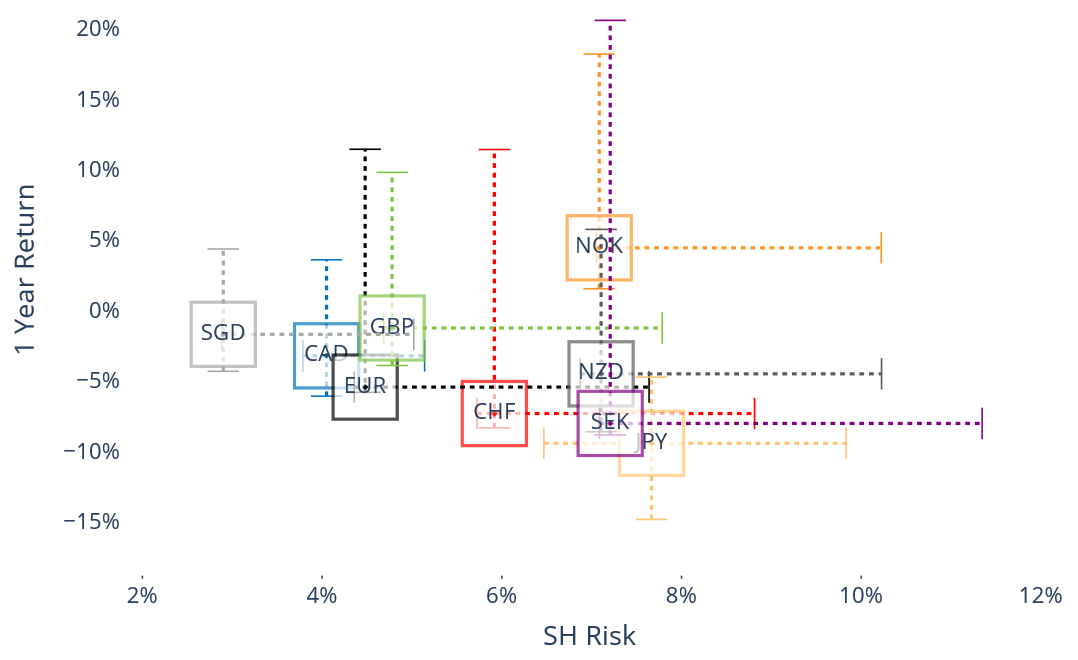
While the currencies are at the bottoms of there 12-month ranges relative to USD, they are at the lower end of their forecast volatilities:
See chart 6, Currency Risk and Return vs. USD, International Developed Markets Risk Monitor, October 2, 2026:
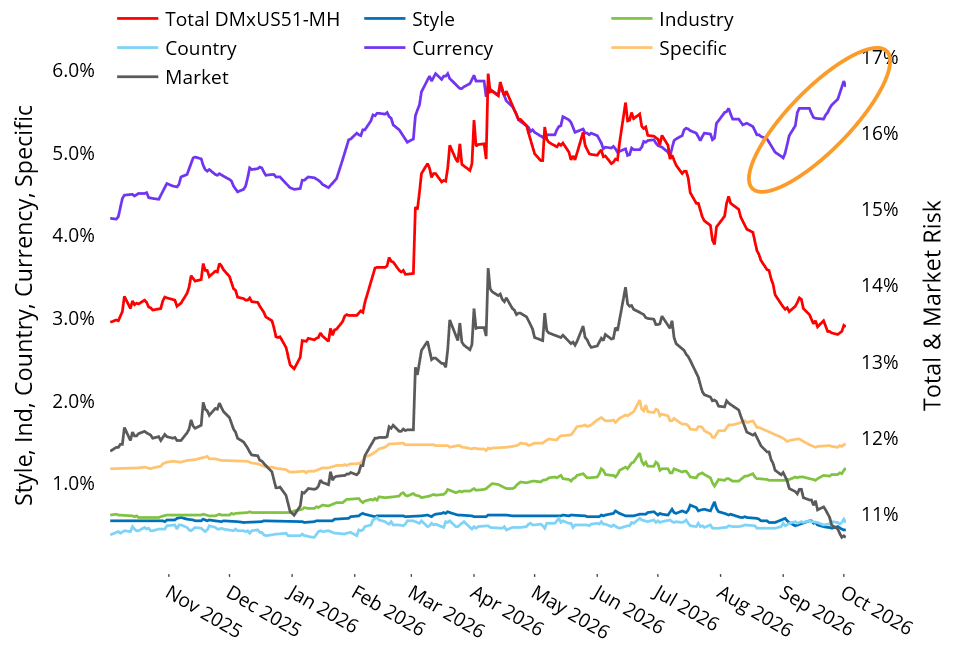
Currency risk has been rising as a proportion of the total risk of the STOXX International Developed Markets from just under 5% at the end of September to just under 6% now:
See Chart 8, STOXX International Developed Markets Components of Risk, October 2, 2026:
Our new DMxUS5.1 models show risk in the international developed markets (ex-US) rising, particularly in the short term variants as the index has lost about 3% since the beginning of September:
See Chart 7, STOXX International Developed Markets-Predicted Risk, October 2, 2026
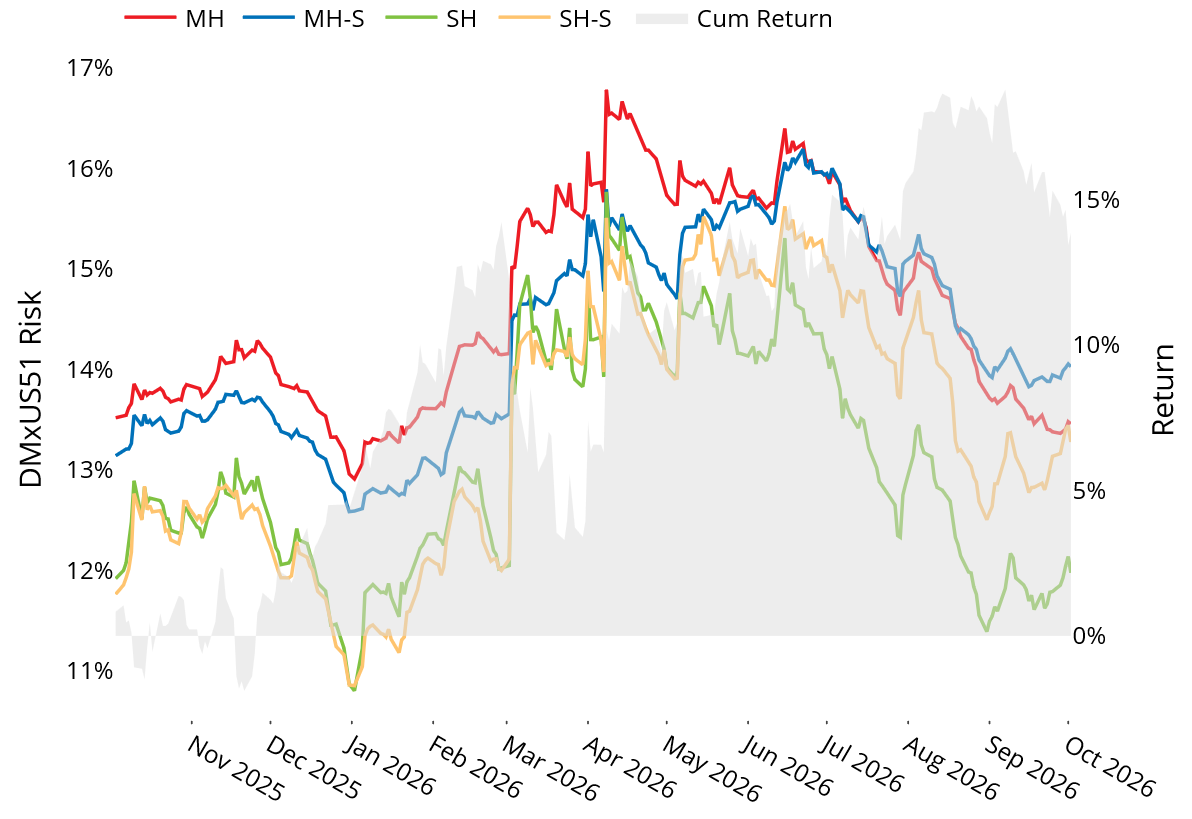
While levels of forecast volatility are not yet approaching where they were at the apogee of Persian Gulf hostilities in April, the downward trend appears to be reversing.
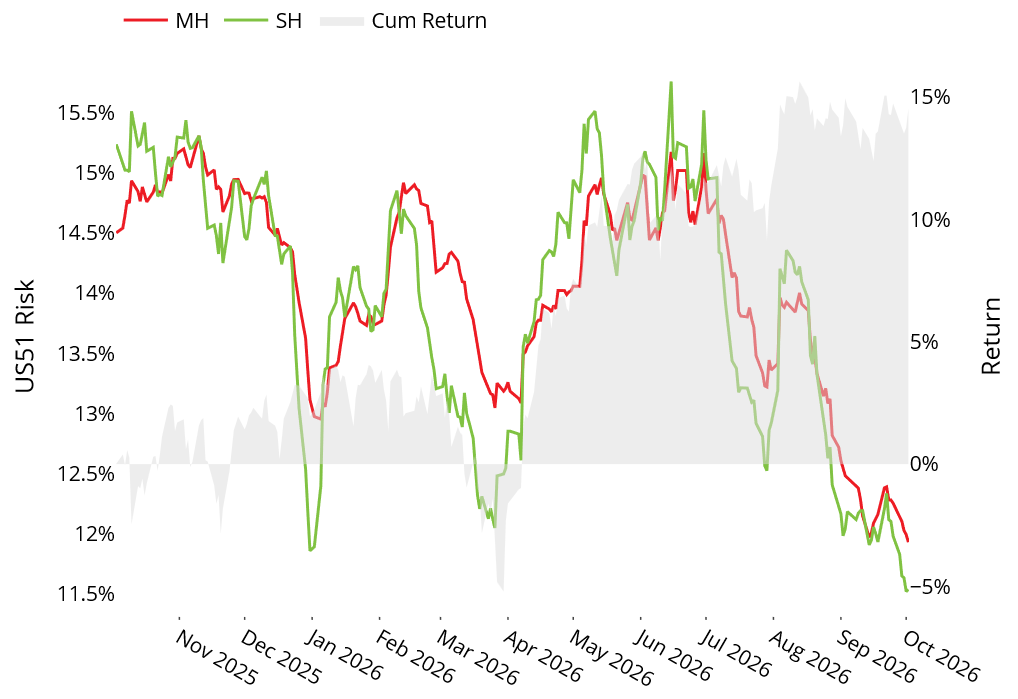
Meanwhile, in the United States, a flat-ish month of September returns-wise continues to drop forecast volatility to uncannily low levels in the Russell 1000 large cap index:
See Chart 7, Russell 1000 Predicted Risk, October 2. 2026:
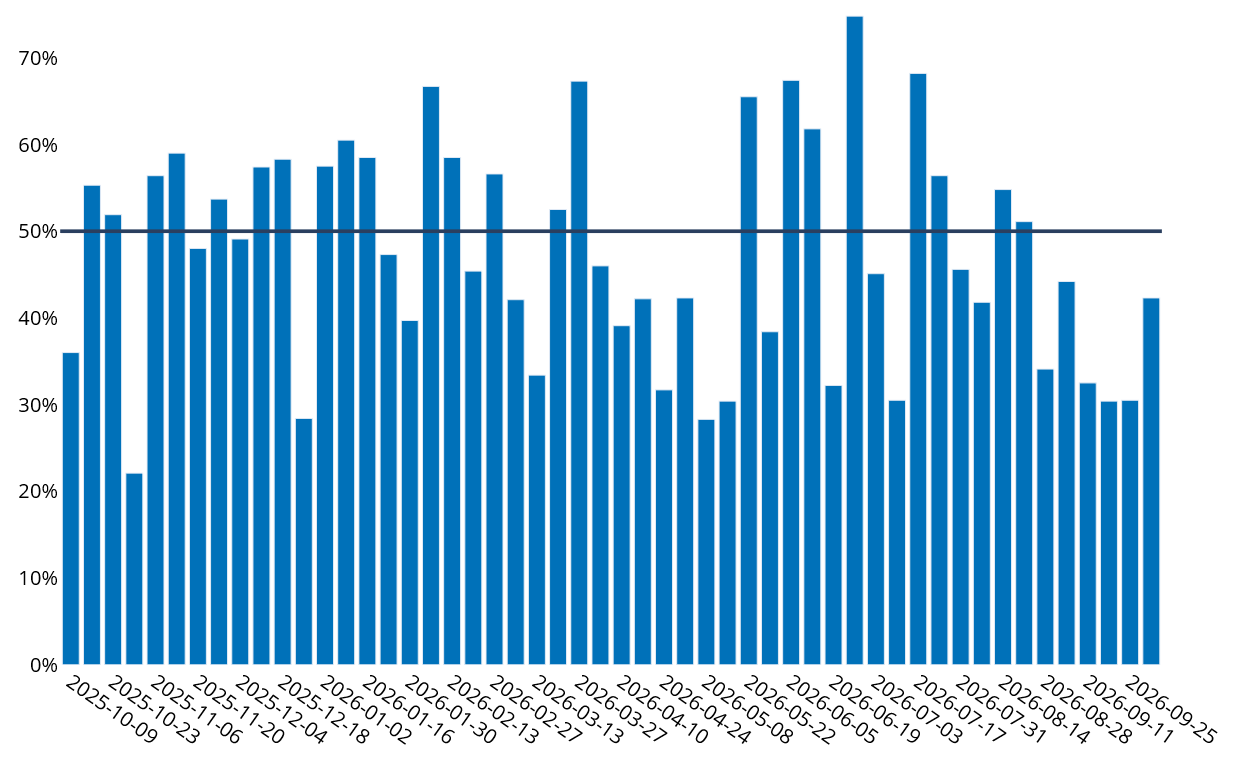
In addition, the breadth in the US markets has been poor- it improved a bit last week but still points to an index dominated by a small cohort of large stocks:
See chart 24, Weekly Asset Return Proportion Ahead of Index, October 2, 2026
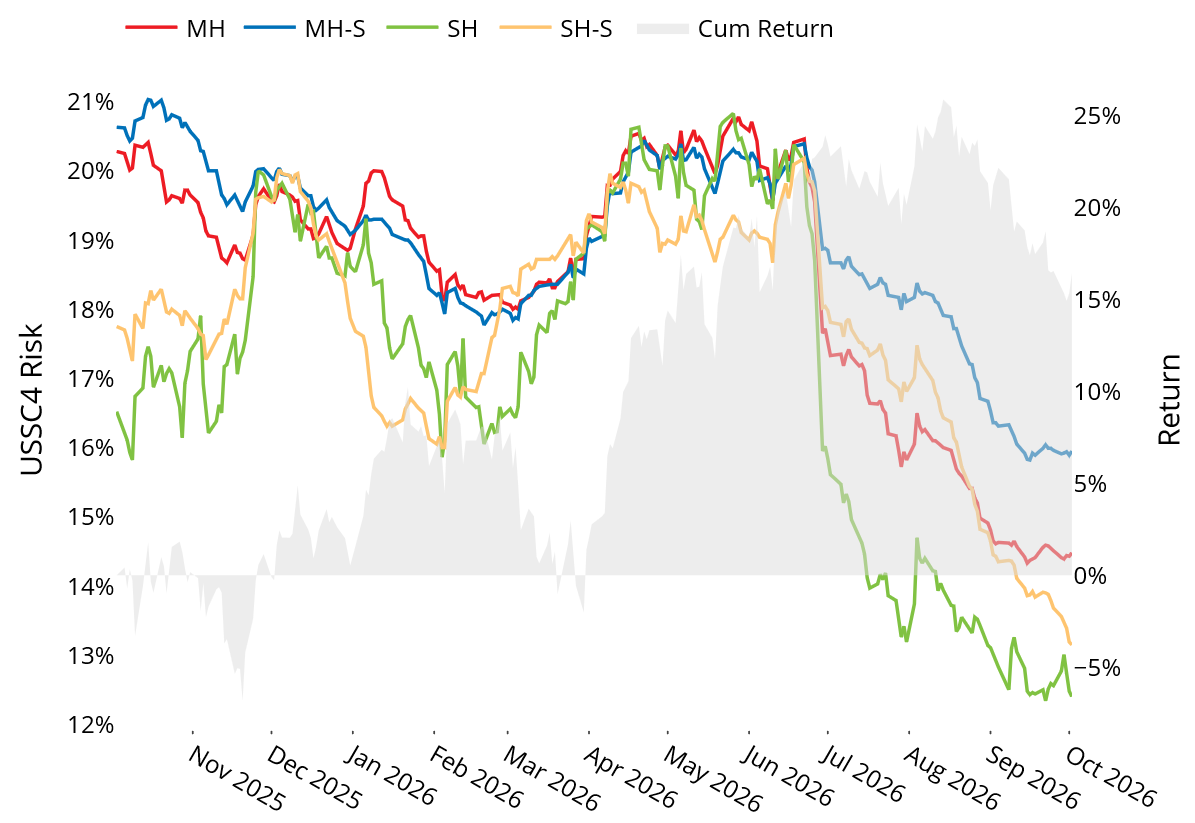
The Russell 2000 index of small-cap companies has not fared so well since the run-up in long rates began, falling about 7.5% since mid-August and 4% since September 1. However, volatility forecasts continue to fall for that index as well despite the drawdowns:
See Chart 7, Russell 2000 Predicted Risk, October 2, 2026:
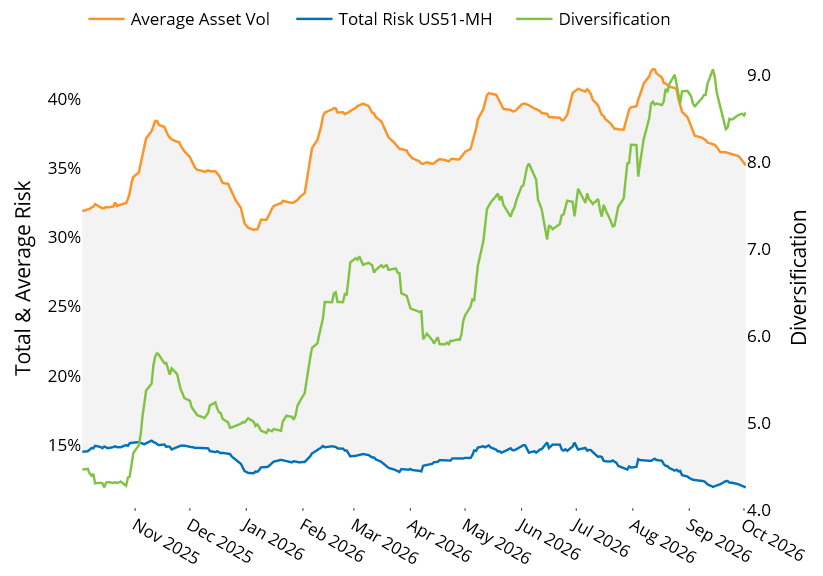
Both the Russell 1000 and 2000 indices appear “diversified” but one is, and the other isn’t- While both have high “Diversification Ratios”, the Russell 1000 has 59.5% of its forecast risk in just 10 stocks at the top of the index which make up 36% of the weight, while to get to a similar fraction of total risk in the Russell 2000, you would need to account for the top 418 stocks in the index, which, appropriately, make up 61% of the index.
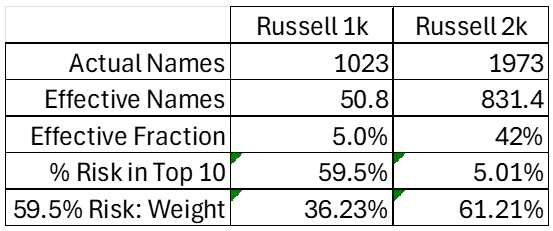
See Chart 22, Russell 1000 Diversification Ratio, October 2, 2026
See Chart 22, Russell 2000 Diversification Ratio, October 2, 2026
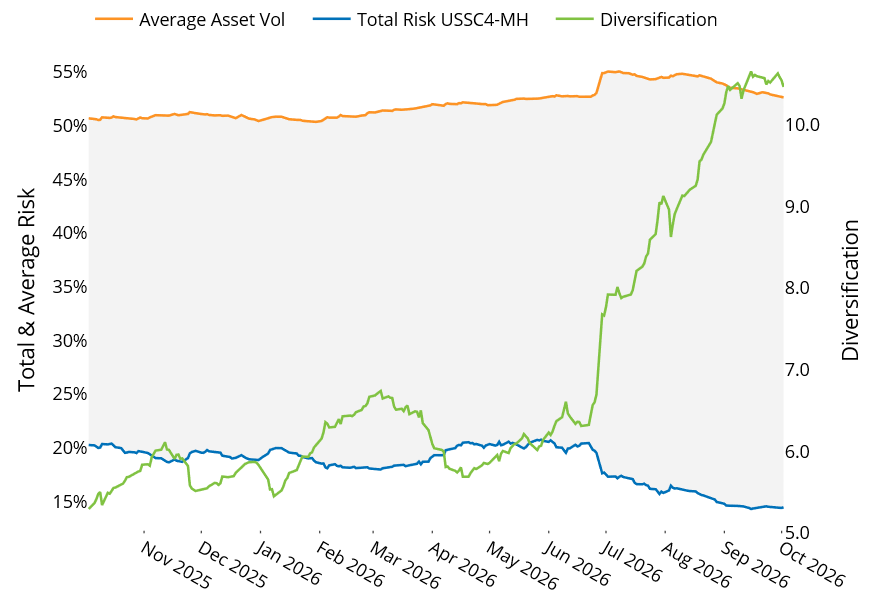
The large-cap index is bifurcated along the dimensions of the AI trade, which masquerades as diversification. The small-cap index truly is dispersed in terms of allocation and risk to its nearly 2000 companies.
You may also like
.jpg%3Fh%3D811%26iar%3D0%26w%3D1080&w=3840&q=75)

