
MULTI-ASSET CLASS MONITOR HIGHLIGHTS
WEEK ENDED JANUARY 2, 2026
US Treasury term spread widens to 4-year high
The term premium of 10-year over 2-year US Treasury notes ended 2025 at its widest level since January 2022. The bullish steepening, in which short rates declined more than long yields, occurred in two major phases at the tail ends of the year.
The 10-year yield initially climbed to almost 4.8% in the first two weeks of 2025, but soon started to decline once Donald Trump officially entered the White House, dropping all the way to 4% in the wake to the so-called Liberation Day tariffs in early April. Concerns about potential inflationary effects of the trade barriers and increased government spending soon pushed long-term borrowing costs up again to around 4.5% in May. Meanwhile, the 2-year rate gradually declined from 4.4% in mid-January to 3.6% at the end of April, as traders priced in more monetary easing from the Federal Reserve.
Both long and short rates started to decline once more in July in anticipation of the eventual first rate cut in mid-September. Initially, the shift was largely parallel, keeping the term spread stable around 55 basis points until the end of November. The 10-year rate eventually bottomed out at 4% and rebounded to its current level of 4.2%, propped up by long-term inflation expectations of 2.2% and a real rate of 2%. The 2-year benchmark, on the other hand, continued to descend toward 3.5%, as the Fed eased monetary conditions two more times in November and December, boosting the 10/2-year yield premium to 70 basis points.
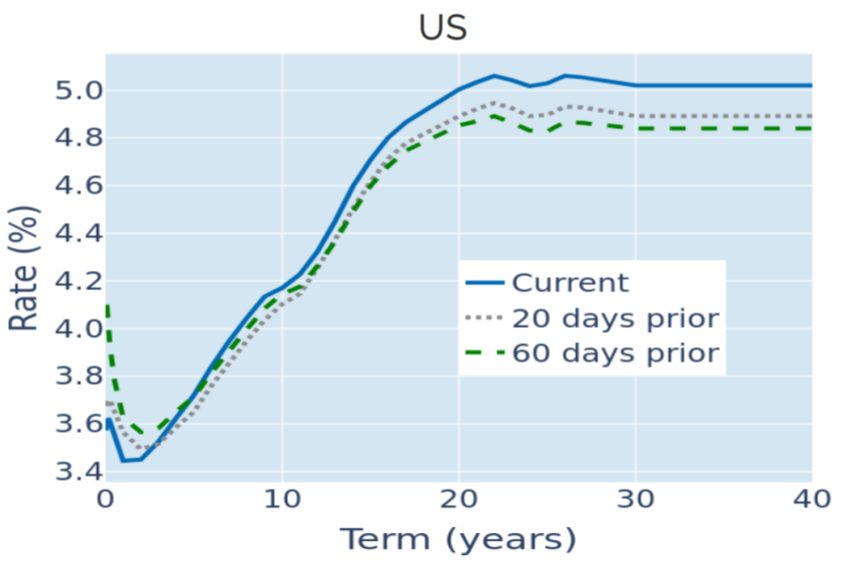
Please refer to Figure 3 of the current Multi-Asset Class Risk Monitor (dated January 2, 2026) for further details.
Lower yields weigh on dollar
The decline in Treasury yields also weighed on the US dollar, which depreciated more than 10% against a basket of major trading partners from its peak in mid-January. For most of the past four years, the value of the greenback was predominantly driven by the level of interest rates in the United States. This meant in turn that most other currencies appeared to be negatively correlated with the corresponding bond yields in their own regions. The relationship briefly decoupled after the introduction of the first tariffs in late February. The euro, Swiss franc, and Swedish krona benefitted most from the resulting capital exodus from the US, appreciating 10-12% between February 27 and April 21.
European currencies were also the biggest winners over the entire year, with the SEK leading the charge with a 20% gain, followed by the CHF (+12%) and the EUR (+11%). Bringing up the rear was the Japanese yen, which ended the year more or less at the same level against the dollar as where it started. The JPY initially also benefitted from the tariff-induced dollar selloff, rising 7% against its American rival in March and April. But it gave back most of the gains over the course of October and November amid concerns over increased fiscal spending, following Sanae Takaichi’s surprise victory in the LDP leadership election and her subsequent appointment as prime minister.
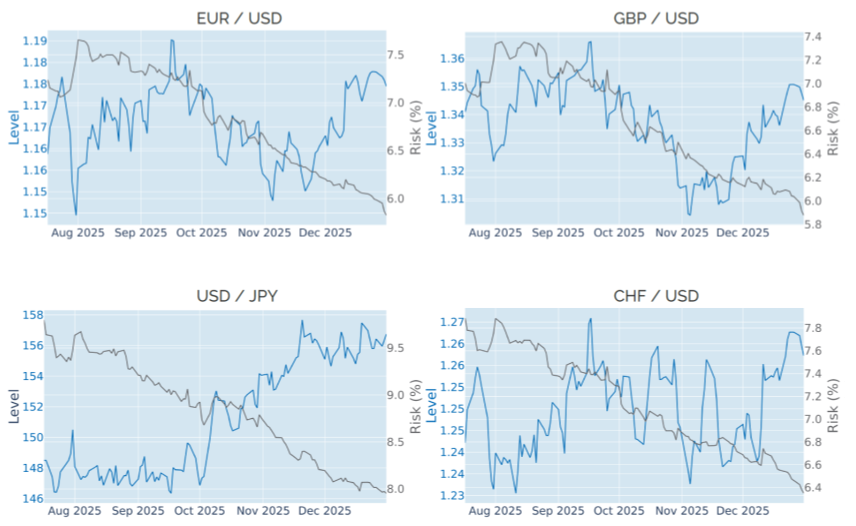
Please refer to Figure 6 of the current Multi-Asset Class Risk Monitor (dated January 2, 2026) for further details.
US equities dominate portfolio risk
The predicted short-term risk of the Axioma global multi-asset class model portfolio stood at 6.7% on Friday, January 2, 2026. US equities dominated the risk profile, accounting for 54% of total volatility compared with their monetary weight of 30%. The strong inverse relationship between the American stock market and the dollar made US equities appear positively correlated with assets in most other currencies, with the notable exception of the Japanese yen. The zero correlation of share prices and interest rates meant that US Treasury bonds neither added to nor subtracted from overall volatility. But corporate bonds still showed small positive contributions due to the ongoing strong connection between equity and credit returns. Gold showed the biggest percentage risk contribution of 5.6% relative to its monetary weight 3%, due to its strong co-movement with both share prices and exchange rates against the US dollar. Oil, on the other hand, remained largely uncoupled from most other asset classes, apart from emerging market equities.
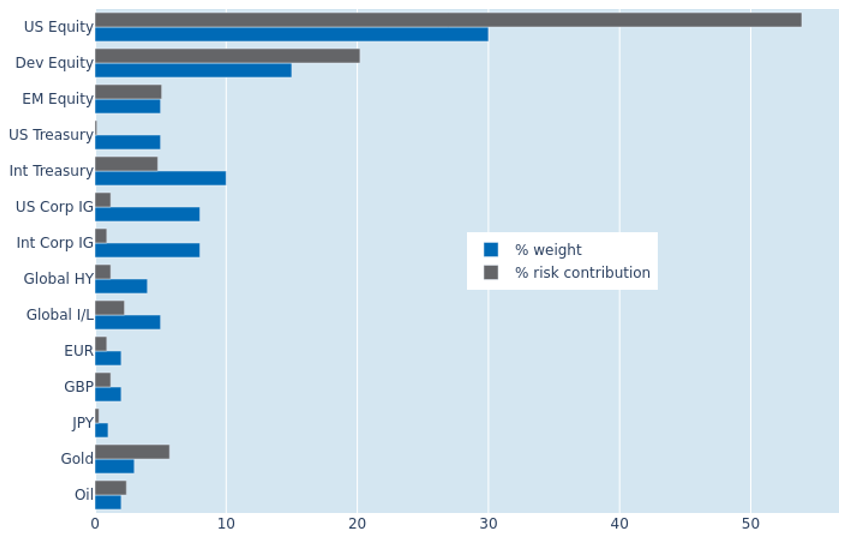
Please refer to Figures 7-10 of the current Multi-Asset Class Risk Monitor (dated January 2, 2026) for further details.
You may also like


