

MULTI-ASSET CLASS MONITOR HIGHLIGHTS
WEEK ENDED JUNE 19, 2026
Warsh’s hawkish reset flattens Treasury curve
The US Treasury curve flattened sharply in the week ending June 19, 2026, as markets repriced the path of policy rates following a clear reprioritization of inflation and a deliberate shift away from forward guidance at the first FOMC meeting under new Chair Kevin Warsh.
At his inaugural press conference, Warsh struck a notably firm tone on price stability, emphasizing that the committee remains fully and unanimously aligned on the 2% inflation target. With the labor market described as stable to improving, he dismissed the notion of a trade-off within the dual mandate, framing low inflation and strong employment as “mutually compatible.” Just as importantly, he signaled a procedural shift away from forward guidance, encouraging markets to respond to evolving fundamentals rather than attempting to anticipate the Fed’s reaction function. While the dot plot was retained, Warsh himself refrained from submitting projections. The signal nonetheless shifted, with nine of 18 participants anticipating at least one rate hike before year-end, compared with 12 who had expected lower rates back in March. Warsh pointed to this pivot as evidence that staff economic projections reflect views at a point in time and that policymakers do not “feel bound by them.”
In response, Fed funds futures raised the probability of a September hike from 27% to 69%, while the implied December policy rate moved to just below 4%. The front end bore the brunt of this adjustment, with the 2-year Treasury yield rising 10 basis points to its highest level since February 2025. In contrast, the long end rallied modestly, with the 10-year yield declining by 3 basis points as breakeven inflation rates softened back to pre-crisis levels seen in late February. The result was a pronounced flattening, with the 2s10s spread compressing to a 15-month low.
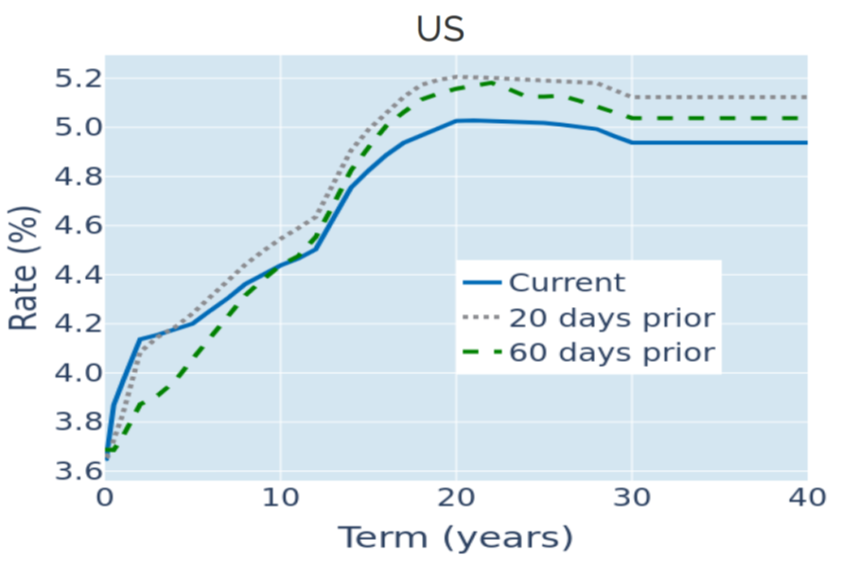
Please refer to Figure 3 of the current Multi-Asset Class Risk Monitor (dated June 18, 2026) for further details.
UK markets whipsawed by inflation surprise and political risk
UK markets were driven by a combination of softer-than-expected inflation data, a steady Bank of England decision, and a late-week political shock, with Gilt yields reversing earlier declines and the pound weakening over the course of the week.
The sequence began on Wednesday with the May inflation release, which came in below expectations. Headline inflation held steady at 2.8%, significantly lower than the 3% consensus forecast, while core inflation rose more modestly than anticipated, increasing from 2.5% to 2.6% rather than the expected 2.7%. This took some pressure off the Bank of England, which held rates unchanged in line with market expectations on Thursday.
By that point, the 10-year Gilt yield had declined by 9 basis points relative to the previous Friday. However, the move was fully reversed on Friday following the results of the Makerfield by-election, where Andy Burnham secured an overwhelming victory. The outcome reignited concerns about increased fiscal spending and government borrowing, pushing yields higher into the close.
In the FX market, sterling weakened by 1.4% against the dollar over the week, including a 1.1% decline on Thursday. Given the typically inverse relationship between UK interest rates and the pound, this move may appear somewhat counterintuitive, but it likely reflected broader dollar strength driven by higher US yields rather than UK-specific factors. As a result, sterling depreciated only marginally further on Friday (-0.2%), despite the sharp rise in Gilt yields on the day.
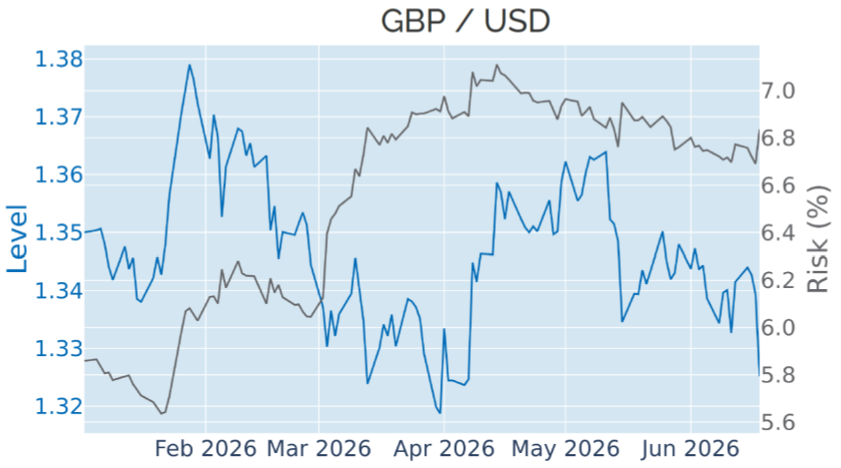
Please refer to Figure 6 of the current Multi-Asset Class Risk Monitor (dated June 18, 2026) for further details.
Rising equity volatility drives portfolio risk higher
The predicted short-term risk of the Axioma global multi-asset class model portfolio rose by 1.6 percentage points to 10.6% as of June 18, 2026, driven by a combination of higher equity volatility and stronger co-movement between stock prices and FX rates against the US dollar. The increase was most pronounced in non-US developed equities, whose share of total portfolio risk rose by 3.6 percentage points to 26.6%. Part of the rise was offset by a more negative relationship between oil and equity markets, which more than doubled the commodity’s risk-reducing contribution from -2.4% to -5.5%.
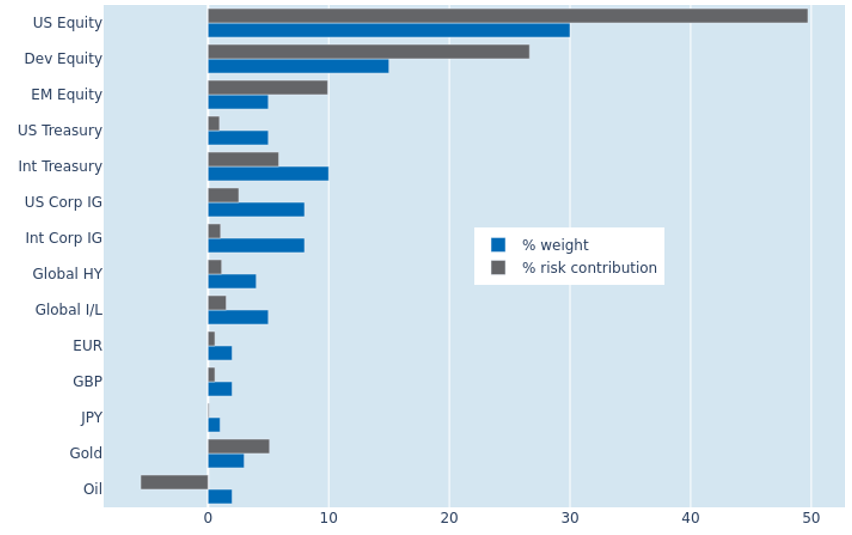
Please refer to Figures 7-10 of the current Multi-Asset Class Risk Monitor (dated June 18, 2026) for further details.
You may also like


