
MULTI-ASSET CLASS MONITOR HIGHLIGHTS
WEEK ENDED SEPTEMBER 4, 2026
Oil surge and fiscal fears push global bond yields to multi-decade highs
Global bond yields soared to multi-decade highs in the week ending September 4, 2026, amid a combination of surging oil prices, resurgent inflation expectations, and mounting concern over sovereign debt burdens.
The selloff unfolded predominantly between Monday and Wednesday, with German 10-year and 30-year Bund yields climbing to their highest levels since 2011, while the same-maturity UK Gilt benchmarks reached levels last seen in 2002 and 1998, respectively. Japanese 10-year JGB yields similarly rose to a 30-year high. The moves were underpinned by a 9% surge in oil prices and corresponding jumps in breakeven inflation rates, alongside deepening concern over public finances. In the US, federal debt is fast approaching 125% of GDP, with roughly one in five dollars of government spending now going toward interest payments.
UK markets were hit particularly hard on Tuesday, as they caught up with their global peers after Monday's bank holiday. The move reflected heightened government spending concerns, with many economists now predicting that higher inflation and surging borrowing costs could almost halve Chancellor John Healey's fiscal headroom from £24bn to £13bn. At the very short end of the curve, the 12-month SONIA forward rate jumped 17 basis points, implying markets now assign a 50% probability that the Bank of England will raise its base rate four times over the coming year.
Fed Governor Christopher Waller's remarks on Thursday, in which he signaled support for holding rates steady, only briefly interrupted the selloff, modestly easing Treasury yields. Friday's non-farm payrolls report — a much stronger-than-expected 162,000 jobs added against a consensus of 56,000, compounded by a combined 55,000 upward revision to the June and July figures —largely offset Thursday's relief, leaving borrowing rates firmly in the black for the week.
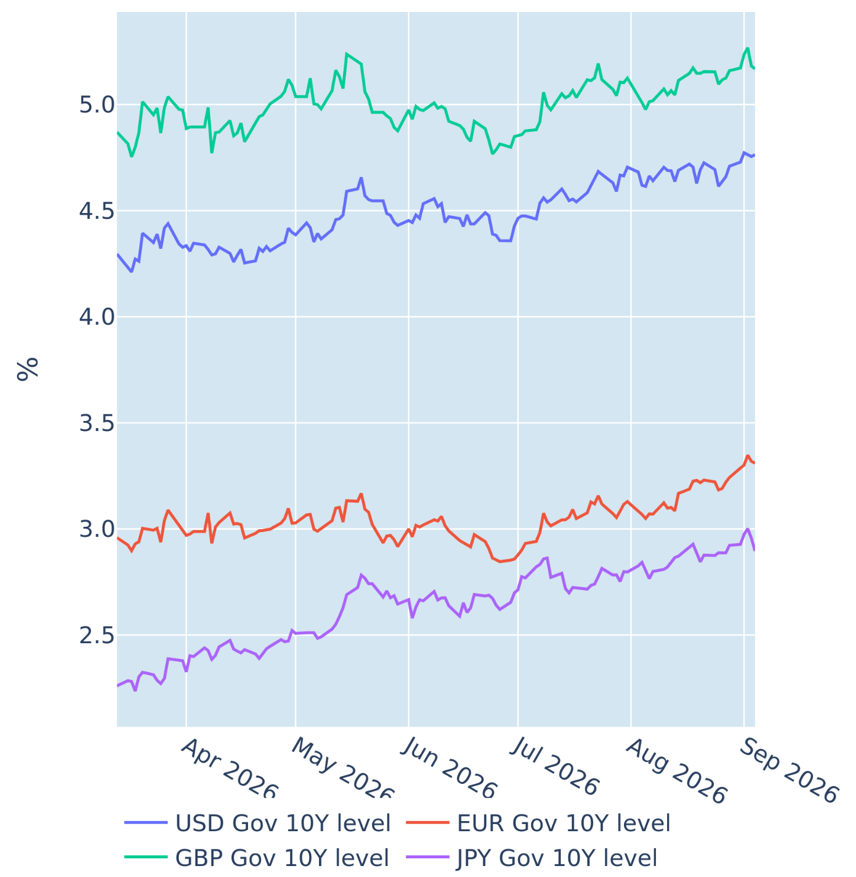
Please refer to Figure 4 of the current Multi-Asset Class Risk Monitor (dated September 4, 2026) for further details.
Yen recoups pre-conflict levels on intervention speculation
The yen appreciated sharply on Thursday amid renewed speculation over intervention by Japanese authorities, pushing the currency back above the levels last seen in late February, just before the outbreak of hostilities in the Middle East.
Another widely cited, potential reason for the resurgence of the yen was the rise in JGB yields and prospects of further Bank of Japan tightening, but that seems less plausible given the timing of the respective moves. The global surge in borrowing costs occurred between Monday and Wednesday, while the biggest move in the FX market happened on Thursday when interest rates began to ease back. Furthermore, unlike the well-established positive relationship between the dollar and Fed rate expectations, the correlation between Japanese yields and the yen has historically been predominantly negative.
Neither could the stronger yen be attributed to a wider dollar weakness in the wake of Waller’s dovish comments, as most other G10 currencies hardly budged on Thursday and ended the week mostly flat against their American rival.
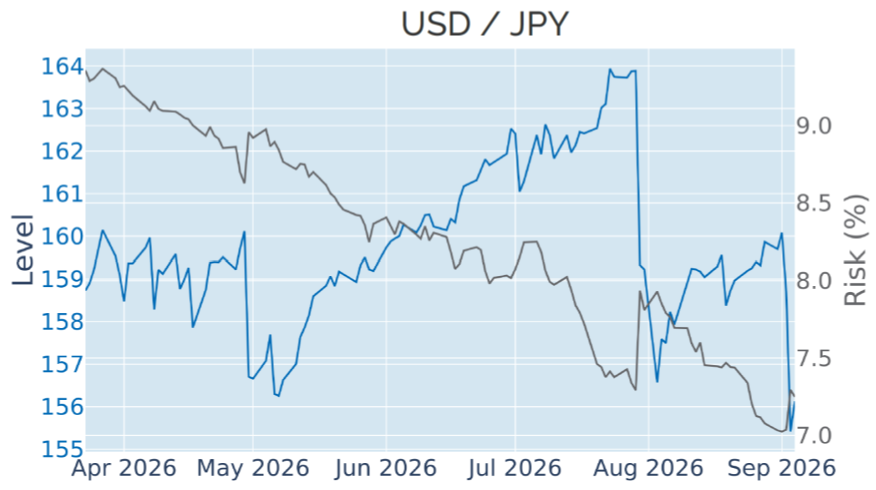
Please refer to Figure 6 of the current Multi-Asset Class Risk Monitor (dated September 4, 2026) for further details.
Portfolio risk rebounds as rising cross-asset correlations offset lower equity volatility
Predicted short-term risk for the Axioma global multi-asset class model portfolio rebounded from 5.7% to 6.1% as of Friday, September 4, 2026, as the beneficial impact of lower share price volatility in some markets was more than offset by a more positive interaction between FX, equity, and interest rate returns. Developed and emerging market equities both recorded declines in their percentage risk contributions of 4% and 4.9%, respectively. US equities, on the other hand, saw both their standalone volatility and their share of total portfolio risk increase, with the latter expanding from 48.7% to 51.8%. Non-USD government bonds also added more overall volatility, both because they became individually more volatile and because stronger cross-asset co-movements made their returns appear more correlated with the rest of the portfolio. Gold showed a higher correlation with most other assets, too, raising its risk contribution by 3.5 percentage points to 8.7% and making the precious metal once more the riskiest position relative to its monetary weight of 3%. Oil, in contrast, remained the exception and even grew its risk-reducing benefit from -3.6% to -5.6%.
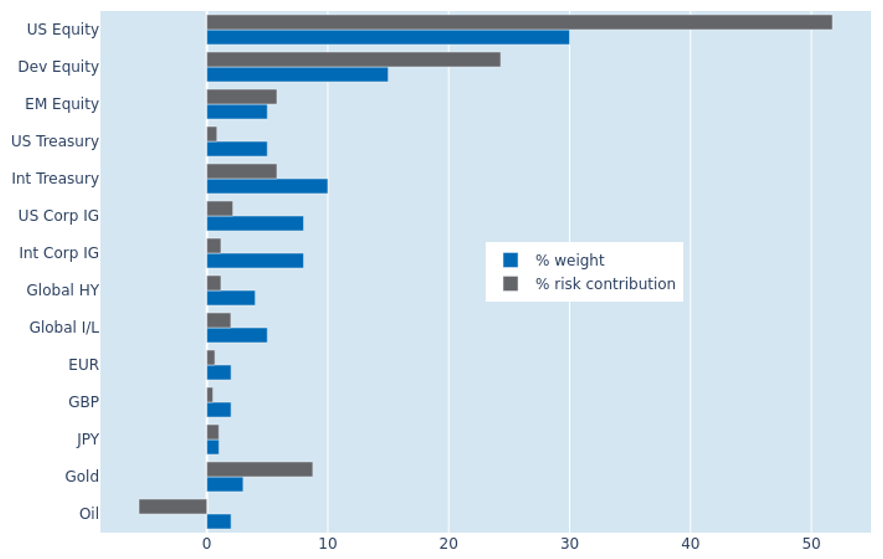
Please refer to Figures 7-10 of the current Multi-Asset Class Risk Monitor (dated September 4, 2026) for further details.
You may also like


