

MULTI-ASSET CLASS MONITOR HIGHLIGHTS
WEEK ENDED NOVEMBER 13, 2026
Bonds suffer worst week in years as stock market rebounds
US Treasury bonds suffered their worst week in at least 19 months in the week ending November 13, 2026, as a combination of stronger-than-expected inflation data, a significant upward revision in monetary policy expectations, and a rebound in share prices drove yields sharply higher across the curve.
The Bureau of Labor Statistics (BLS) reported on Tuesday that US headline consumer prices rose 0.4% last month, while the core component excluding food and energy costs was up 0.3%. Both measures exceeded their respective consensus predictions by a tenth of a percentage point. The BLS did not publish annual inflation figures for October, as a government shutdown prevented it from collecting data for the corresponding month last year.
In response to the strong inflation reading, the projected federal funds rate for June 2027 rose from 4.30% to 4.68% by the end of the week, with futures markets assigning an 80% probability to at least 75 basis points of further tightening over the next seven months, up from 20% the previous Friday. A December rate hike is now considered a certainty, with a small probability attached to a 50-basis-point move after Fed Governor Christopher Waller argued on Tuesday that a lesser increase would risk undermining the central bank’s credibility. Should the FOMC opt for the smaller move, futures markets still price in a 75% chance of a follow-up increase in January.
The monetary policy-sensitive 2-year yield replicated the move by climbing 37 basis points, which marks its biggest weekly increase since early October 2024 when markets priced out nearly two rate cuts on the back of a stronger-than-expected non-farm payrolls report. The 10-year yield rose 29 basis points on the week, its steepest increase since early April 2025.
The rebound in share prices added to the pressure on yields by reversing most of the safe-haven move from the previous four weeks, extending the countermovement of the two asset classes into a fifth consecutive week and making it the longest such stretch of US equity-yield co-movement since late 2021.
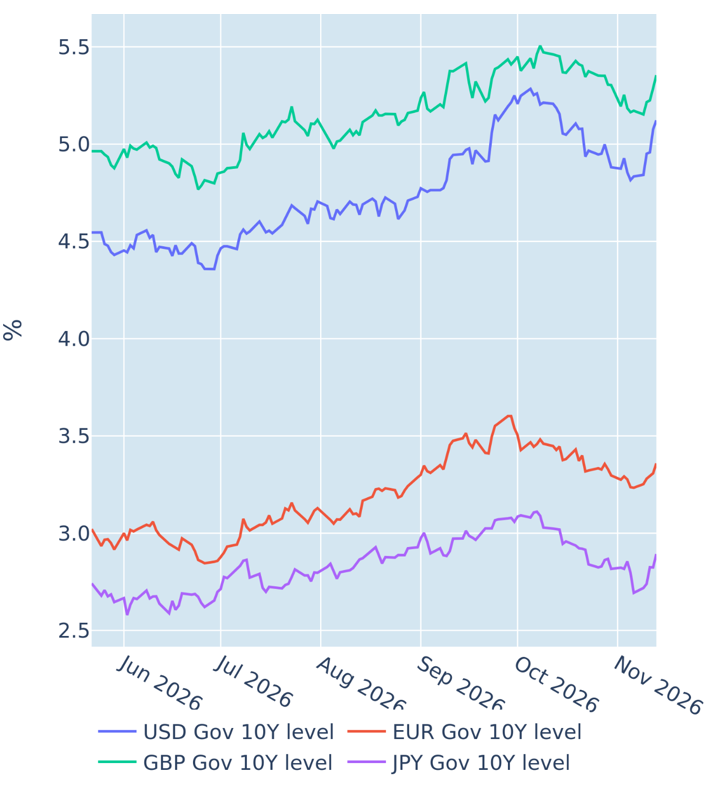
Please refer to Figure 3 of the current Multi-Asset Class Risk Monitor (dated November 13, 2026) for further details.
Higher yields boost dollar and depress euro to 19-month low
Last week’s sharp upward revision in US monetary policy expectation and the accompanying surge in Treasury yields once again boosted the dollar by 1.1% against a basket of major trading partners. On the flipside, the move depressed the euro to its weakest level against its American rival since April 8, 2025, expanding the single currency’s losses since the onset of the French government crisis in early September to more than 5%.
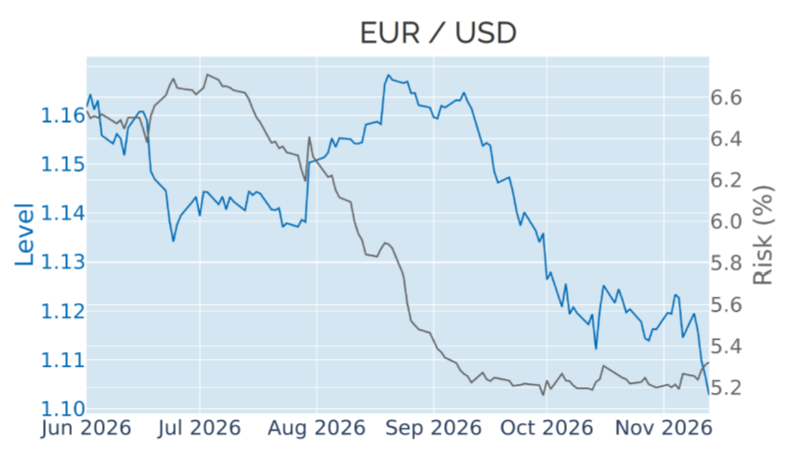
Please refer to Figures 6 of the current Multi-Asset Class Risk Monitor (dated November 13, 2026) for further details.
Stable portfolio risk conceals rotation across factors and assets underneath
Predicted short-term risk for the Axioma global multi-asset class model portfolio remained unchanged at 5.4% as of Friday, November 13, 2026, but the stable headline figure masked a significant rotation beneath the surface. Standalone volatilities for equities, interest rates, and exchange rates all increased over the week, while the co-movement of FX with interest rate returns and of equity with credit spread returns both intensified, adding to total portfolio risk. This was offset by a more negative correlation between recovering share prices on one side and falling bond prices and depreciating currencies on the other.
For non-US developed and emerging market equities, the higher standalone volatilities far outweighed the dampening currency effect, raising their percentage risk contributions by 9.8 and 3.7 percentage points, respectively. US equities, in contrast, saw their share of overall portfolio risk drop from 81.0% to 73.6% on the back of last week’s strong rebound. US Treasury bonds and investment grade corporate bonds now actively reduce overall risk alongside gold, while oil neither adds to nor subtracts from total volatility, as its price decoupled from most other asset classes in the portfolio.
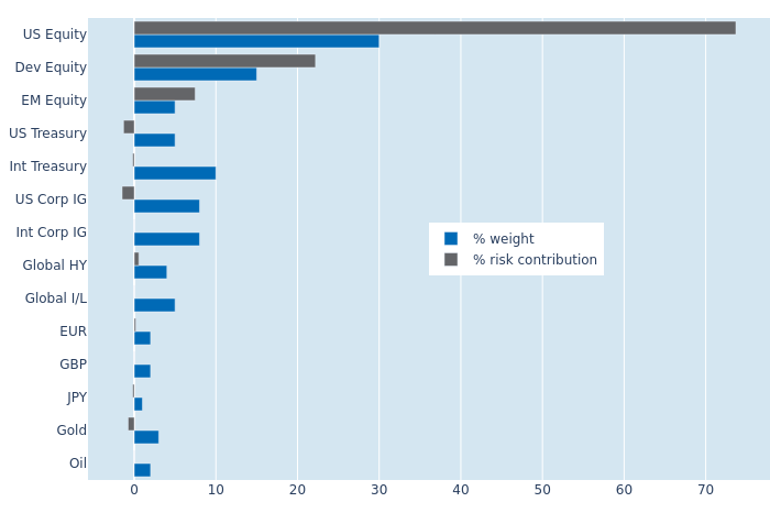
Please refer to Figures 7-10 of the current Multi-Asset Class Risk Monitor (dated November 13, 2026) for further details.
You may also like


