
AXIOMA ROOF™ SCORE HIGHLIGHTS
WEEK OF JULY 20, 2026
Insights from last week's changes in investor sentiment:
There are weeks when earnings are allowed to matter, and weeks when they are invited to speak only after geology, geography, and naval chokepoints have finished clearing their throats. Last week belonged to the second category. Corporate results did their part, especially in the AI complex, where demand for chips, foundry capacity, and the machinery that makes both possible still looks less like a cycle than a requisition order from the future. But the Gulf supplied the counterweight. Three additional US casualties, a closed Hormuz, and rising oil prices turned the macro backdrop into a toll road with a burning booth at the entrance. Investors may admire an earnings beat; they still have to pay for the crude.
That distinction matters because the ROOF Scores are no longer confirming the equity market’s preferred version of events. Aggregate sentiment is now negative at -0.22, down from neutral a month ago at +0.18, but little changed over the past week from -0.16. The monthly deterioration is the story; the weekly move is not. Investors did not capitulate last week. They simply failed to repair the damage already done. That is a less dramatic sentence than “sentiment collapsed”, but it is the more useful one. A weakening risk appetite that stops falling for a week has not become support. It has become an alibi.
The regional picture is doing the same thing, only less politely. Sentiment among Australian investors is bullish at +0.58 after a material weekly improvement, and UK investors remain bullish at +0.56, despite a modest deterioration over the past month. US investors are neutral at -0.03, still refusing to join either the optimists or the undertakers. But the broader developed-market complex is less forgiving: sentiment among DM investors is negative at -0.35 after weakening materially over the month, while DM ex-US investors are neutral at -0.10 only because classification thresholds are literal, not sentimental. Their monthly move of -0.80 is doing the talking. Europe has slipped negative, APAC ex-Japan sits at -0.48 just above the bearish threshold, EM investors are already bearish at -0.61, and sentiment among China investors is deeply bearish at -1.41 after another material weekly fall. The map is not split between good and bad. It is split between islands of risk tolerance and a mainland of reluctance.
This is why last week’s AI earnings were not enough. They were good news with a strong résumé and poor timing. In a positive sentiment environment, investors tend to overreact to good news and forgive defects in the footnotes. In a negative environment, good news must be precise, repeatable, margin-accretive, capex-light, geopolitically insulated. Bad news has no such administrative burden.
The oil shock is especially awkward for investors because it attacks the rally through more than one door. Higher crude prices threaten margins, inflation expectations, consumer income, central-bank patience, and the discount rate narrative that has helped equities look past almost everything else. AI can still be a powerful earnings story, but it cannot easily neutralize higher oil prices if investors are already less willing to take risk. The issue is not whether the AI investment cycle is real. The issue is whether investors with rising macro concerns will keep paying a scarcity multiple for future capacity while the present is repricing barrels. Even miracles have input costs.
The dispersion in ROOF Scores means that there is no single clean message. Australia and the UK say some investors are still willing to speculate. The US says investors are balanced, but not enthusiastic. Europe, developed markets, emerging markets, and China say reluctance has spread far enough that further upside now depends less on another corporate beat than on a reduction in the perceived downside. That is a different kind of rally fuel. Early recoveries can be led by risk-tolerant contrarians; durable advances require risk-averse investors to stop treating participation as a character flaw. Right now, too many of them are still waiting for the news to pass inspection.
This week, investors need an easing in the Gulf, steadier oil prices, and earnings that keep the AI narrative separate from macro risk. They may get some of that, but probably not all. With aggregate sentiment already negative and several markets bearish or close to it, the asymmetry is clear: positive news can steady the floor, but negative news will have investors running for the exit.
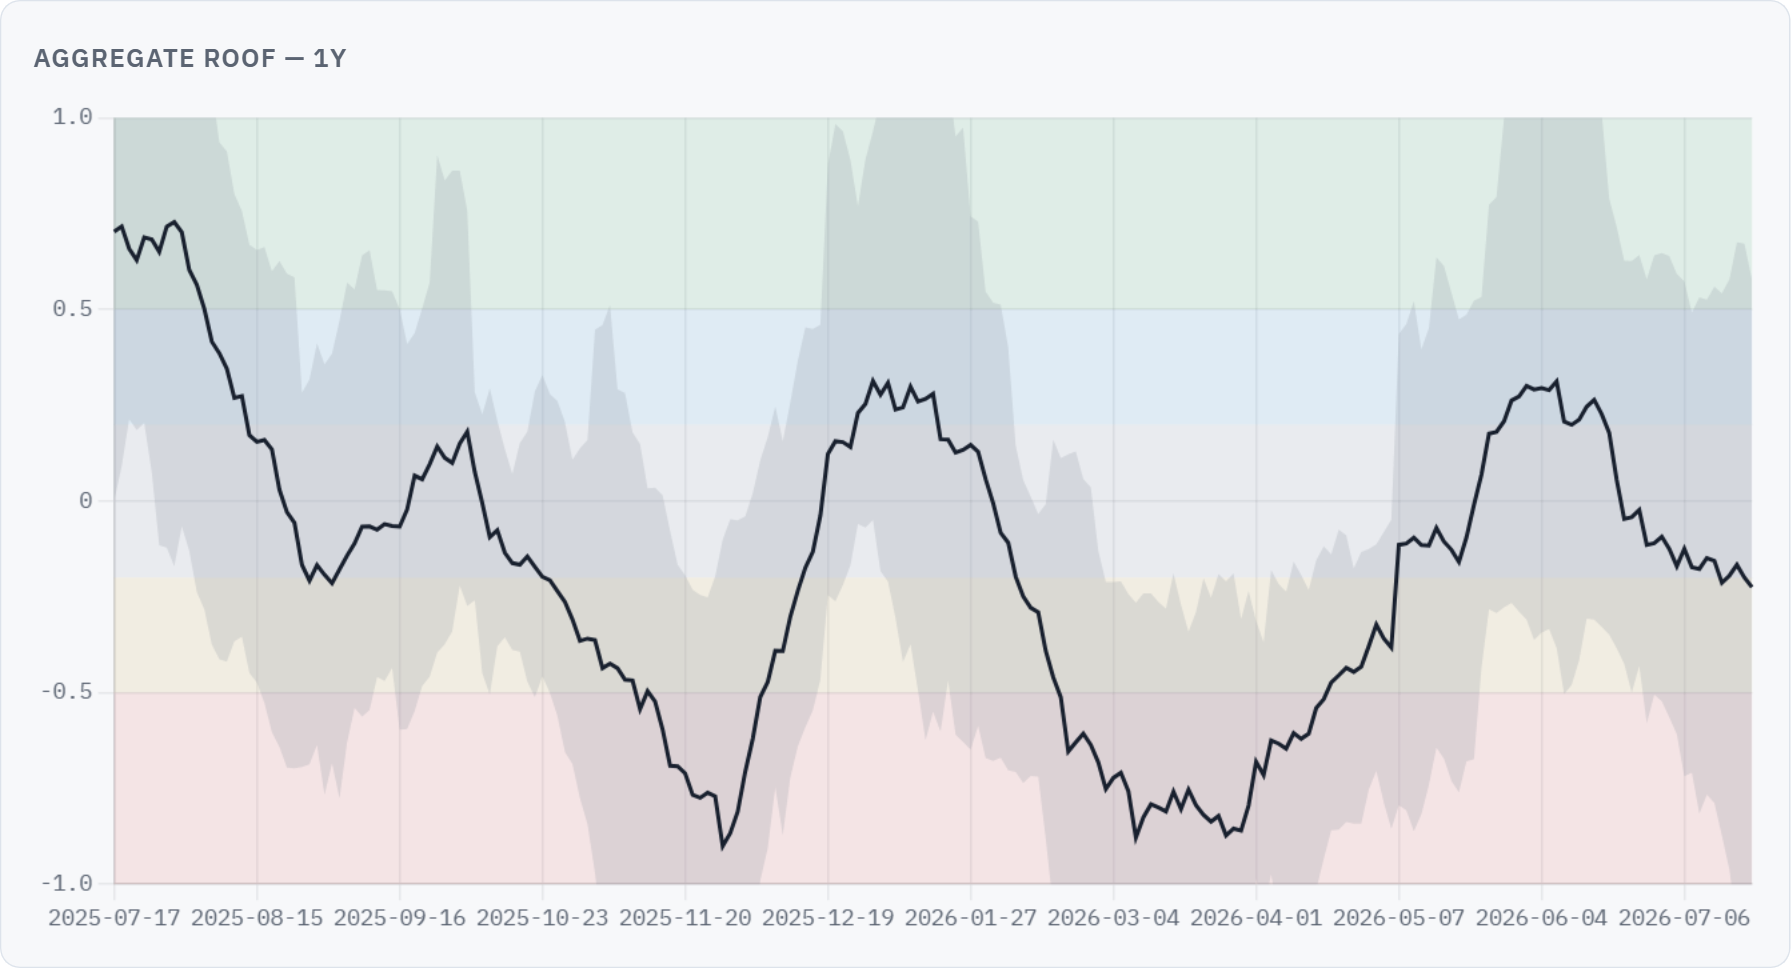
Aggregate ROOF Trend: A one-year line chart of the equally-weighted average ROOF score across the ten markets. The black line is the aggregate mean of ROOF scores across the ten markets; the shaded grey band shows the range from the most bearish market's ROOF to the most bullish market's ROOF on each day, indicating the dispersion of sentiment across the universe. Reading it: a rising line indicates increasing risk tolerance; a declining line indicates increasing risk aversion.
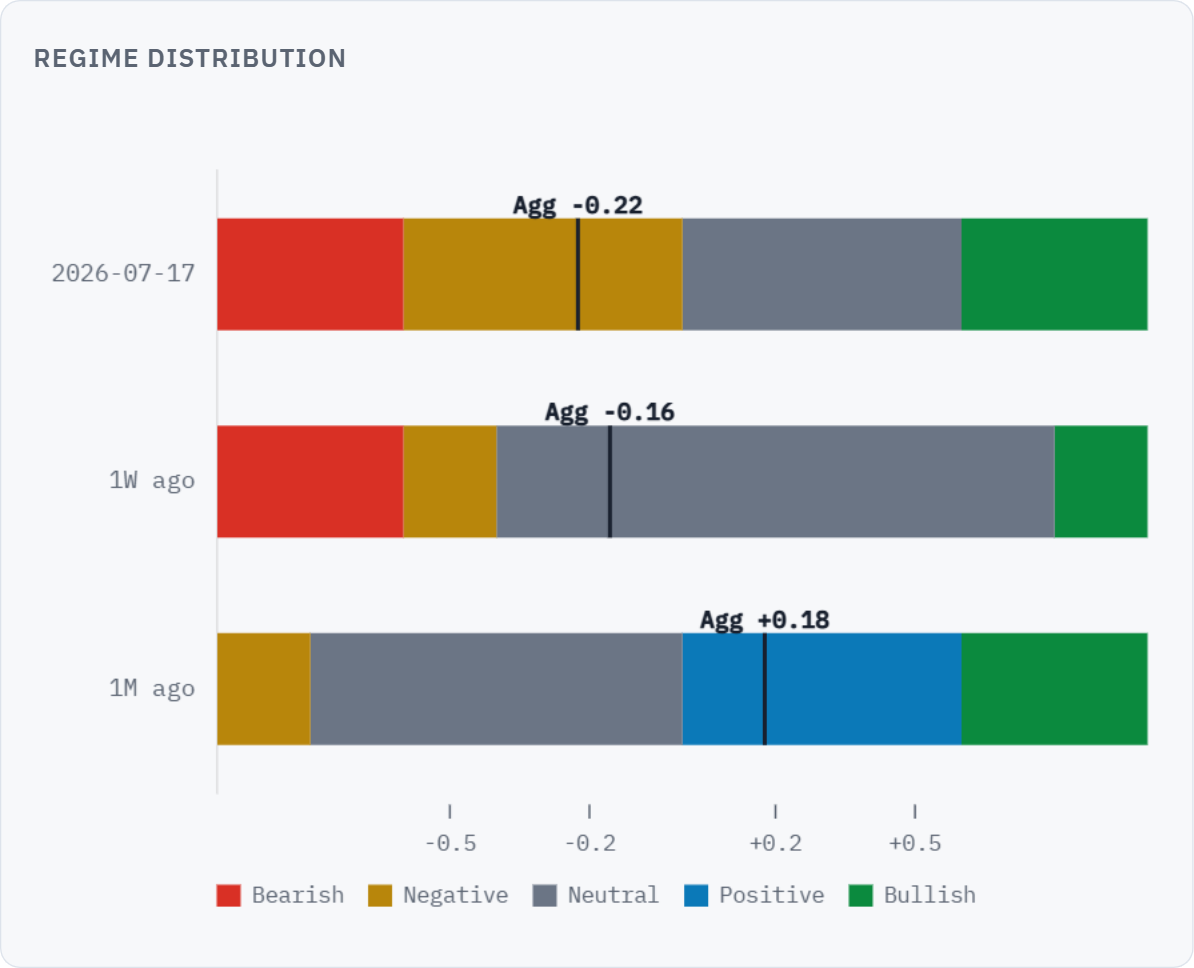
Regime Distribution: Three horizontal stacked bars show how the ten markets are distributed across the five regimes — today, one week ago, and one month ago. Each bar is colored by regime: red (Bearish), yellow (Negative), grey (Neutral), blue (Positive), green (Bullish). The white vertical marker on each bar shows the aggregate ROOF score for that period. Tick marks below the bars align with the regime thresholds at ±0.20 and ±0.50. Reading it: a leftward shift over time indicates broadening deterioration; a rightward shift indicates broadening improvement. Widening tails signal rising dispersion.
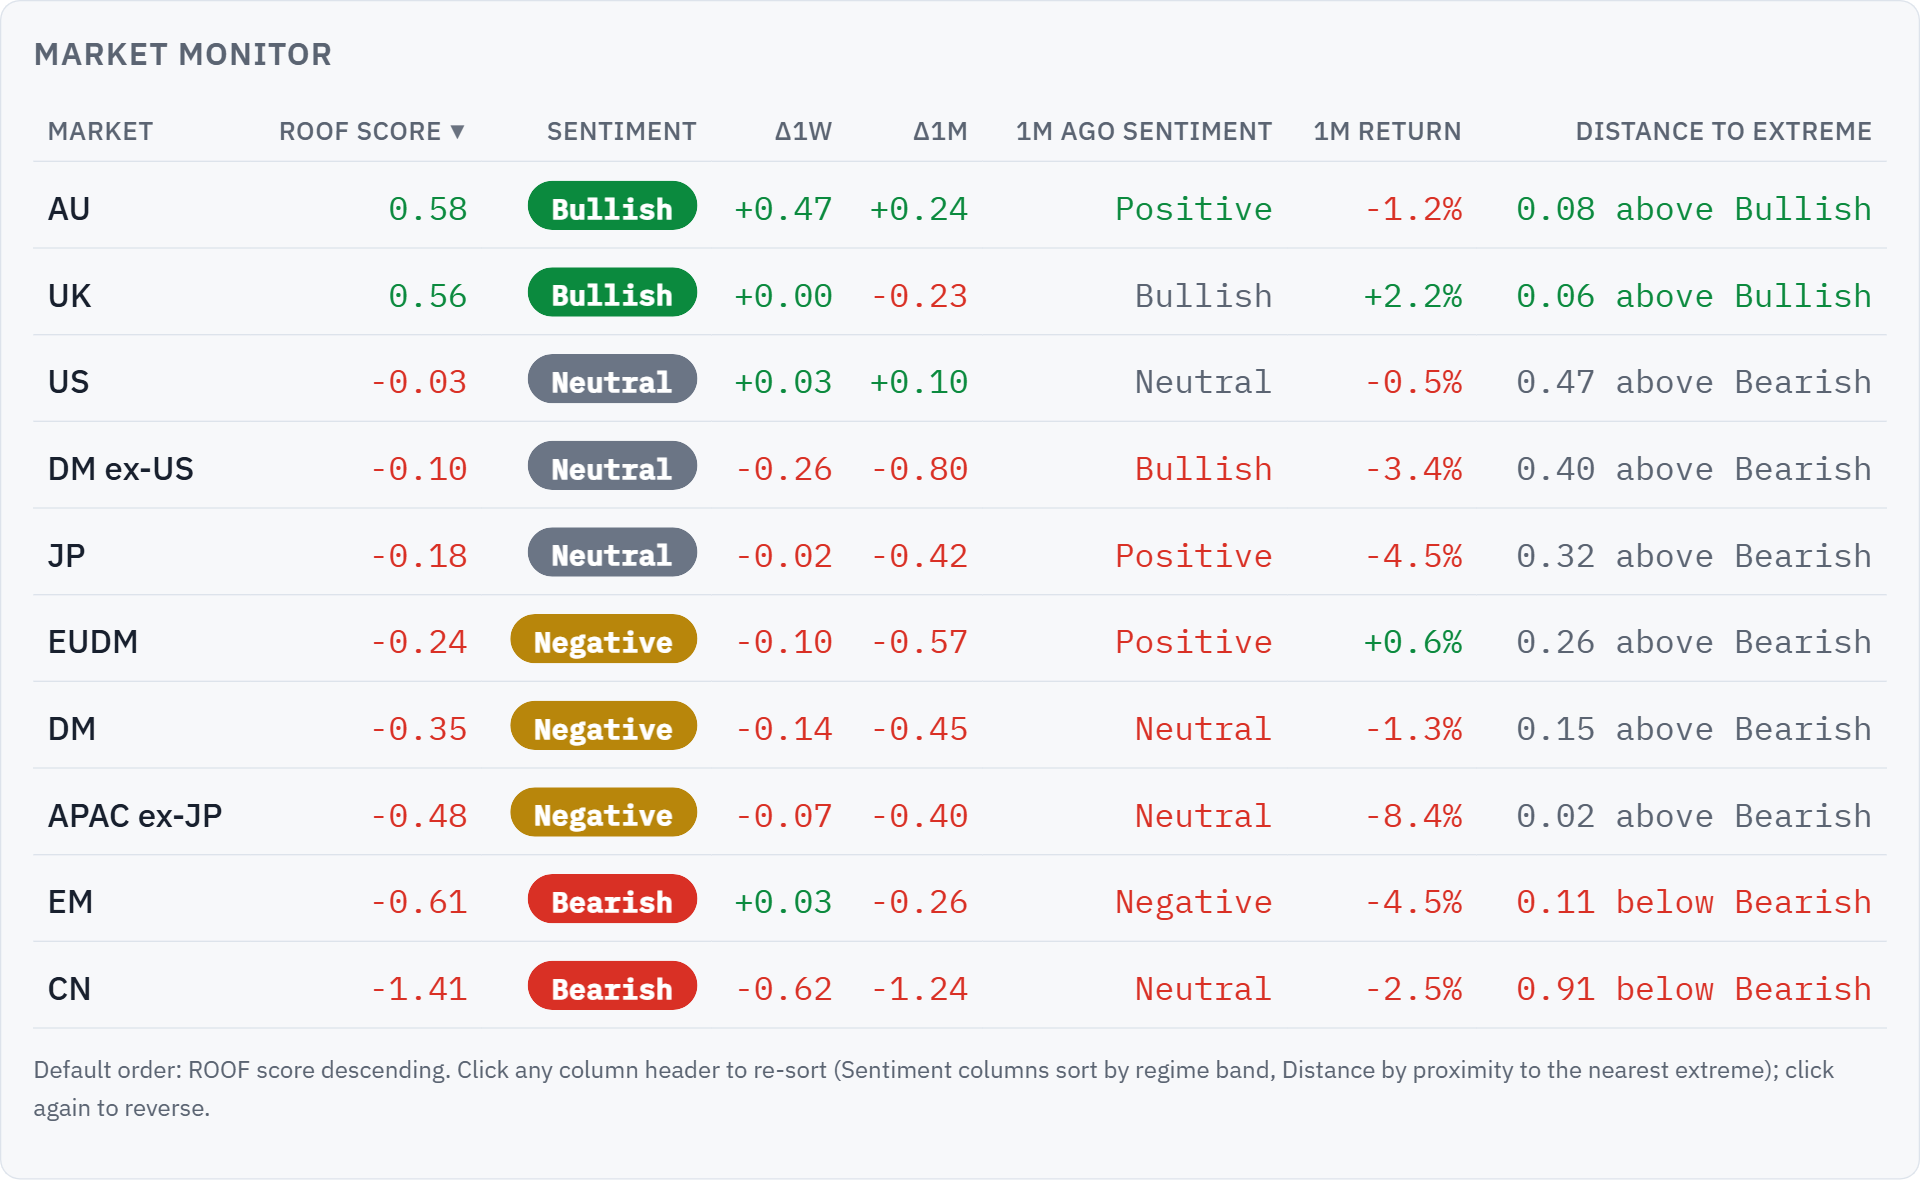
Market Monitor: A table showing, for each market: current ROOF score, current regime, weekly and monthly changes, regime one month ago, and distance to the nearest extreme threshold. Color cues highlight regime deteriorations (red) and improvements (green). Reading it: scan the "1M Ago Regime" column for markets that have crossed regime bands over the past month; check the "Distance" column to find markets close to the ±0.50 extreme thresholds.
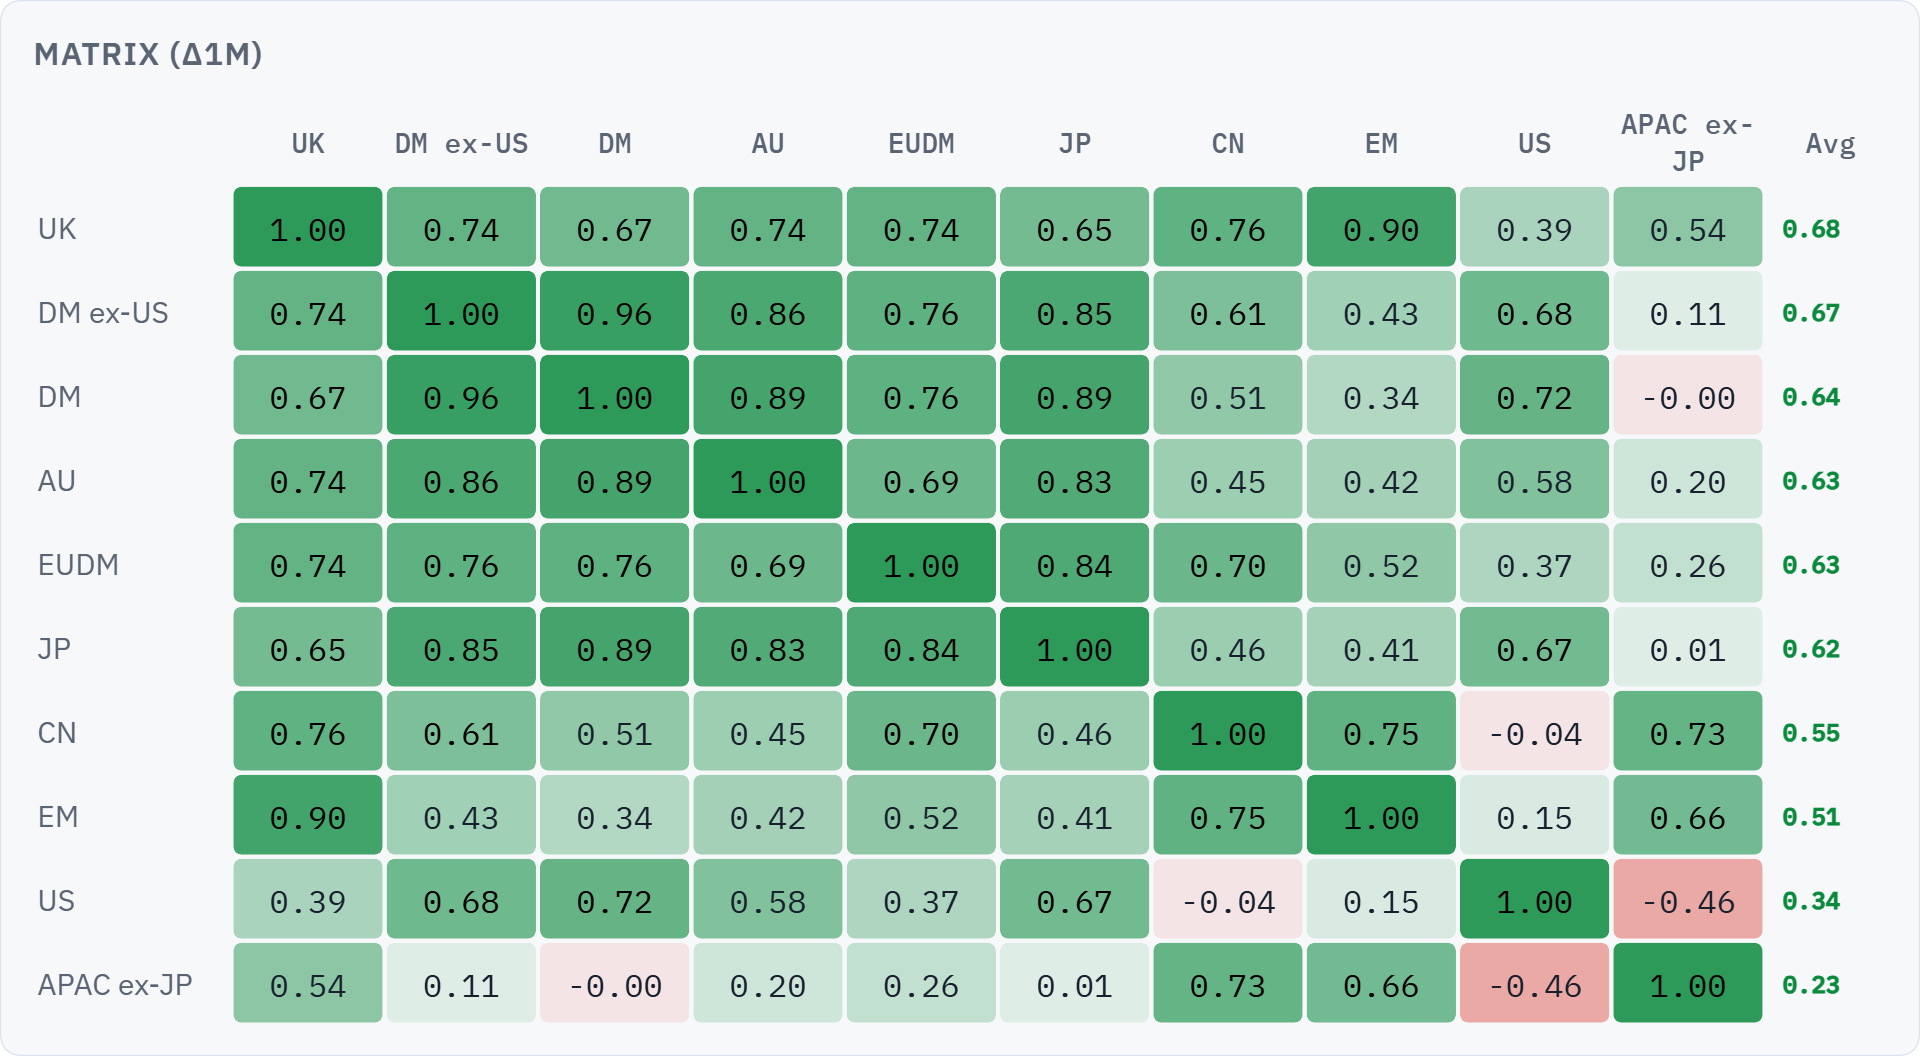
Correlation Matrix (Δ1M): A heatmap of correlations between monthly sentiment changes across all market pairs, over a rolling 60-day window. Green cells indicate that investor sentiment in the two markets changed in the same direction; red cells indicate opposite directions. The rightmost column shows each market's average correlation with the rest of the universe. Important: these are correlations of sentiment changes, not market returns or ROOF levels. High correlation means investor mood in the two markets moved in sync over the past 60 days.


You may also like


