

EQUITY RISK MONITOR HIGHLIGHTS
WEEK ENDED SEPTEMBER 12, 2025
In this week’s highlights we offer some musings on why volatility has remained so low despite an abundance of potentially bad news around the world. We would love to hear your views as well: please email us at InvestmentDecisionResearch-MEBR-E@simcorp.com with your thoughts!
Recent macroeconomic news reports in the US may seem to be disappointing – both higher-than-expected inflation and downward revisions in employment suggesting the US economy is not quite as rosy as previously thought were reported last week. Taken together, the possibility of a “stagflationary” environment in the US has increased. Tariffs – and their implications for global trade, inflation, etc. continue to dominate the conversation. The disparity between market optimism and economic concerns is not limited to the US. We note that among very recent news reports, the French government seems to be in turmoil and Israeli missiles struck Doha. Yet investors not only don’t seem worried, they appear to be almost giddy, driving stock prices steadily higher and predicted volatility lower. For more on how the stagflation threat is impacting fixed income markets, see our Multi Asset Class Weekly Highlights, here.
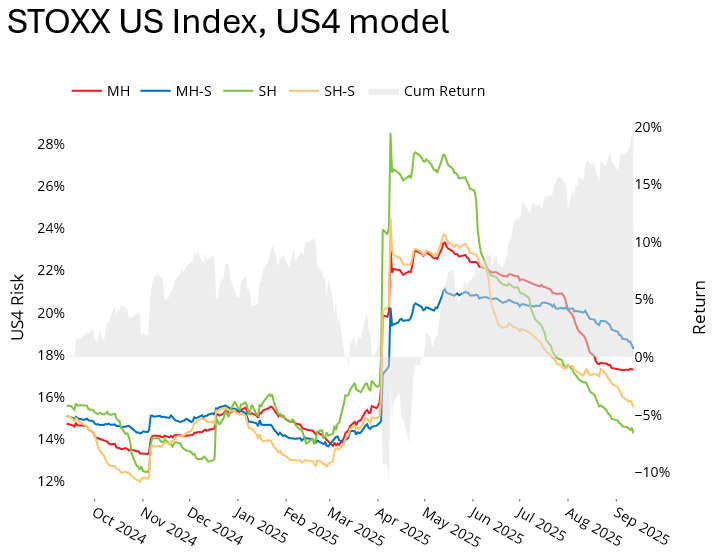
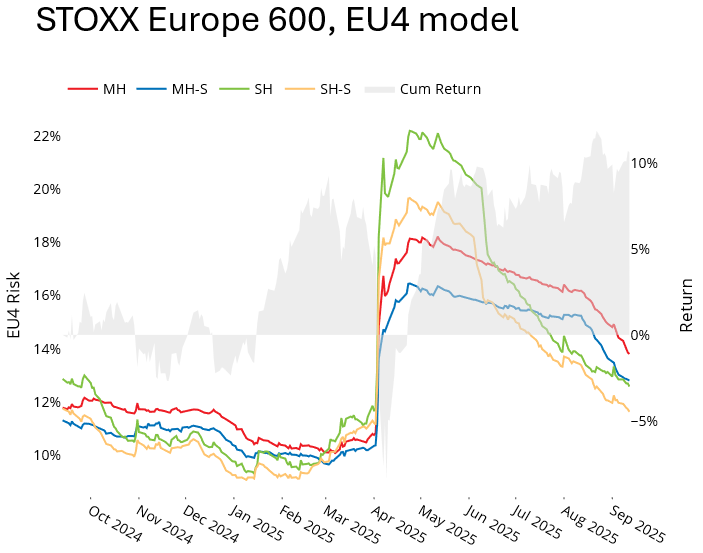
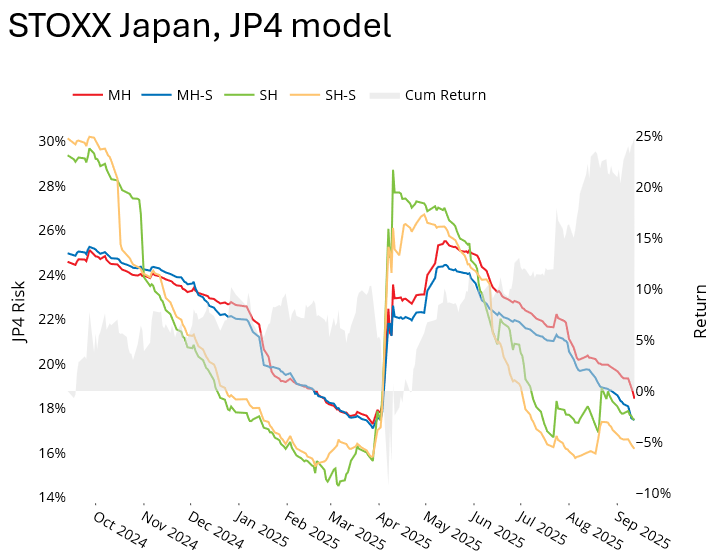
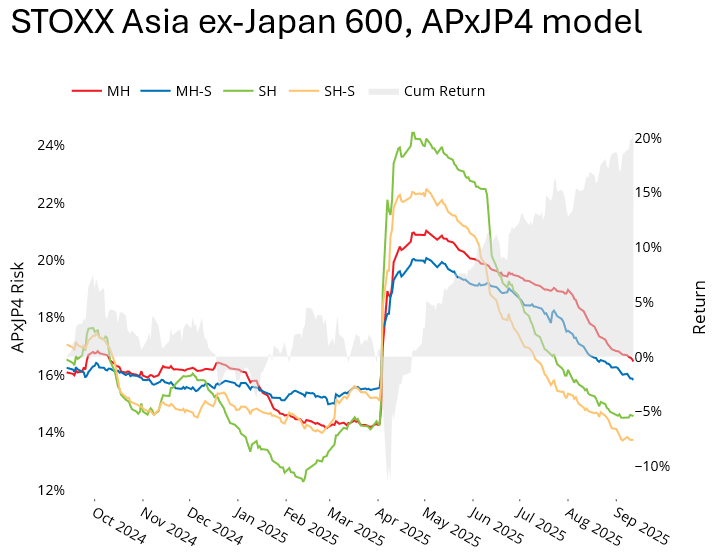
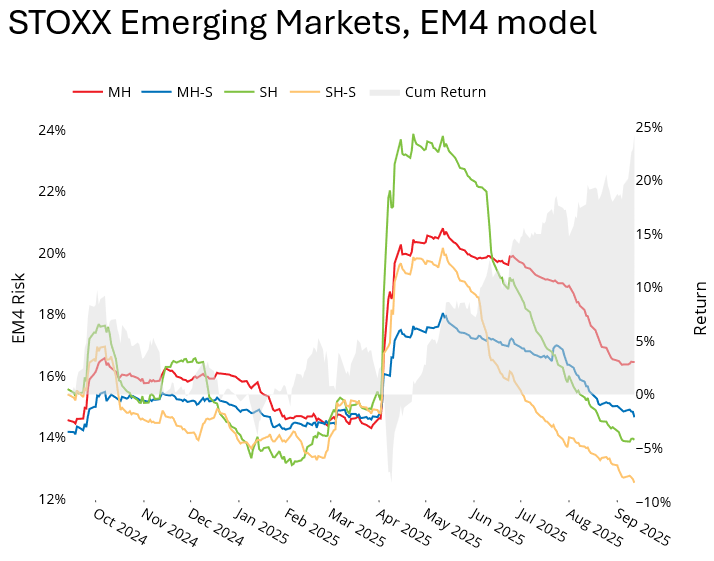
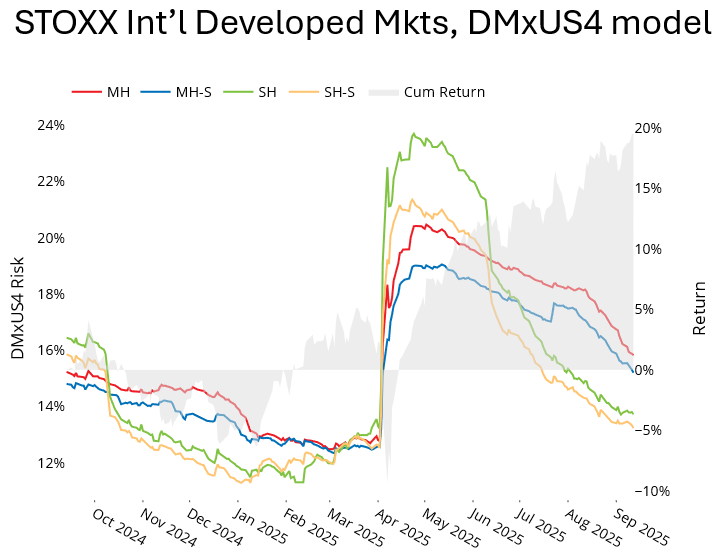
It is somewhat puzzling, given the seeming turmoil, why predicted volatility remains so low across the globe. The short-horizon fundamental risk forecast for the US market ended last week at roughly its long-term median level, and lower than where it was before the US election and where it started the year, as well as roughly half its level right after “Liberation Day.” Although the US market is clearly dominated by relatively few stocks, we see a similar pattern of sharply lower risk across most of the markets we track closely and therefore cannot attribute the risk decrease solely to the enthusiasm driving a few select names.
See charts showing predicted risk from the equity risk monitors of September 12, 2025
 |  |
 |  |
 |  |
Other than chalking up the steady upward trend in stock prices and relatively low level of market volatility to expectations for Fed rate cuts alone, we see a few possibilities of what is happening:
- Low correlations of individual stocks and sectors.
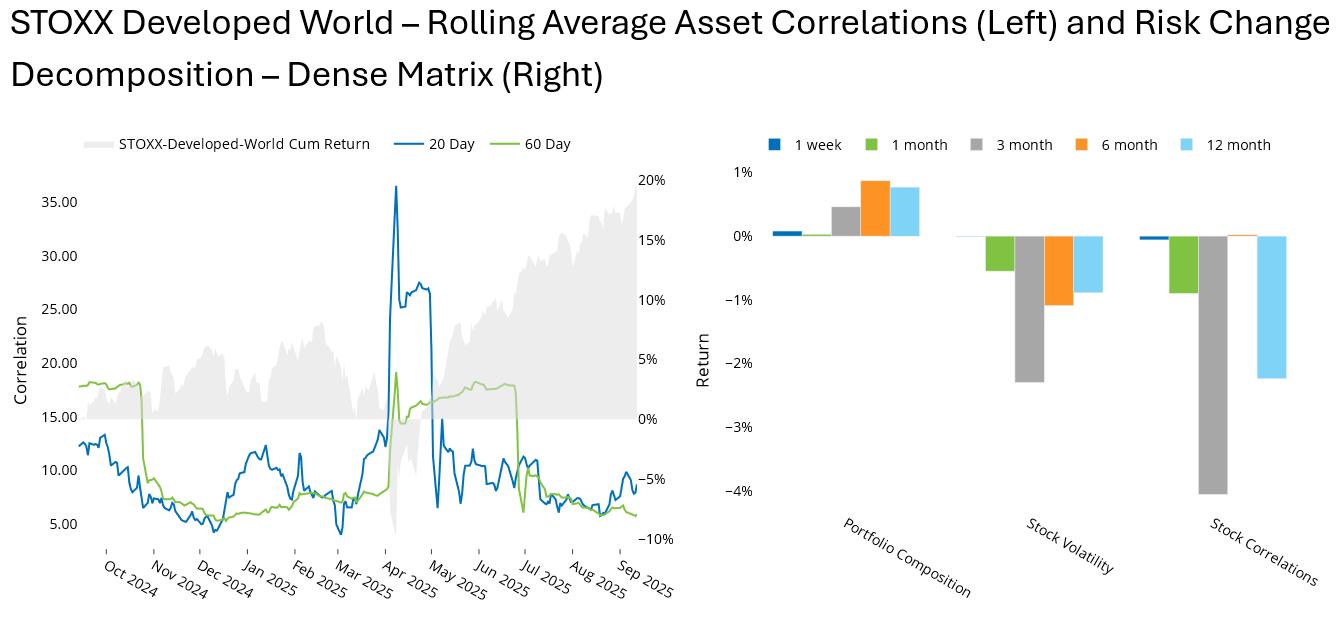
- Positive spread between the short-horizon statistical risk forecast and its fundamental counterpart, at least in the US, suggesting a risk “bubbling under the surface” that is not captured by one of the traditional fundamental factors. Perhaps it is the tariff threat. The positive spread can be seen in the top left chart, above.
- Underlying increases in risk for some factors that may be offset by decreases in others.
- Investors behaving “rationally,” as demonstrated by the performance of style factors, which can help justify the relatively low volatility.
We can see the low level of realized correlations for Global Developed Markets in the left-hand chart below, and how the impact of these lower correlations dominated the decrease in risk according to our decomposition of the change in risk, especially over the last three and 12 months. As markets continue to differentiate the winners and losers based on the variables noted above as well as from industry and individual company trends, we may see these correlations – and therefore predicted volatility – remain muted. However, a market event could drive all stock prices down and change those correlations quickly.
See charts from the STOXX Developed World Equity Risk Monitor of September 12, 2025
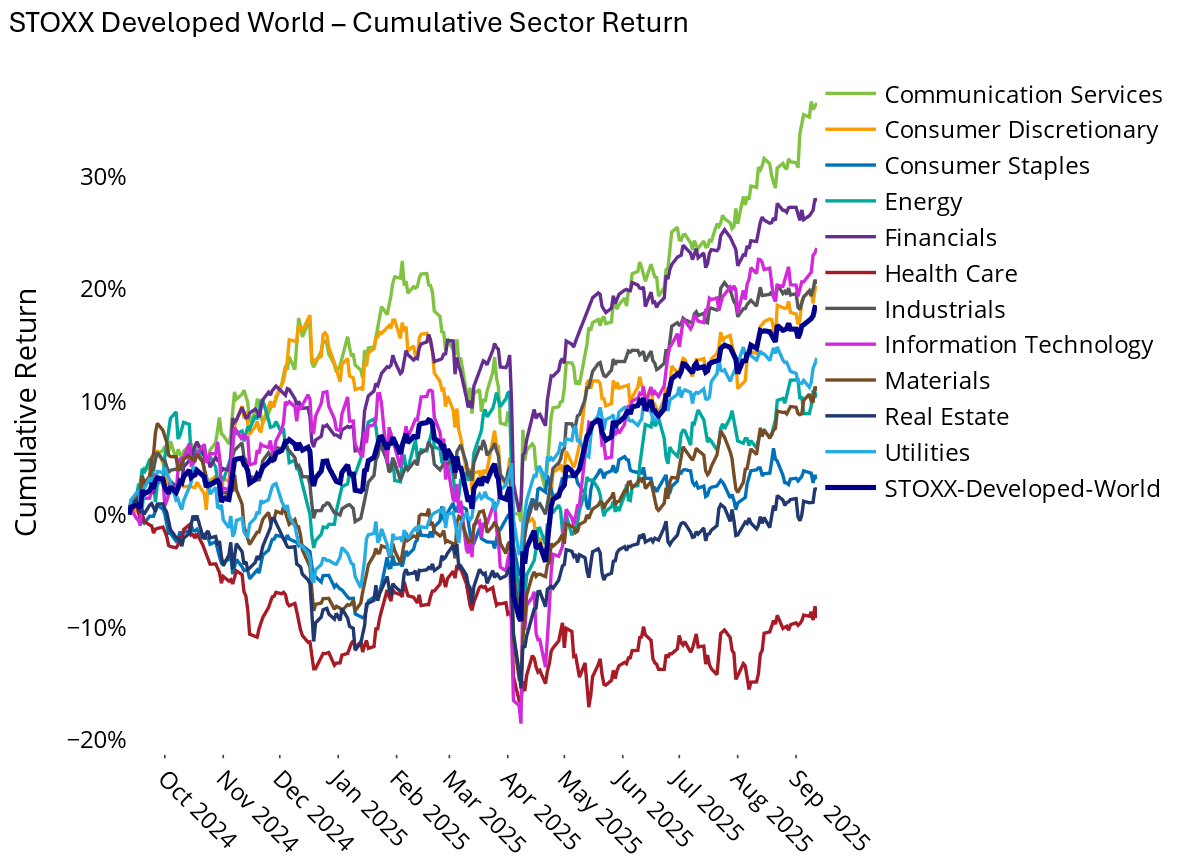
We can also see the lack of longer-term correlation among sectors, with a 55%+ performance spread between the best-(Communications Services +47%) and worst-performing (Health Care, -8.5%) sectors over the past 12 months. Again, this wide spread in sector performance is not just a US (and therefore Developed Markets) phenomenon. The magnitude of the difference between the best- and worst-performing sector is similar in many regional markets.
See chart from the STOXX Developed World Equity Risk Monitor of September 12, 2025
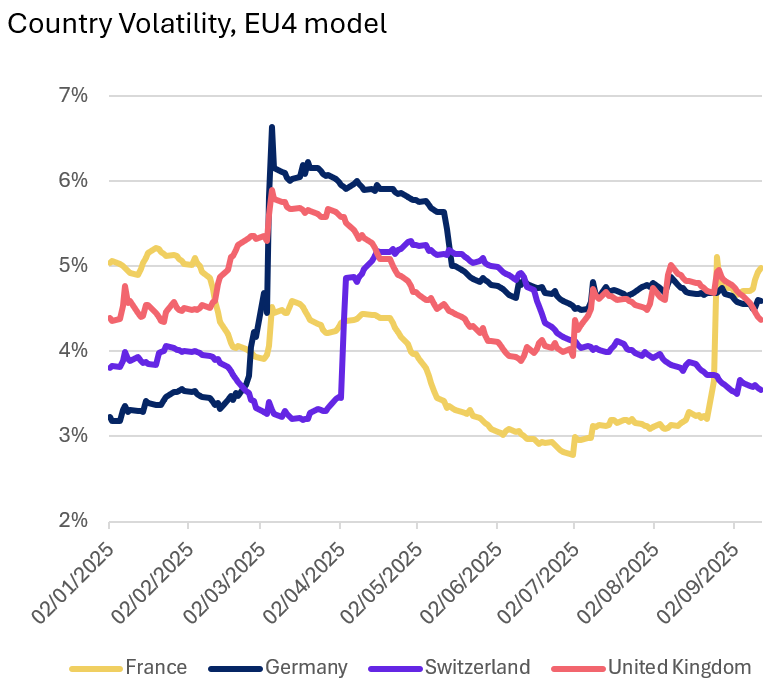
It is more difficult to find those underlying but offsetting increases and decreases in risk. One example can be seen in the predicted country risk of France versus the other three biggest countries in Europe. Country risk (that over and above the risk of all other European model factors) for the UK and Germany has remained fairly steady and Switzerland’s risk has dropped. So, a portfolio with an overweight in France may have seen active risk increase, even as total risk fell.
The following charts are not in the risk monitors but is available on request:
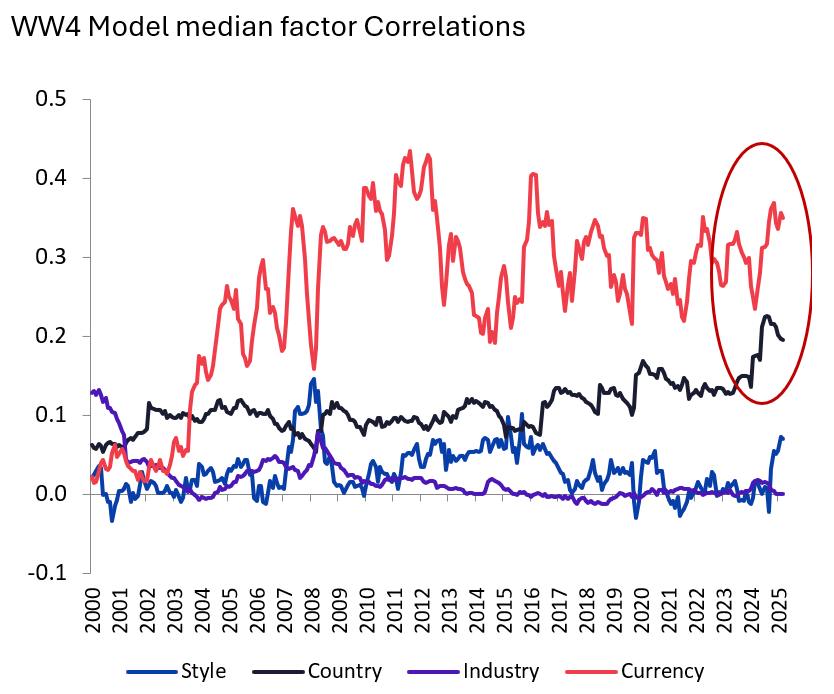
We also note that the median correlation across major currencies has increased, but the average country correlation has fallen:
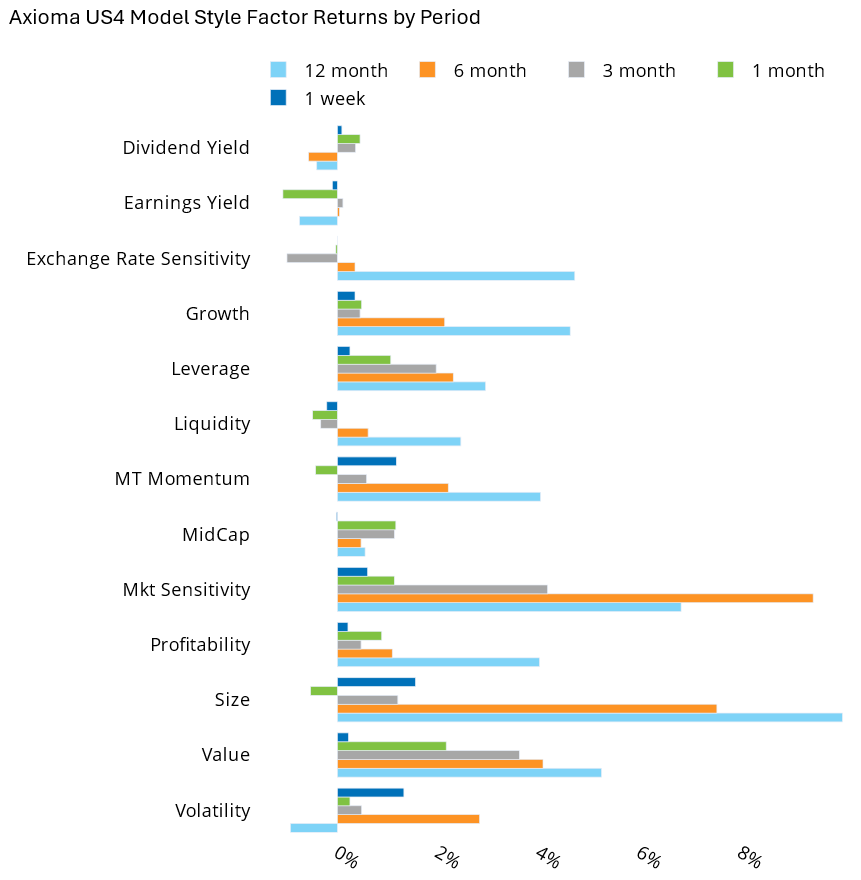
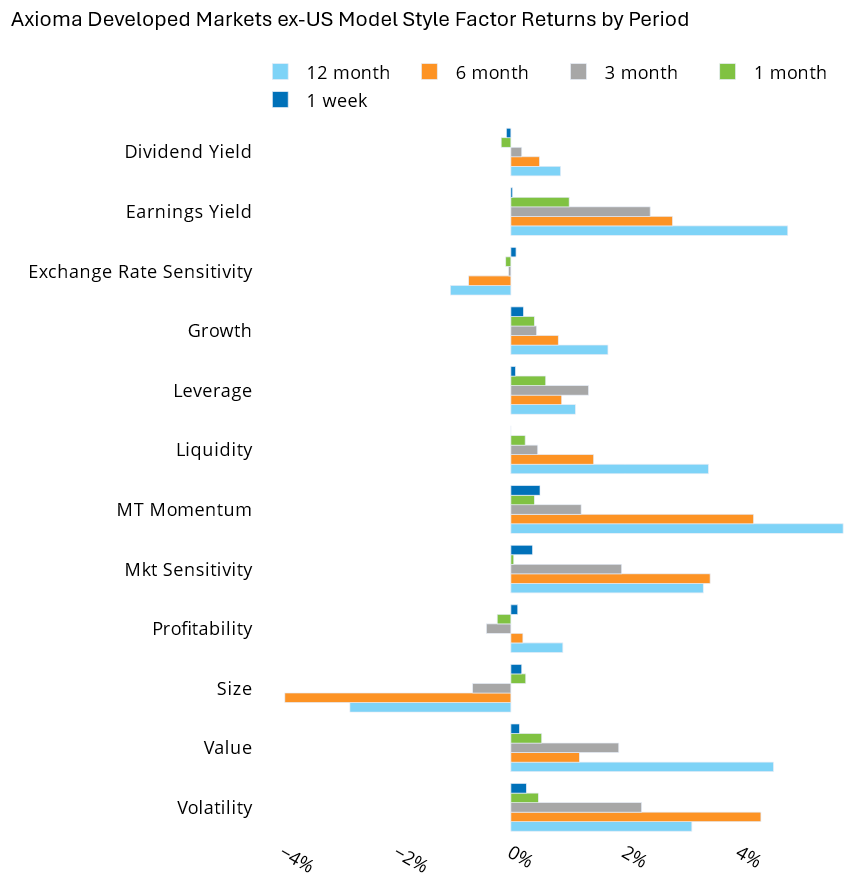
On the plus side, factors are largely behaving as expected. As some of our regular readers know, we view aberrant factor behavior as a canary in a coal mine – it suggests irrational behavior on the part of investors, and may therefore be signaling an aggregate change in investor views. On the heels of a strong bull market, that would suggest a change to the downside. But that does not seem to be the case now, as investors in and outside of the US seem to be favoring Value, Medium-Term Momentum, Earnings Yield (DMxUS), and Profitability (US). (Note that we have used the version 4 models here for comparison across regions, but the version 5 models show similar results, along with positive returns to Crowding in US5 and negative returns to Short Interest in both the US5 and WW5 models).
See charts from the STOXX US and STOXX International Developed Markets Equity Risk Monitor of September 12, 2025
You may also like


