

EQUITY RISK MONITOR HIGHLIGHTS
WEEK ENDED MARCH 6, 2026
- Geopolitical Risk Causes Increased Country Factor Risk
- In the US, Medium-Term Momentum and Value Become Correlated
- Investors Reprice AI’s Potential Effect on Software
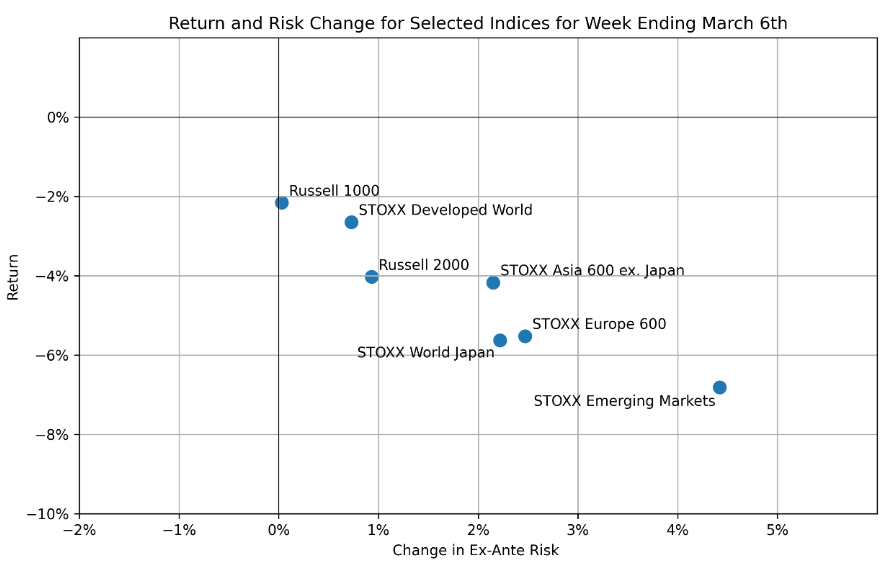
On February 28th, the turmoil in the Middle East and closure of the Strait of Hormuz disrupted a key global energy route and drove crude oil prices up. Global markets declined on inflation fears, causing broad pullback in risk appetite. Domestically, sell pressure was compounded by a weaker than expected U.S. jobs report, sending major stock indices lower by week’s end.
Among the indices we monitor, the STOXX Emerging Markets declined the furthest, returning -6.81% over the week. The STOXX Developed Markets fared better with a -2.65% return. Due to their reliance on Middle Eastern oil, indices with Asia exposure experienced significant headwinds, with the STOXX Japan returning -5.64% and the STOXX Asia ex. Japan returning -4.17%. All four of these indexes experienced increased risk as measured by our Axioma suite of Medium Horizon models.
The following chart is not included in the Equity Risk Monitors but is available on request:
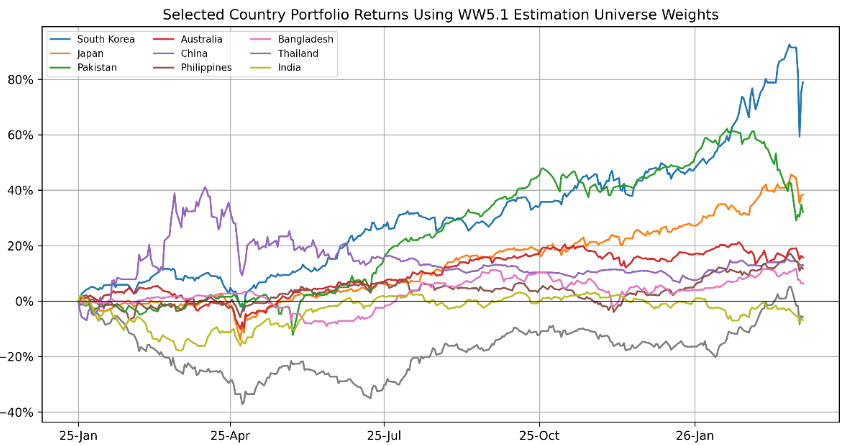
Geopolitical Risk Hits Country Factors
In order to take a deeper look at conflict’s effect on Asian markets, we created country portfolios using the estimation weights in our WW 5.1 model and measured their returns since the beginning of 2025. Over that period, the South Korean market has been especially hot due to the AI boom, but recently, that portfolio was most affected by the geopolitical conflict. Similarly, Japan’s market saw significant returns in 2025, and experienced steep negative returns over the last week, though less extreme than Korea.
The following chart is not included in the Equity Risk Monitors but is available on request:
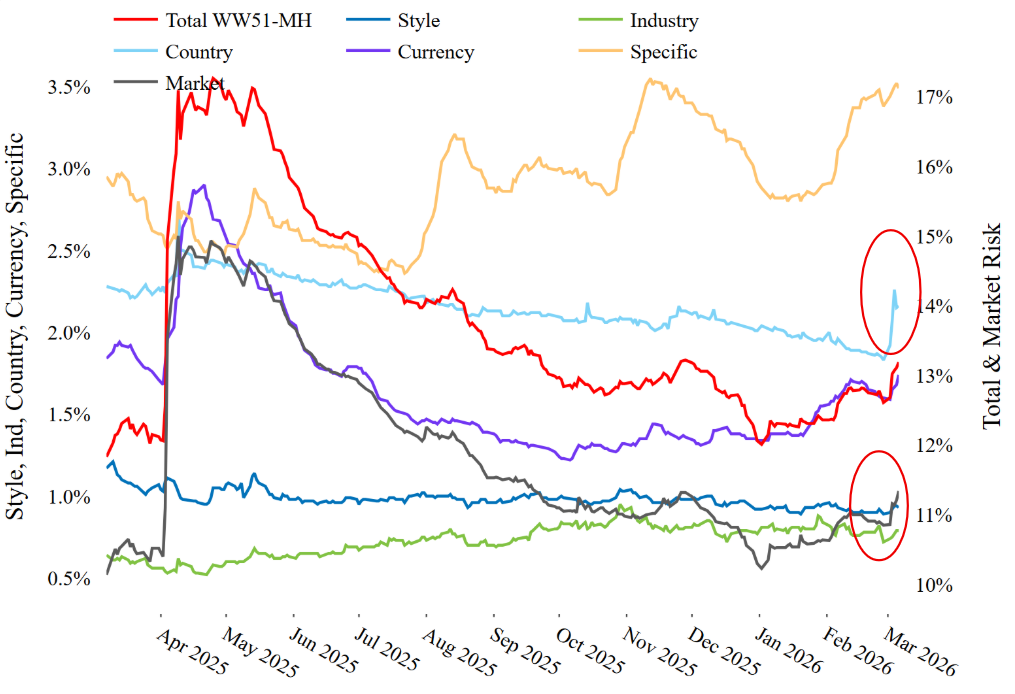
This jibes with our risk decomposition of the STOXX Developed Index using the WW 5.1 Medium Horizon model—the increase in total risk is primarily due to the steep increase in the Market and Country factors.
See chart from the STOXX Developed – WW5.1 Equity Risk Monitor as of March 6th, 2026
STOXX Developed – Components of Risk
Asia-focused investors who have benefited from equity appreciation in Japan and South Korea might have a tough time managing this Country factor risk since many of the countries in the universe are subject to the same forces. To illustrate this, here are the correlations of the South Korea Country factor to the other Country factors in the region:
The following chart is not included in the Equity Risk Monitors but is available on request:
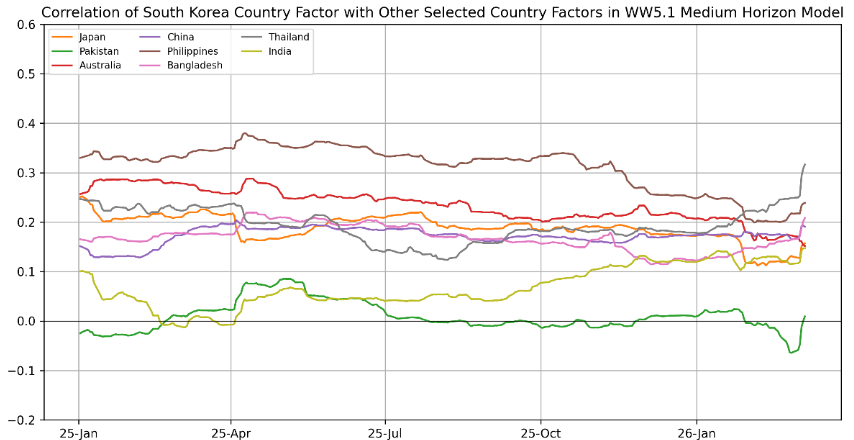
If regional instability continues, we expect Country factor risk to continue to increase due to both rising volatility and increasing correlations, and thus, portfolio managers should monitor their Country factor exposures closely.
Medium-Term Momentum and Value in the United States
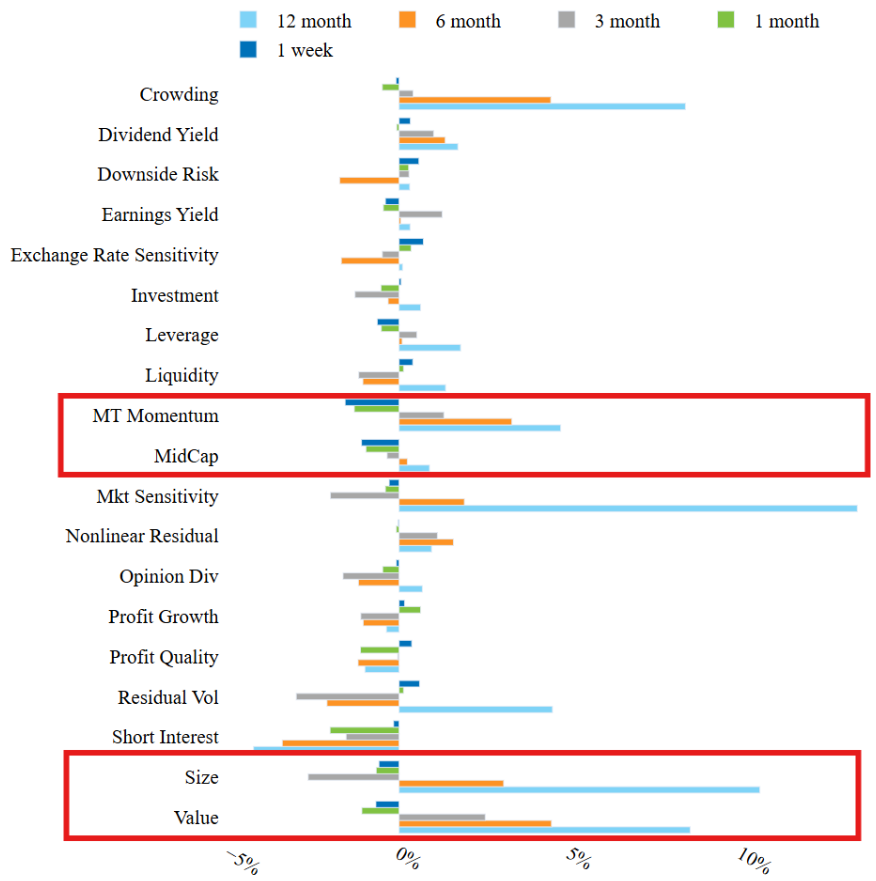
While the impact on international markets was higher, the geopolitical headlines also negatively affected returns domestically, with the Russell 1000 and Russell 2000 returning -2.16% and -4.03%, respectively. Looking at our US 5.1 Style Factor returns, we see that the largest one week moves occurred in the Size-related factors (i.e. Size and Mid-Cap), Medium-Term Momentum, and Value.
See chart from the Russell 1000 – US5.1 Equity Risk Monitor as of March 6th, 2026
Russell 1000 – Axioma US Model Style Factor Returns by Period
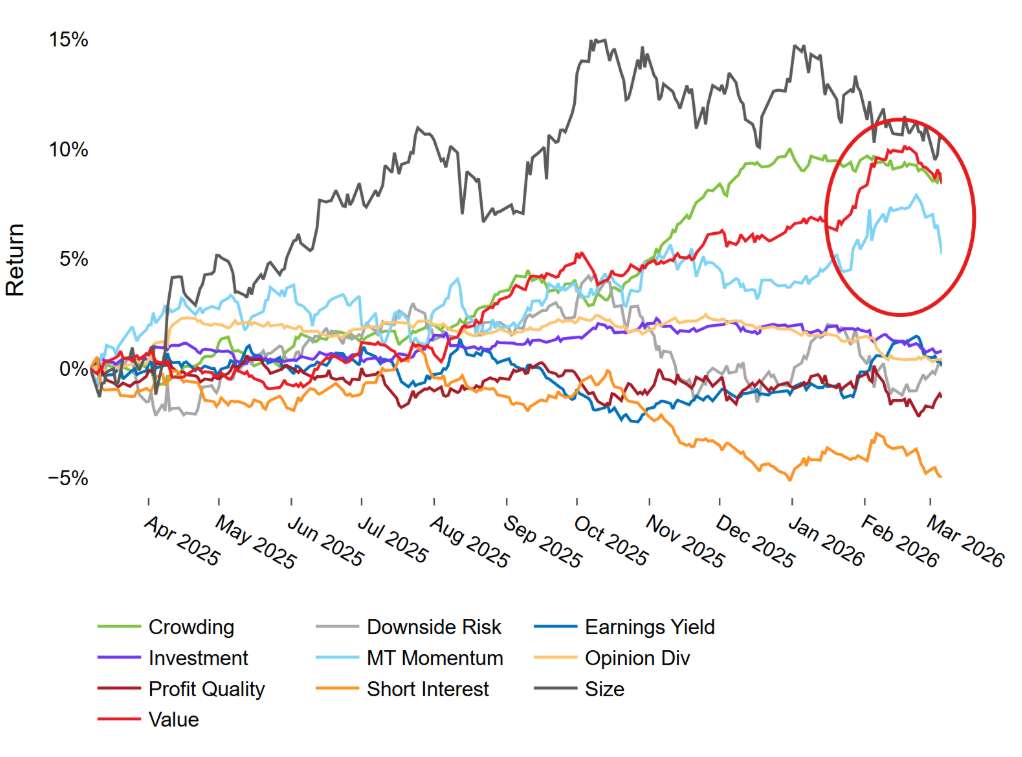
Looking at the returns over longer period, we can see that the Medium-Term Momentum and Value factors have seen returns increasing and declining in tandem over the past few weeks.
See chart from the Russell 1000 – US5.1 Equity Risk Monitor as of March 6th, 2026
Russell 1000 – Compensated Risk Factors
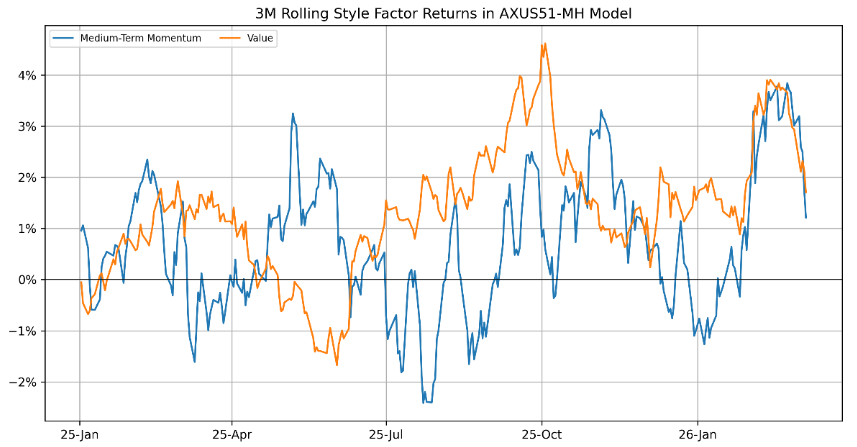
The co-movement between the two factors is more pronounced when we increase the period for the rolling factor returns.
The following chart is not included in the Equity Risk Monitors but is available on request:
If we calculate the correlation between the two factor returns using the model’s standard 1-year horizon, we see that since the start of the year, these two factors are the most correlated they have been since late 2024 and are experiencing a sharp increase.
The following chart is not included in the Equity Risk Monitors but is available on request:
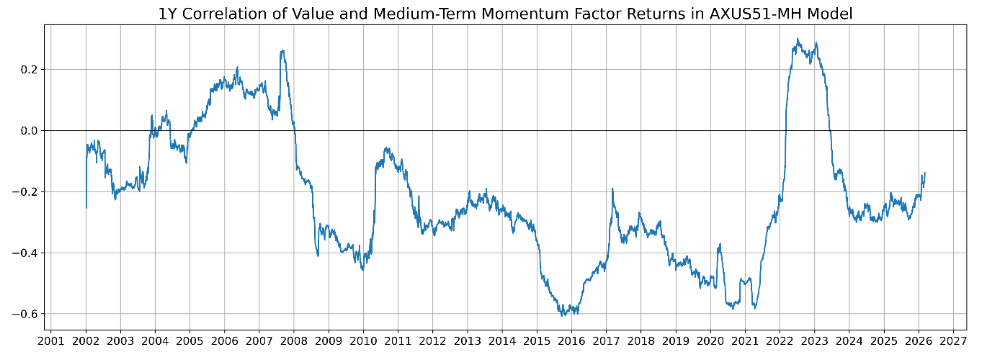
When Value and Momentum become correlated, quantitative stock picking models frequently have trouble. The US 5.1 model measures Value as Price to Book and Medium-Term Momentum as the 12 month trailing price return (net of the most recent month due to the Price Reversal anomaly). As a result, you can think of the exposure of Medium-Term Momentum as close to the first derivative of Value’s numerator. Thus, the market does not tend to reward or penalize firms with exposure to both factors at the same time, since an increase in one of these factor is associated with the decrease in the other and vice versa (and if this sounds familiar, you might have read it in our Weekly Highlights from February 20, 2026 where we not that exposure correlations between the two have been consistently negative). Quantitative alpha models take advantage of this mild negative return correlation by combining these two types of factors, in turn hedging risk while still capturing alpha. Currently, the 1-year correlation of these two factors is still comfortably negative, but if the increase in return correlation continues, we could see headwinds for quant strategies.
Investors Reprice AI’s Potential Effect on Software
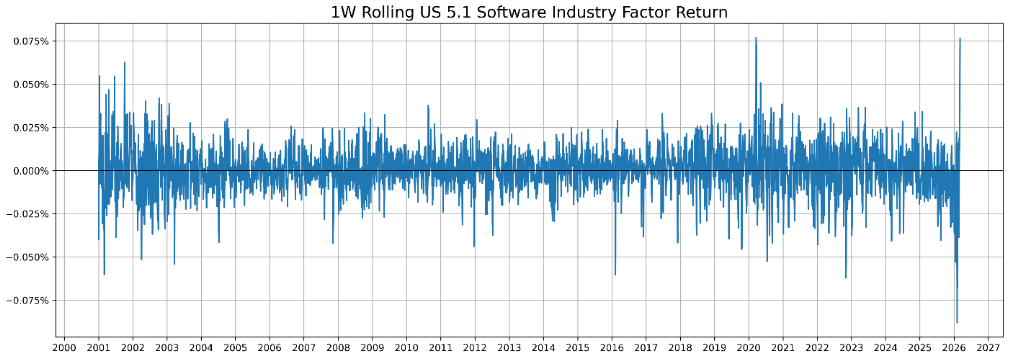
Last week, market commentators turned their attention to the Middle East, but it seems that market participants took advantage of the broad market sell off in order to buy discounted Software firms. Last week, the US 5.1 Software Industry factor had its second best 1-week return ever. The only higher 1-week return occurred during the early COVID period—though we should note that we do not include the Dot-com bubble.
The following chart is not included in the Equity Risk Monitors but is available on request:
Still, the Software sell-off is still deeply negative despite the upswing, which we can see when we compound these returns over a longer period:
The following chart is not included in the Equity Risk Monitors but is available on request:
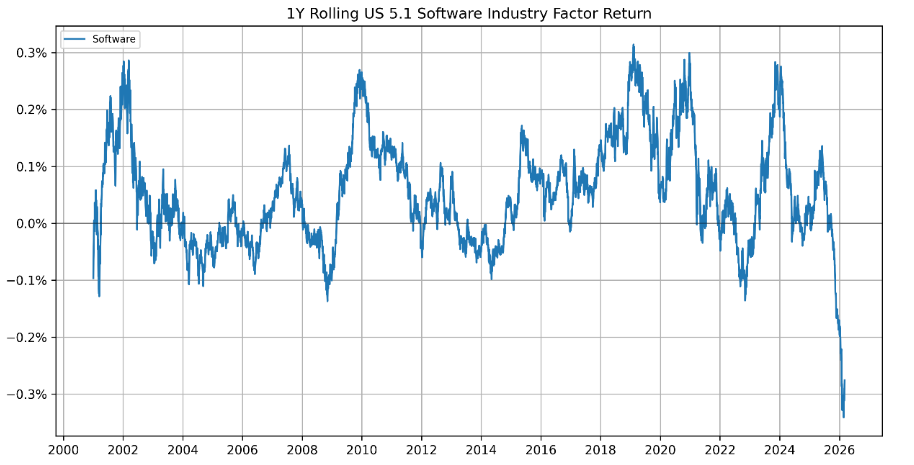
It is still unclear if we’ve hit the bottom of the Software trough, but it seems that at least some investors are reconsidering generative AI’s ability to commoditize Software generally, and we will monitor this factor’s returns in the coming weeks.
You may also like


