

EQUITY RISK MONITOR HIGHLIGHTS
WEEK ENDED FEBRUARY 20, 2026
- Momentum is shifting, but where is it going?
- Short-horizon risk, especially statistical, is starting to tick up
- Style factor returns are largely in the “right” direction, but some have higher magnitude than expected
Momentum is shifting, but where is it going?
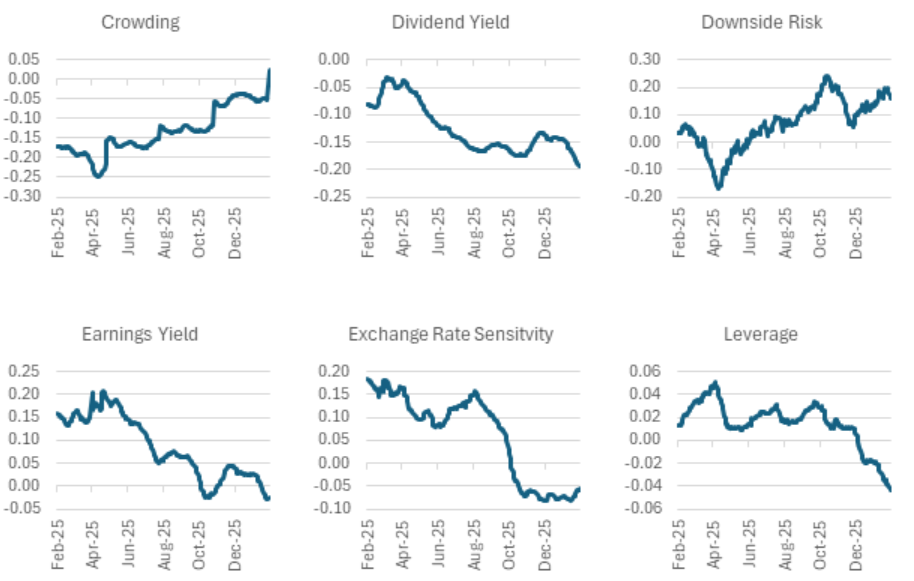
There has been a lot of rotation in the market this year – to smaller names, to lower volatility, from AI to “not-AI”, etc. We thought it might be interesting to look at where momentum might be increasing or decreasing, by calculating exposure correlations between style factors in our medium-horizon US5.1 model and the Medium-Term Momentum factor (just called Momentum from here on).
A positive correlation with Momentum (as we see for Market Sensitivity) indicates a high exposure to the factor has good momentum, and an increasing correlation (e.g. as we observe between Crowding and Momentum) means the crowding exposure is gaining momentum and/or that Momentum is getting more crowded.
Alternately, a decreasing exposure – such as we see between Earnings Yield and Momentum – could mean that high momentum stocks are getting more expensive, or that Earnings Yield is losing steam. Historically Value (book/price) has been negatively correlated with Momentum, and that relationship still holds, and has been steadier than the relationship of Momentum with most other factors.
There are a number of factors for which the exposure correlation has changed by more than 0.25, and quite a few where the sign of the correlation has changed. Also worth noting is that the correlation between Size and Momentum has fallen, but perhaps by less than expected given the rotation into smaller names. In addition, by the end of last week the correlation, while low, remained positive.
Below are charts of the daily exposures for the last year for most of the model factors. Some observations: The biggest difference peak-to-trough in correlation with Momentum was seen in Downside Risk, where the correlation also went from negative to positive – so for most of this period higher Downside Risk meant higher Momentum and/or that Momentum was becoming riskier (as defined by Downside Risk). Similarly, Residual Volatility and Momentum became steadily more correlated over the past year.
Exchange Rate Sensitivity lost Momentum over the period, and the exposure went from positive to slightly negative meaning stocks that do well in a rising dollar environment lost Momentum as the dollar has fallen. High Profit Growth and High Profit Quality both lost steam, with the correlation for the latter turning negative. High Leverage now means lower Momentum, another indication that investors are moving toward lower risk equities – although that is not universally true, as the correlation between Dividend Yield and Momentum has also dropped. Finally, the correlation between Momentum and Short Interest has bounced around, falling late last year but increasing slightly as we moved into 2026.
The following charts do not appear in the equity risk monitors but are available on request:
Exposure correlations with Medium-Term Momentum, US Estimation Universe, US5.1 Medium-Horizon Model
Short-horizon risk, especially statistical, is starting to tick up
Last week proved to be eventful, with a consequential Supreme Court decision about the administration’s ability to impose tariffs coming on the same day when other news might have dominated the news cycle: a relatively sluggish GDP report and higher-than-hoped-for PCE number. The short-term reaction to all three was likely muddled together, as the tariff decision could be seen as good news while the other two reports suggested “stagflation” could be rearing its ugly head.
Still, the US large cap market was up on Friday, although it underperformed Canada and Europe, and US small cap stocks were down. (For a thorough analysis of why smaller US stocks may continue their near-term outperformance despite Friday’s shortfall see our recent analysis “The Factors Fueling Small Cap Strength” which you can find here.)
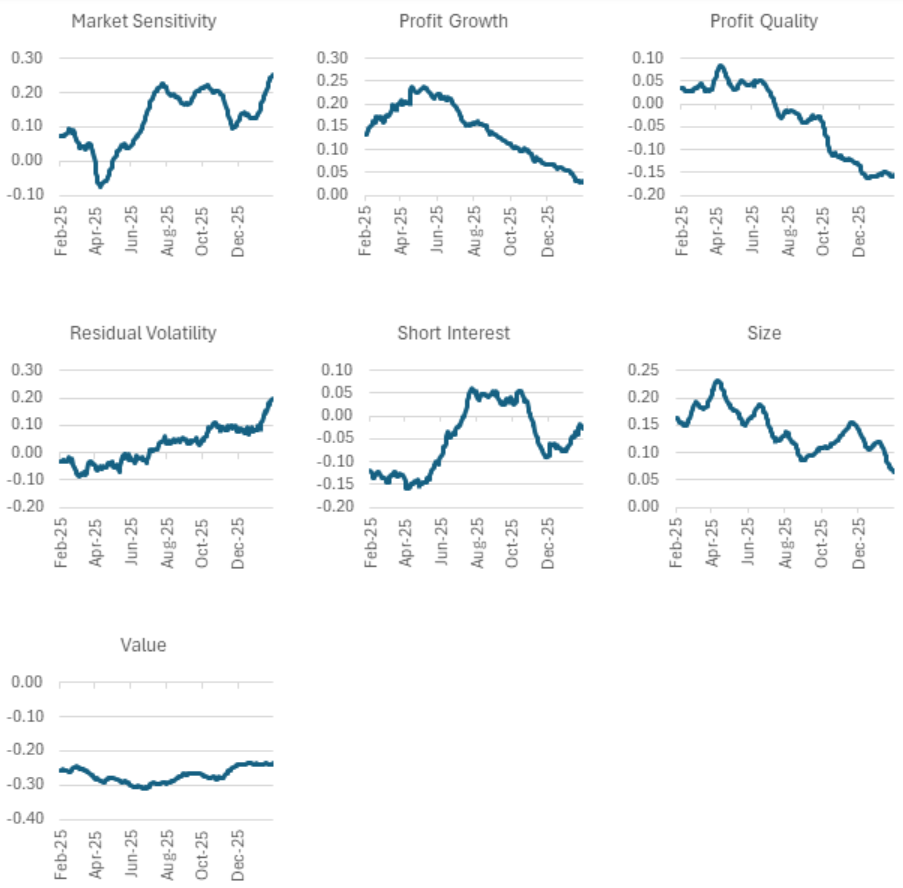
As we have written in recent weeks, it remains curious that predicted volatility remains so low, despite economic and increasing geopolitical concerns. For many indices we attribute the low and declining risk to a substantial decrease in asset-asset correlations that have persisted even as stock volatility has risen for months (see, for example, our Equity Highlights from January 23 of this year here).
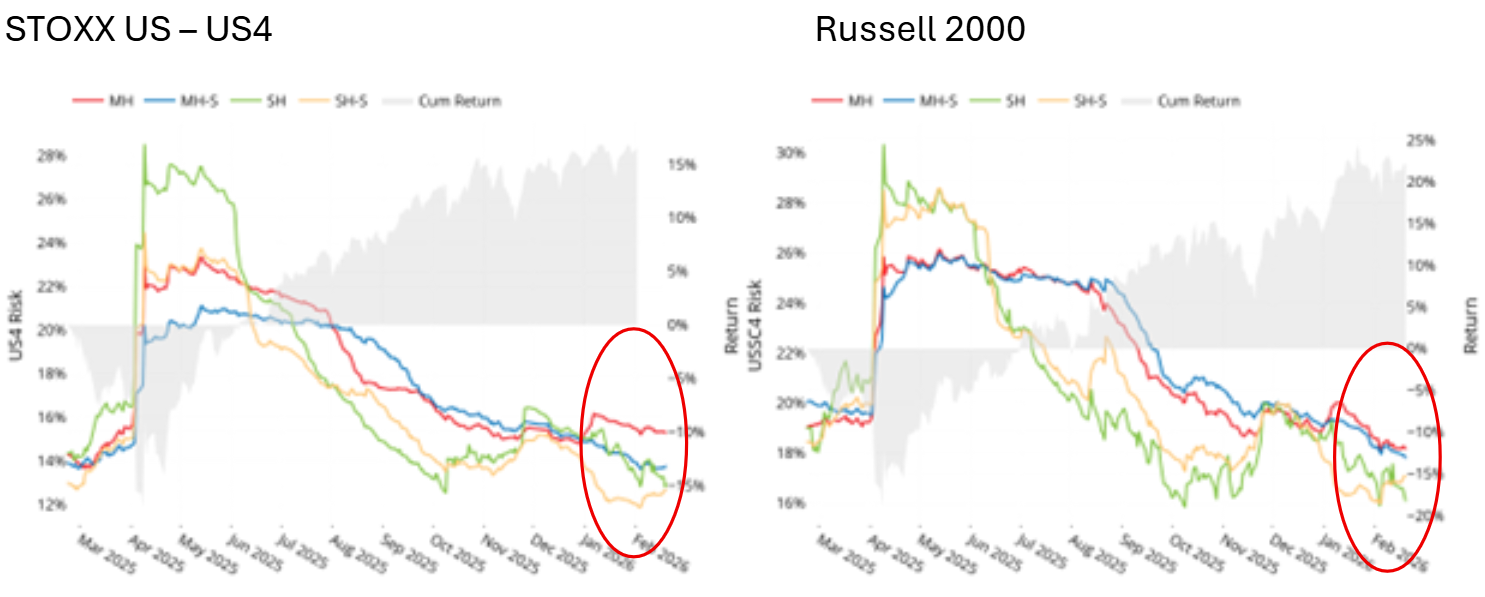
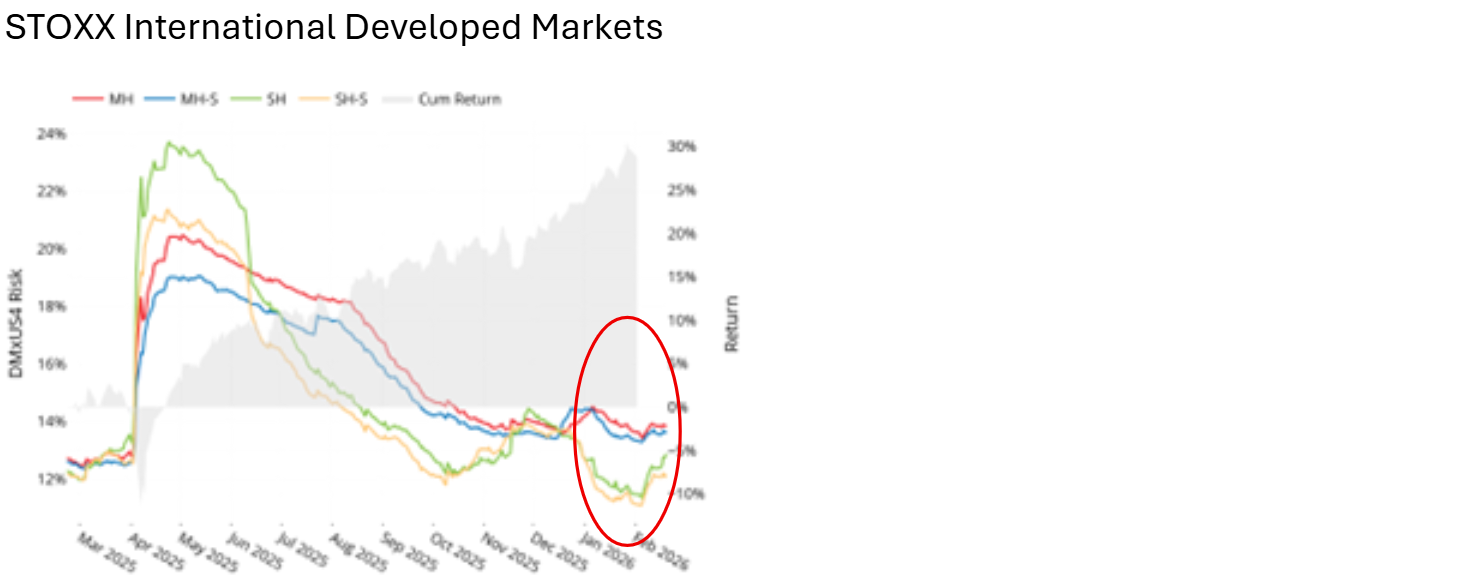
In some markets, we have seen evidence that risk according to Axioma’s short-horizon models may be turning back up, especially according to the statistical version. For the STOXX US index, using the Axioma US4 model, the short-horizon statistical variant’s forecast caught up with the fundamental variant’s by the end of last week. For the Russell 2000, while risk remains low, the short-horizon statistical variant forecast crept ahead of its fundamental counterpart last week. In Australia and Canada, the spread between statistical and fundamental has been positive since early February and at the same time risk has ticked up. Unlike what we see in the US, short-horizon risk for both model structures has started to rise for the STOXX International Developed Markets index (Developed Markets ex-US).
To be sure, these forecasts are a lot lower than they were around “Liberation Day”, but the positive spread suggests the statistical models may see an emerging risk not uncovered by the fundamental models.
See charts from STOXX US, Russell 2000, STOXX Canada, STOXX Australia and STOXX International Developed Markets Equity Risk Monitors as of February 20, 2026:
Predicted Risk
Style factor returns are largely in the “right” direction, but some have higher magnitude than expected
In our past two editions (see here and here) of these Equity Highlights we emphasized the unusual number of days that daily returns for the US5.1 equity style factors fell outside a two-standard deviation band, while tending to offset each other from one day to another, meaning that weekly returns remained within expected bounds. We have not seen the same level of daily ups and downs in most of the various version 4 models.
However, we have observed that a number of the factors’ monthly returns have fallen outside of that range, especially in the Worldwide and Developed Markets ex-US models. While some returns may be large in magnitude, in most cases they have been in the “right” or expected direction, based on the long-term average return. In other words, returns to Earnings Yield, Medium-Term Momentum, Profitability and Value have been positive, with Value exceeded the two-standard deviation band in most regions.
At the same time, Market Sensitivity and Volatility have experienced negative returns. Size has been mixed across regions: negative in the US, Canada, UK, Japan and China, but positive elsewhere. This should be welcome news for managers tilting on these factors.
The following table does not appear in the equity risk monitors but is available on request:
Factor returns for the month ending February 20, 2026 for Axioma version 4 risk models
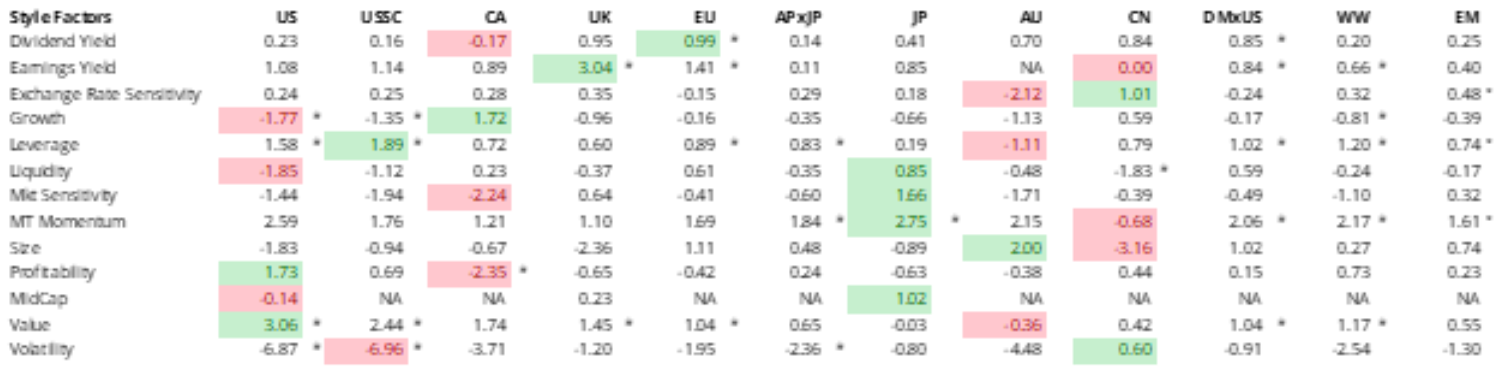
Notes: highest country/regional factor return is noted in green and lowest in pink. An asterisk next to the factor return indicates it was outside of the two standard deviation band, with standard deviation defined as the expected volatility from the risk model at the beginning of the month.
You may also like


