

EQUITY RISK MONITOR HIGHLIGHTS
WEEK ENDED APRIL 24, 2026
Equity Highlights for the week ended April 24th, 2026
- Nobody Puts the Market Factor in the Corner
- No Appetite for Creative Destruction
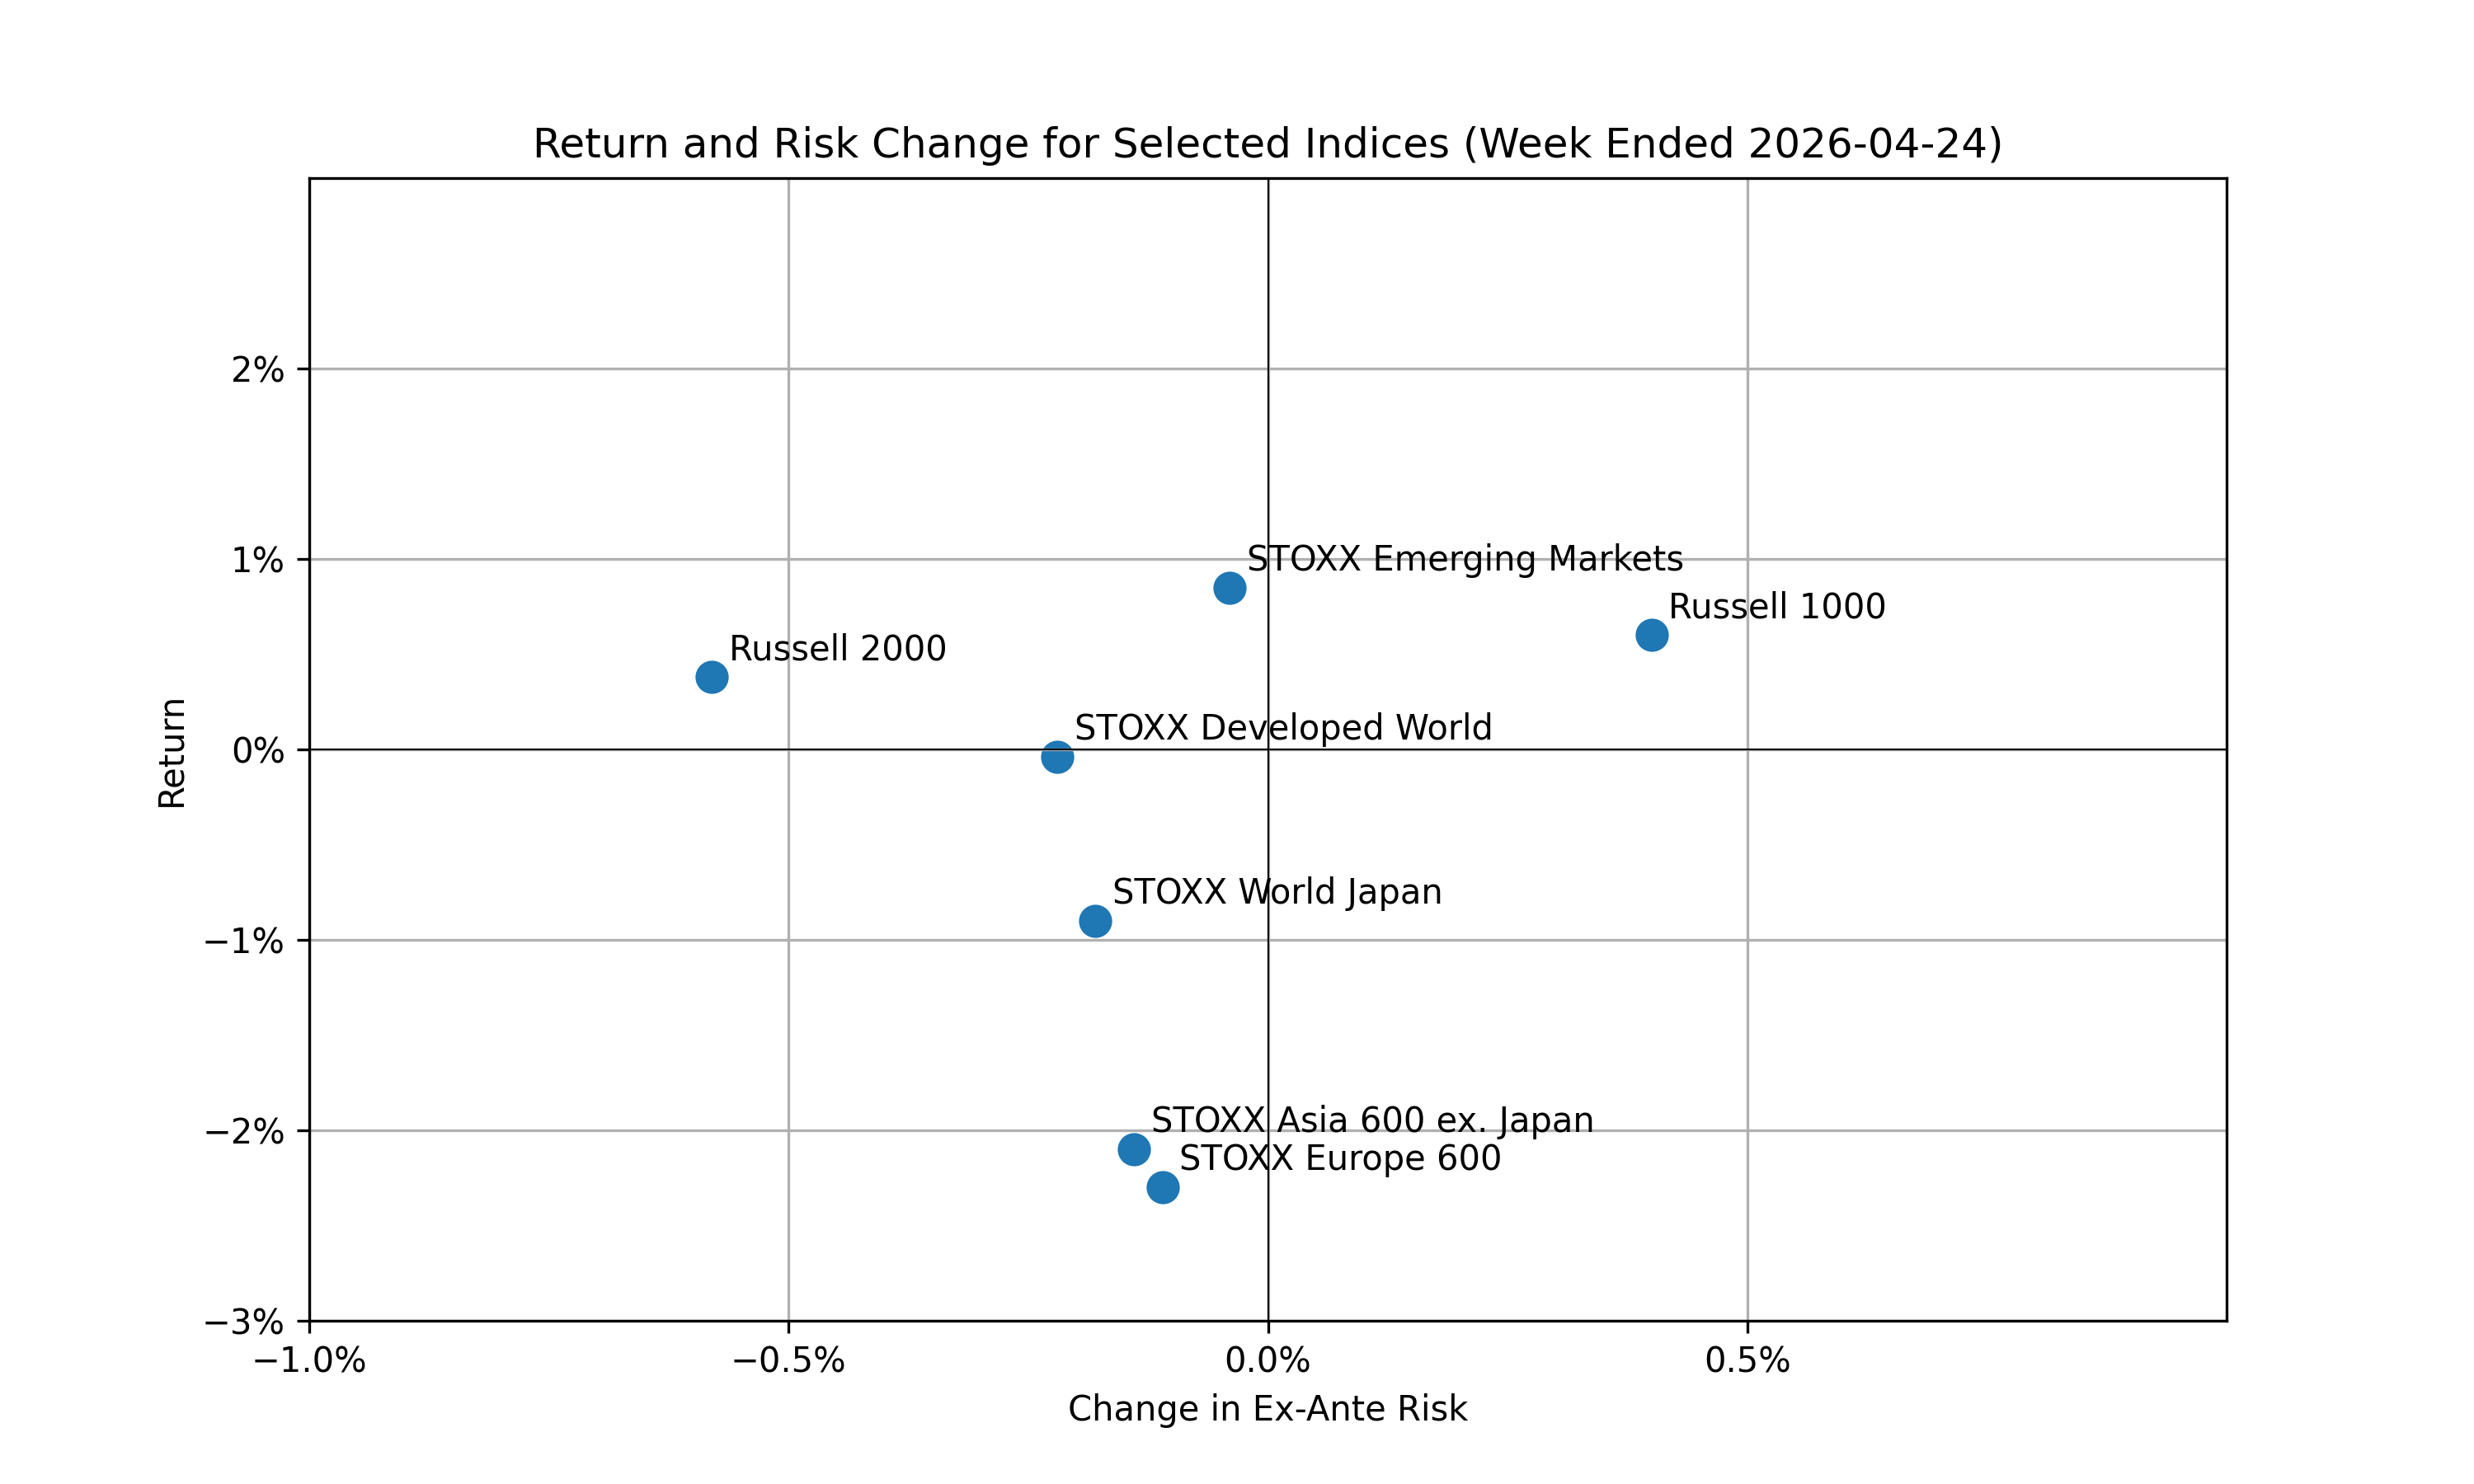
Last week, United States earnings season marched on, Brent crude breached $100 per barrel, and Kevin Warsh inched closer to confirmation. Despite historical lows in consumer sentiment, US equity market indices continued to approach all-time highs, with the Russell 1000 and 2000 posting 60bp and 38bp gains respectively. However, according to our Axioma Risk Models, the Russell 1000’s ex-ante risk ticked up 40bps while the Russell 2000’s risk decreased 58bps.
Among the international indices we monitor, the STOXX Asia 600 ex. Japan and the STOXX Europe 600 saw prices fall the furthest, with both decreasing more than 2%. The STOXX Emerging Markets was the only non-US index to post a gain over the week, increasing 85bps.
The following chart is not included in the Equity Risk Monitors but is available on request:
Nobody Puts the Market Factor in the Corner
If we take a closer look at the risk of the STOXX Europe 600 since the closing of the Strait of Hormuz, we see that the majority of the increase is coming from the Market factor.
See chart from STOXX Europe 600 – Axioma Europe 4 Equity Risk Monitor as of April 24th, 2026
STOXX Europe 600 – Components of Risk
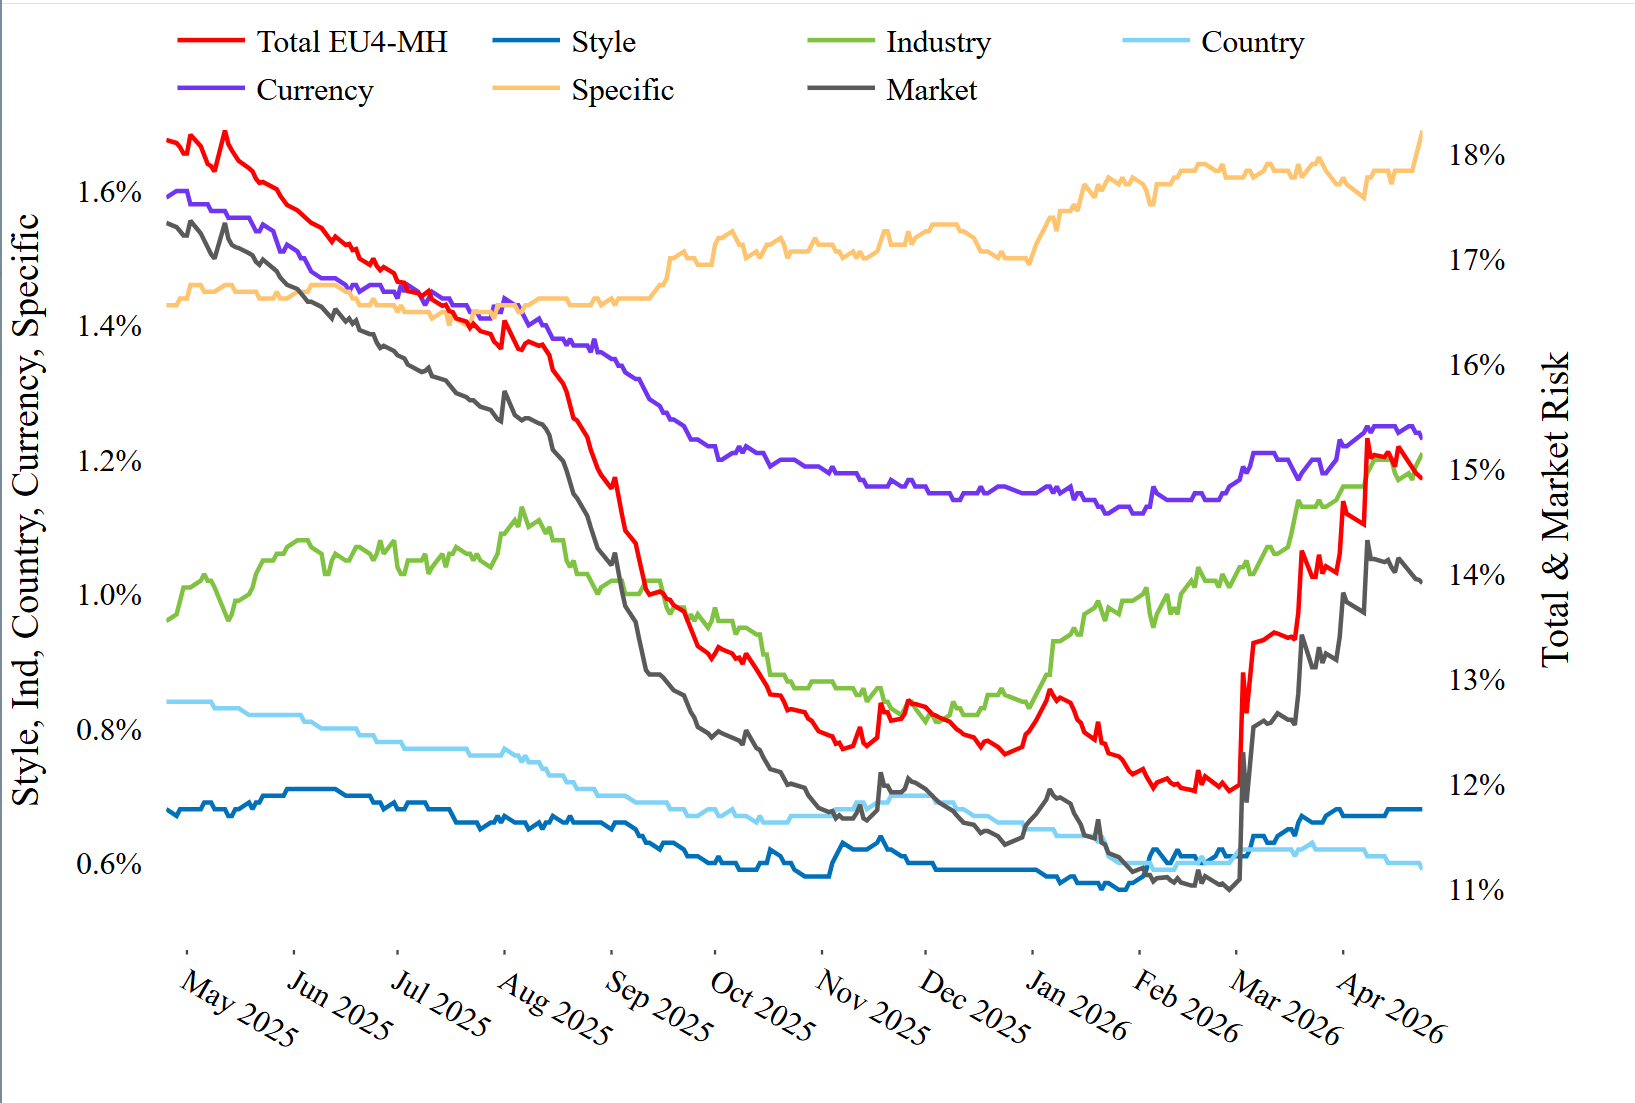
The Market factor sometimes feels like a second-class citizen—active managers safely ignore it and risk analytics can struggle to explain the intuition behind it. However, the recent geopolitical situation gives us a great opportunity to think more deeply about the Market factor.
In short, a model’s market factor captures the risk inherent to all securities in that risk model, and if we look across different models, we can see how the market views the risk of different regions.
The following chart is not included in the Equity Risk Monitors but is available on request:
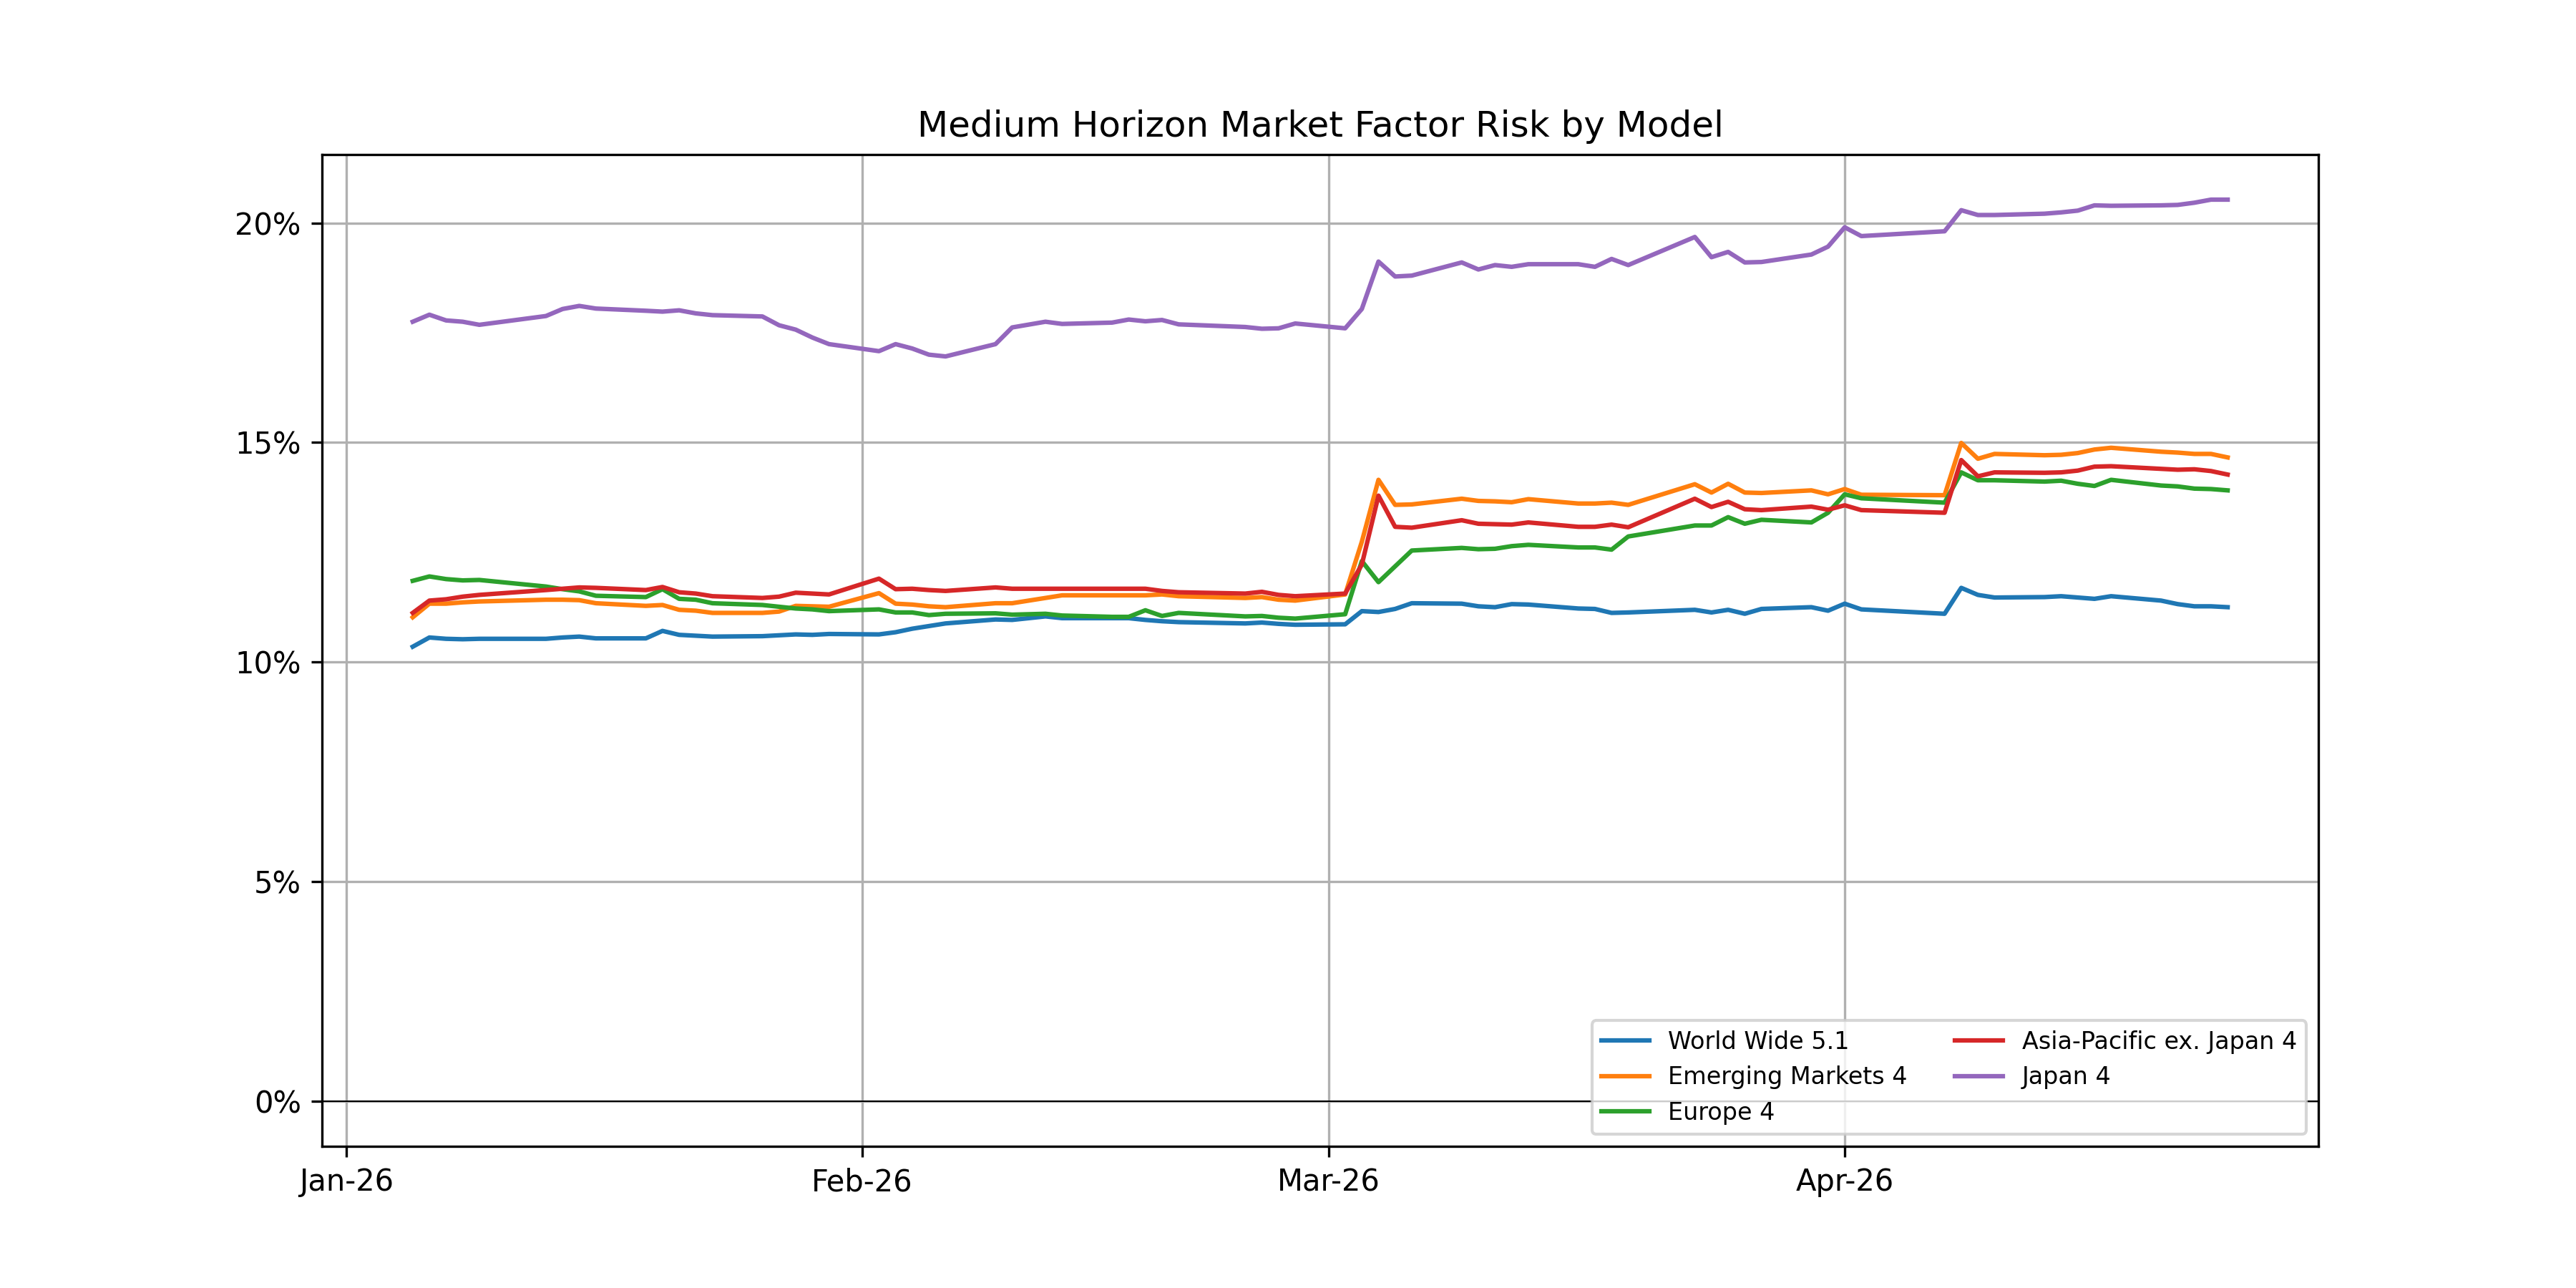
Eagle-eyed readers will spot that the World-Wide 5.1 model’s Market Factor Risk did not increase in early March, which might seem odd. Clearly, the same geopolitical risks that affect these other regions should affect the World-Wide model, right?
Well, we need to ask if war in the Middle East is risk inherent to all securities in that risk model. If we look at these models’ Country factor risk, we can see that in the World-Wide model, this risk only maps to some countries and not the entire model universe:
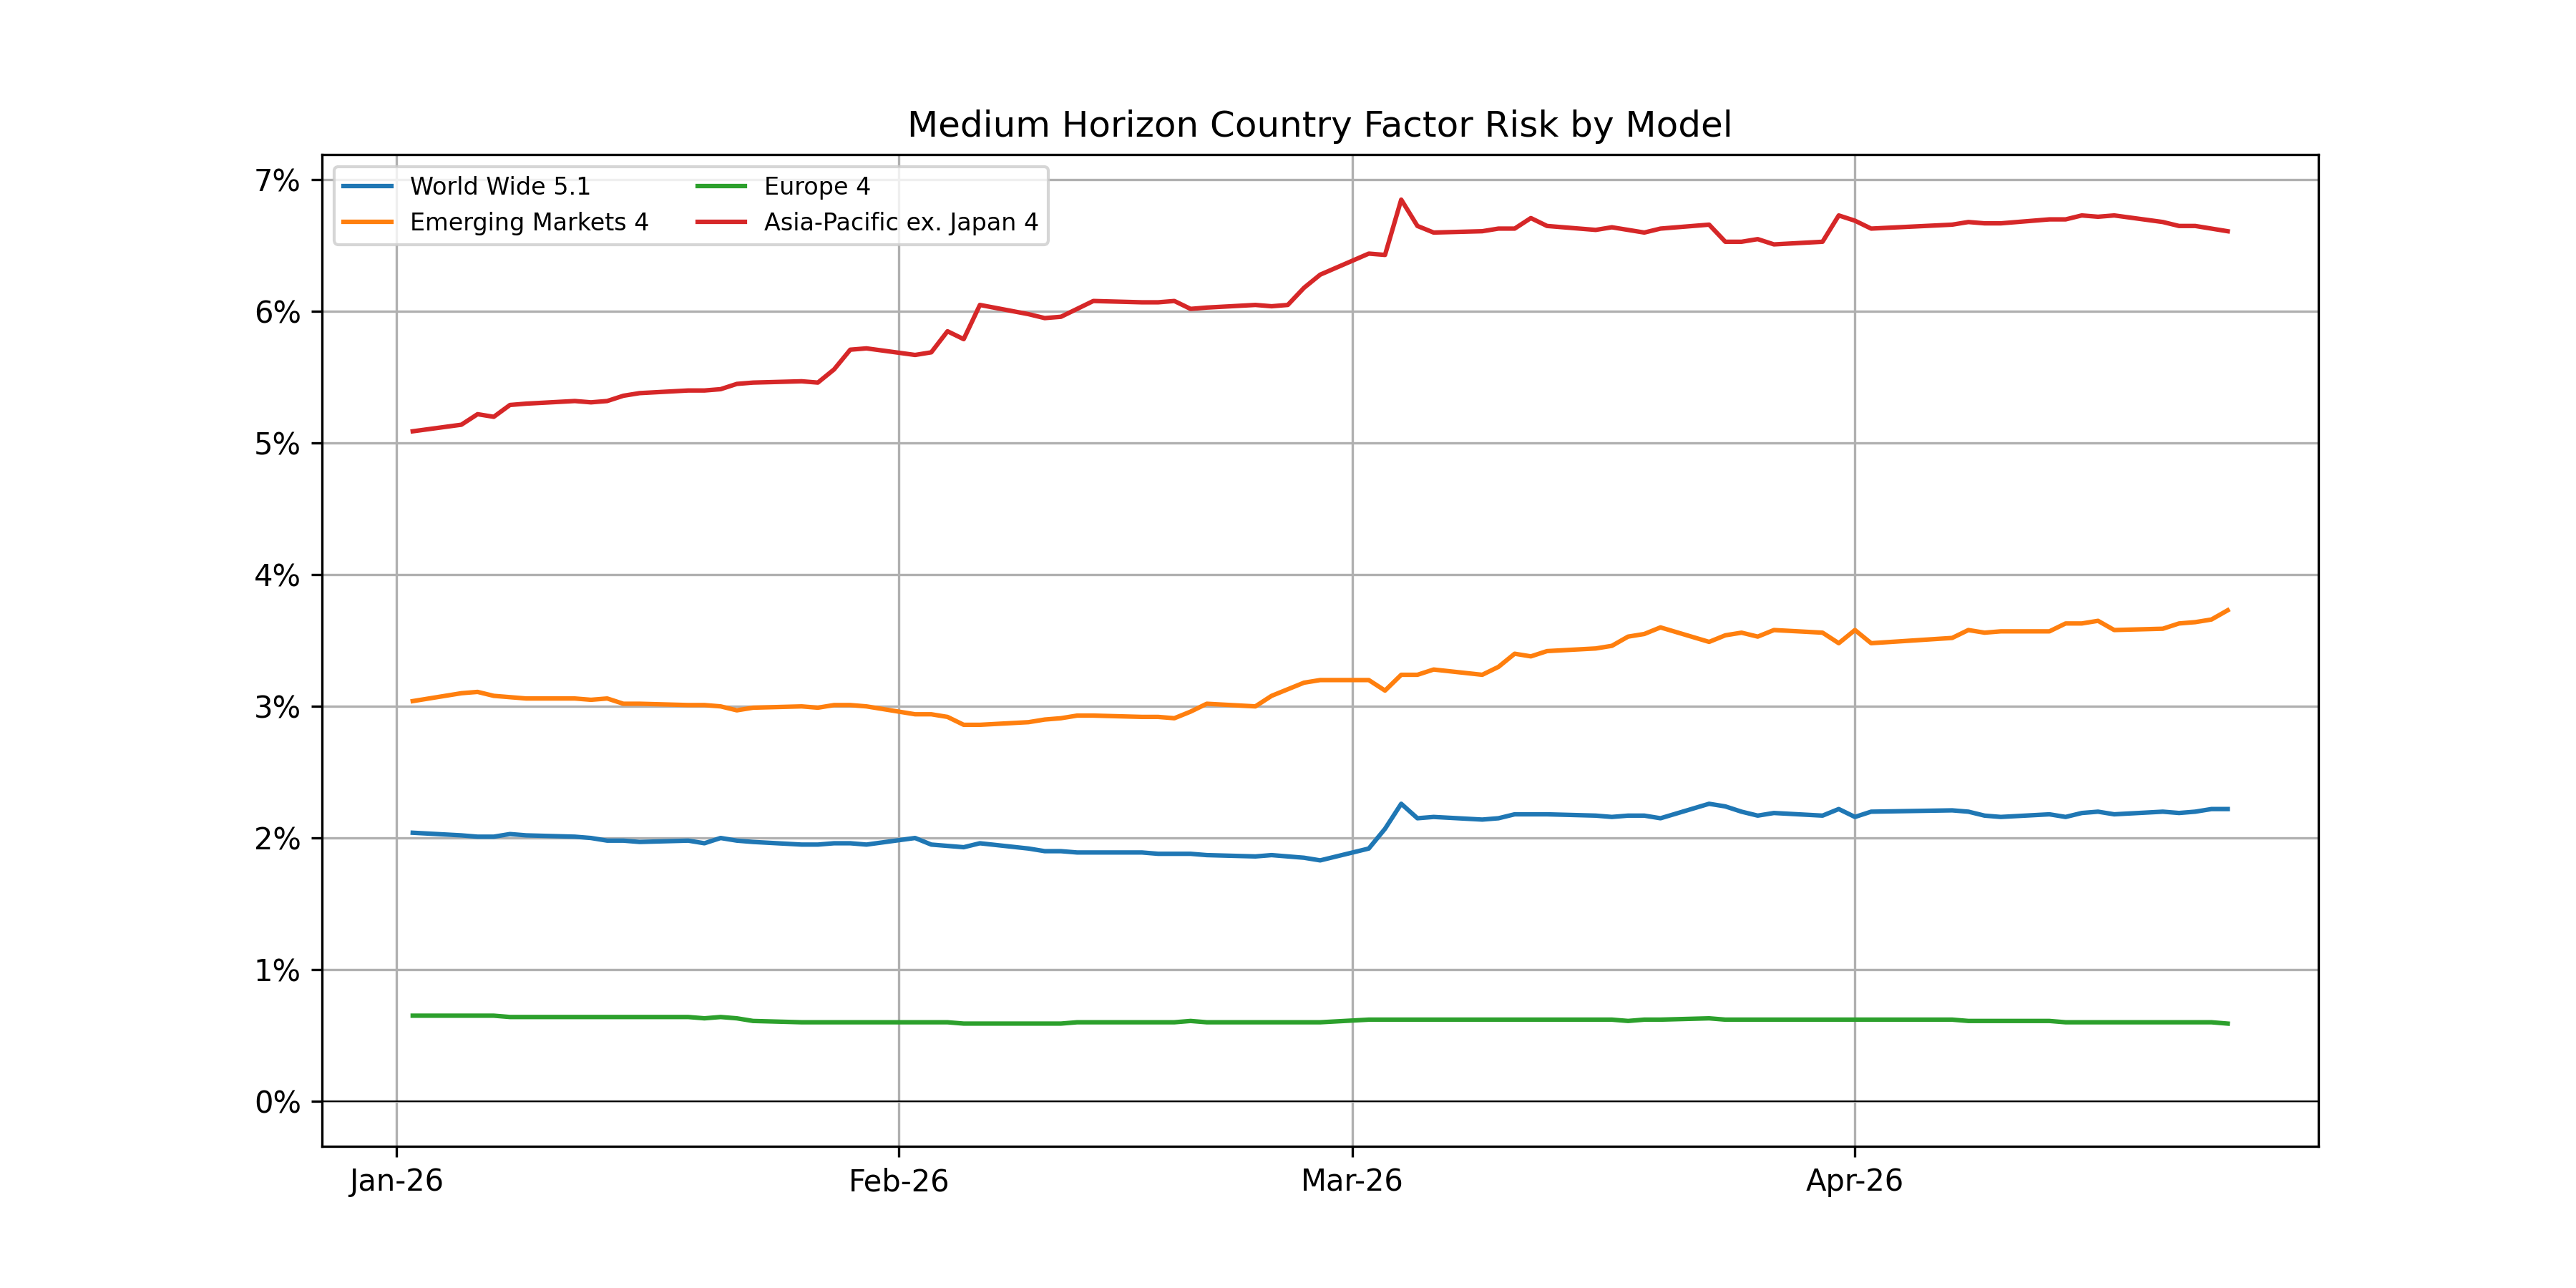
Frequently, comparison across risk models is necessary for understanding a single model’s behavior. We have written about the benefit of using multiple risk models in the past, and the past few weeks have provided another great example.
No Appetite for Creative Destruction
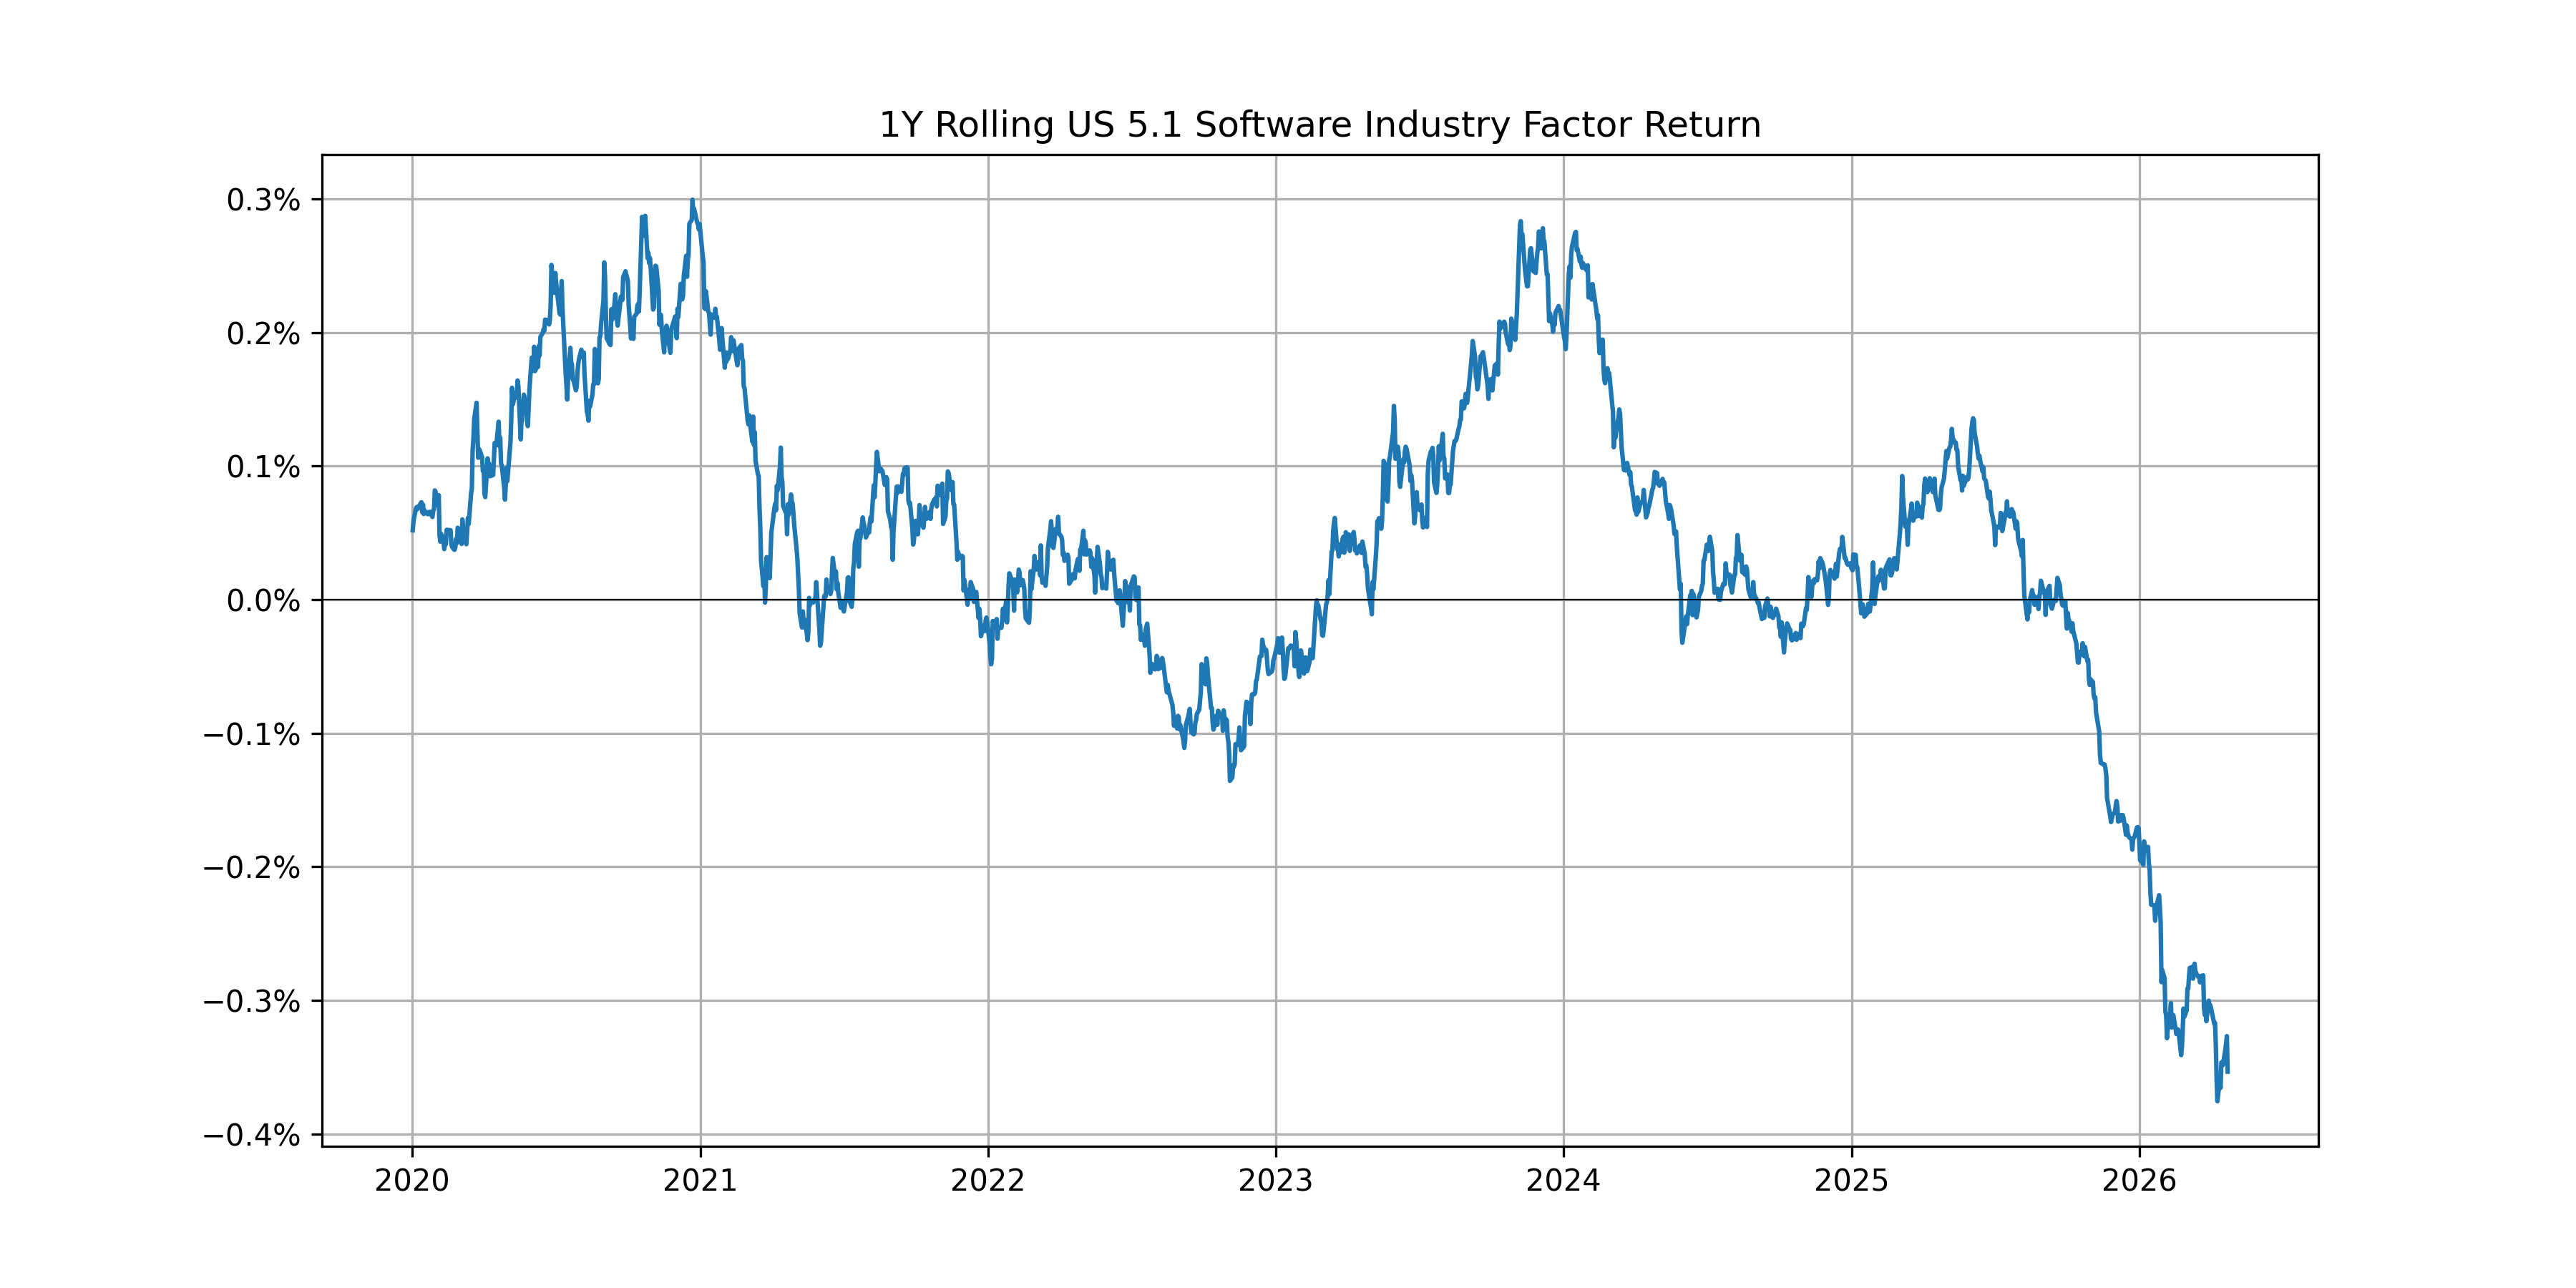
Back in March we took a look at the Software sell-off and concluded with a chart showing the magnitude of the drop. At the time, we remarked that
It is still unclear if we’ve hit the bottom of the Software trough, but it seems that at least some investors are reconsidering generative AI’s ability to commoditize Software generally, and we will monitor this factor’s returns in the coming weeks.
Six weeks later, it is clear that the increase was short lived, and the Software factor return in our United States 5.1 Risk Model is still falling:
The following chart is not included in the Equity Risk Monitors but is available on request:
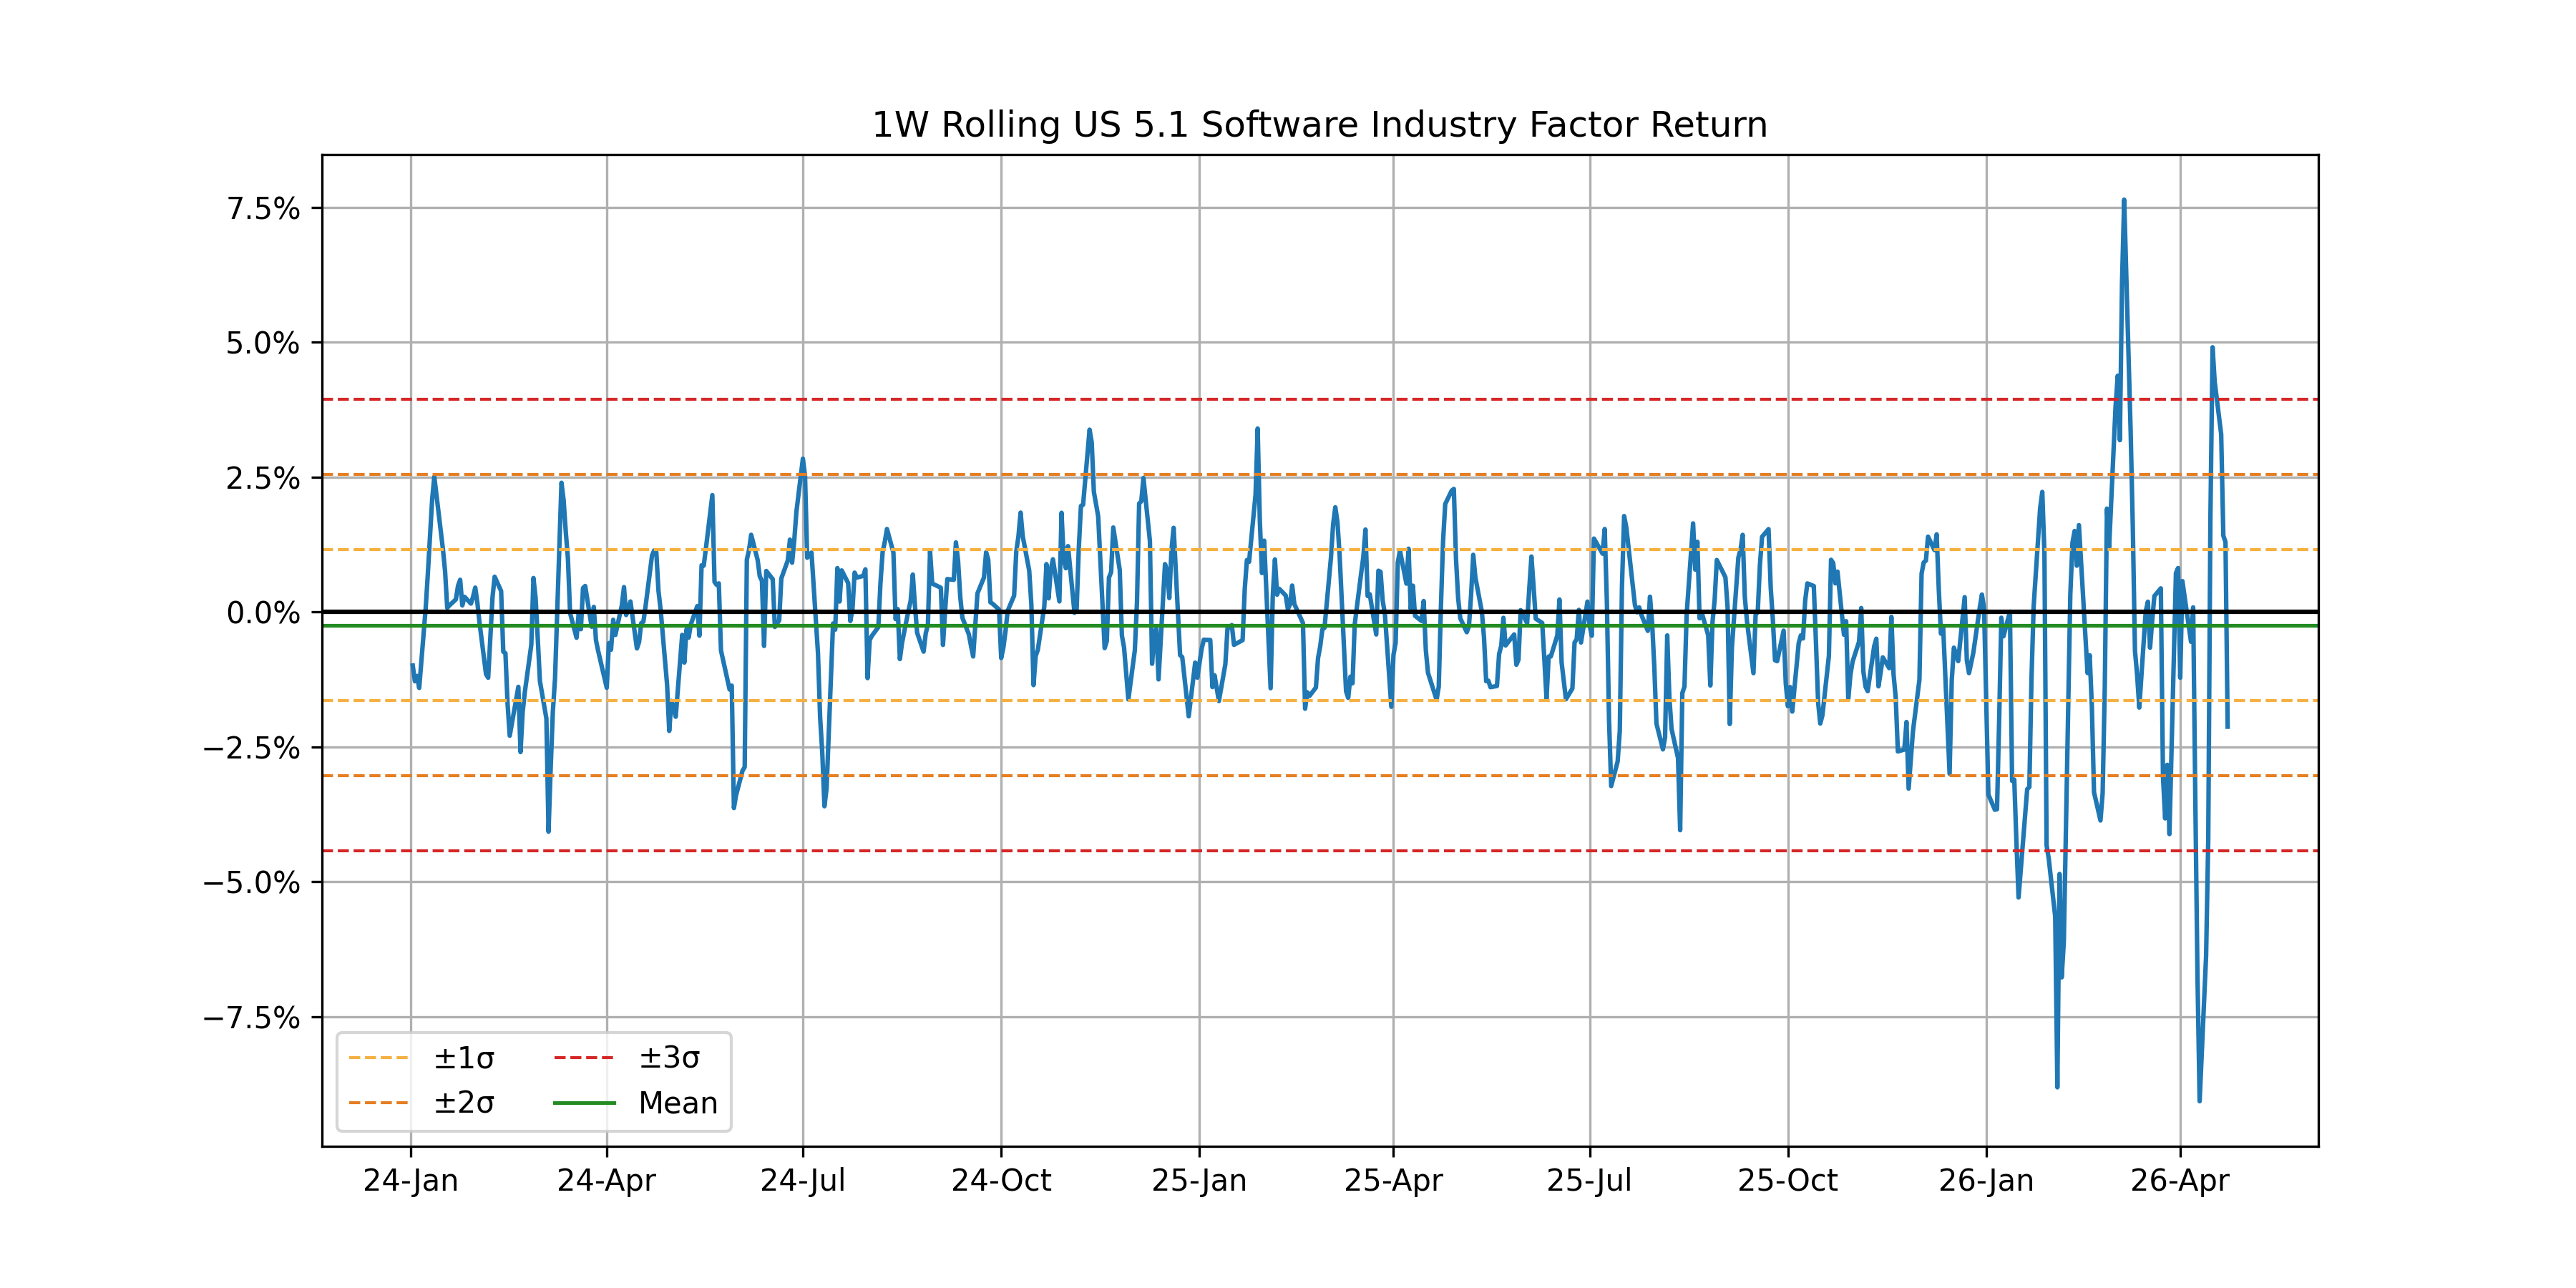
Charted as a 1 week rolling return, we can see the volatility of the factor distinctly increased starting this year.
The following chart is not included in the Equity Risk Monitors but is available on request:
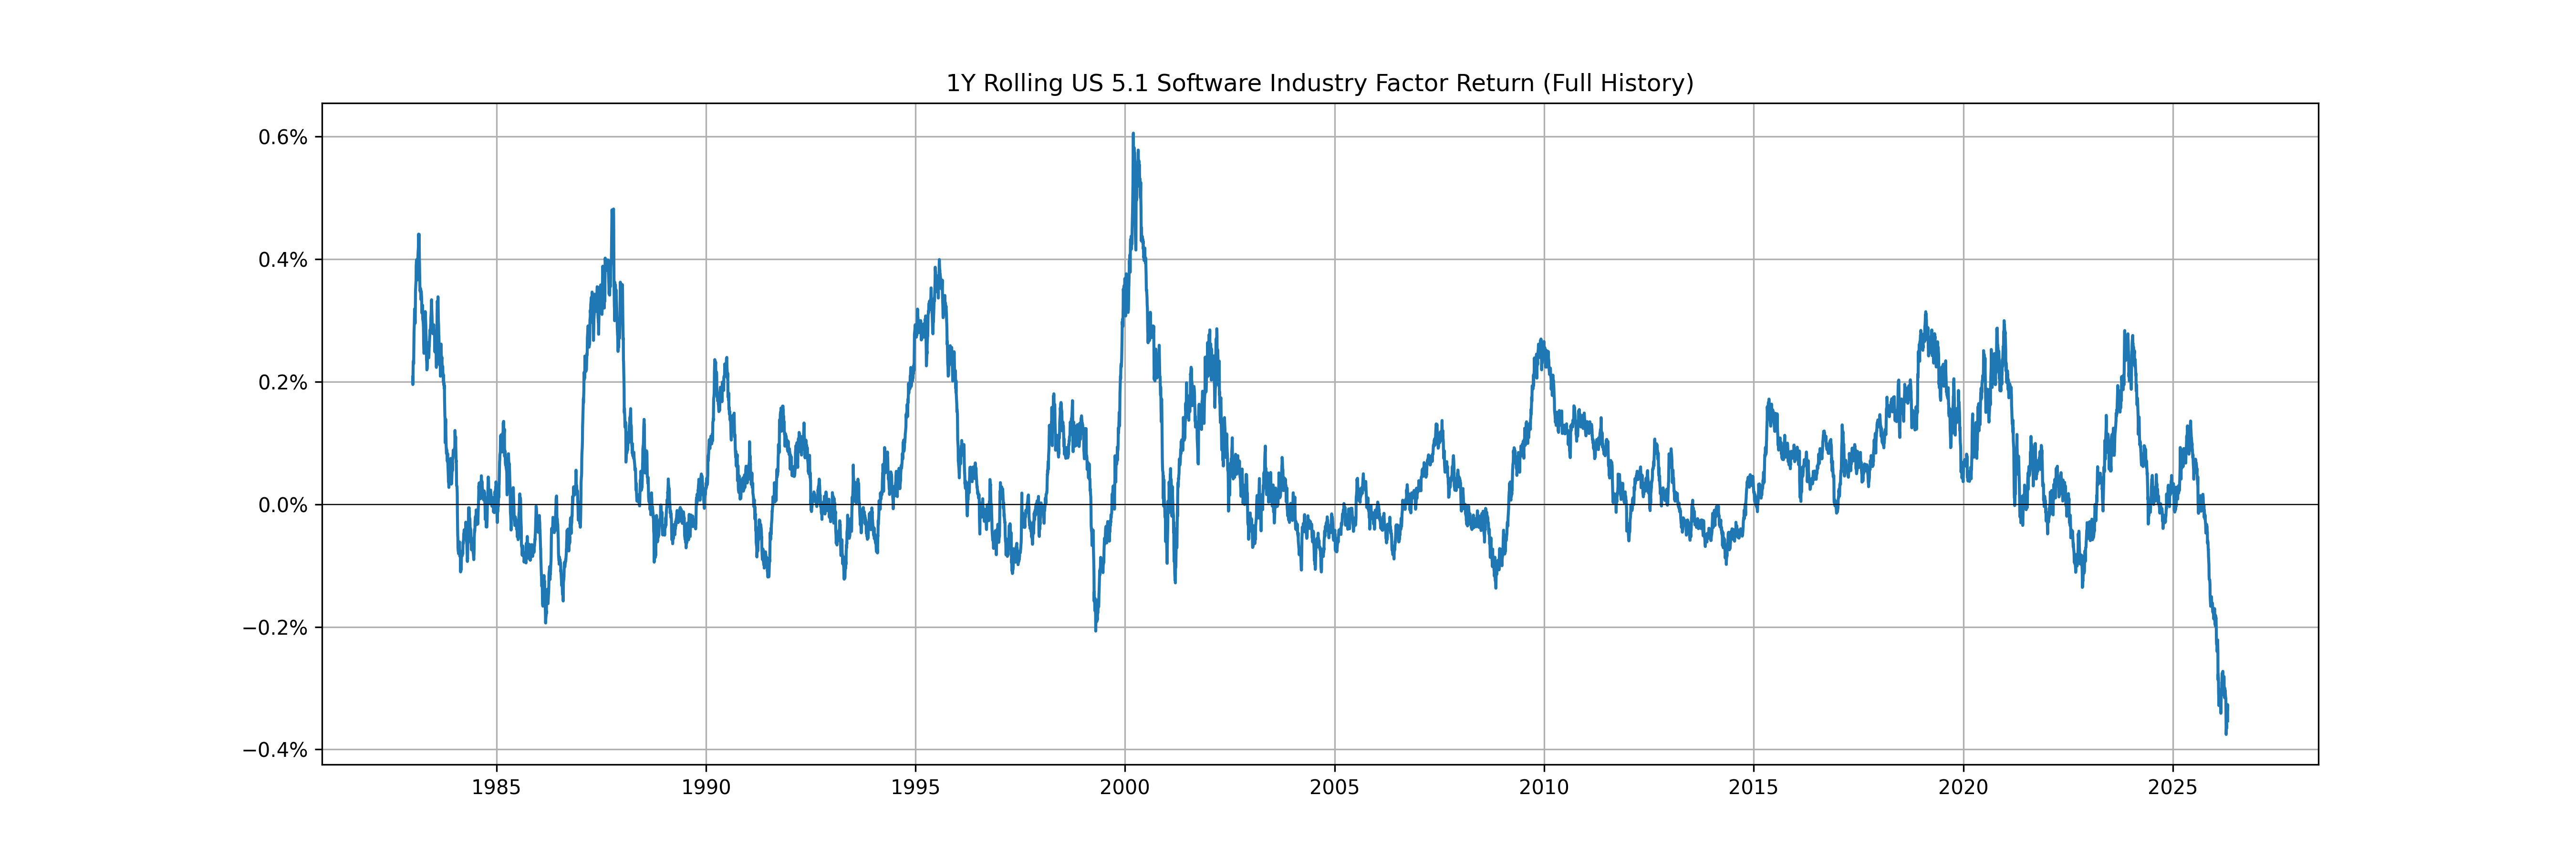
When the Software industry has such a large contraction, it invites comparisons to the dot-com bubble’s demise. Interestingly, our Software Industry factor returns are much more negative than that period’s…
The following chart is not included in the Equity Risk Monitors but is available on request:
…and the weekly swings are comparable:
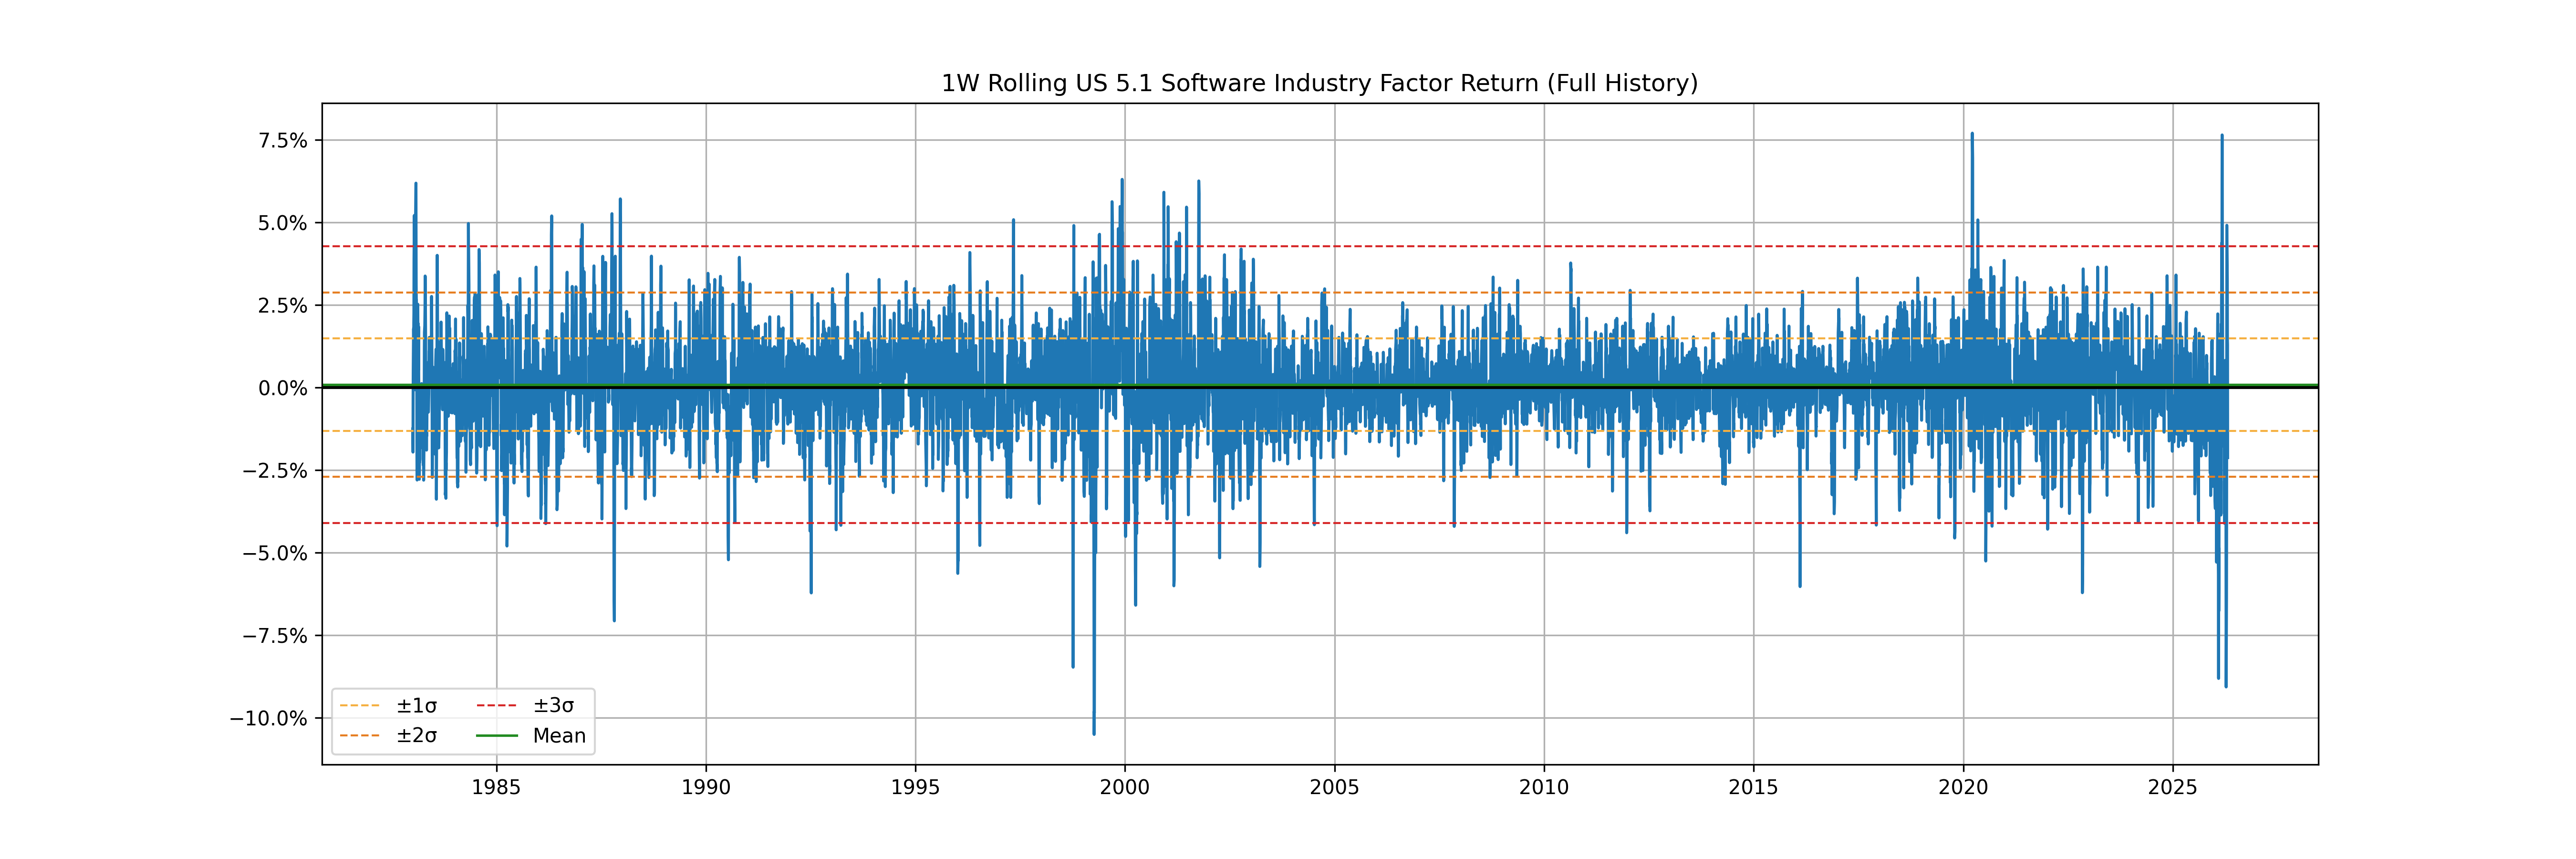
The United States’ war in Iran has been dominating headlines as of late, pushing talk of whether AI is in a bubble aside, but it is clear that market continues to believe that the creative destruction generative AI could cause in the Software industry is catastrophic.
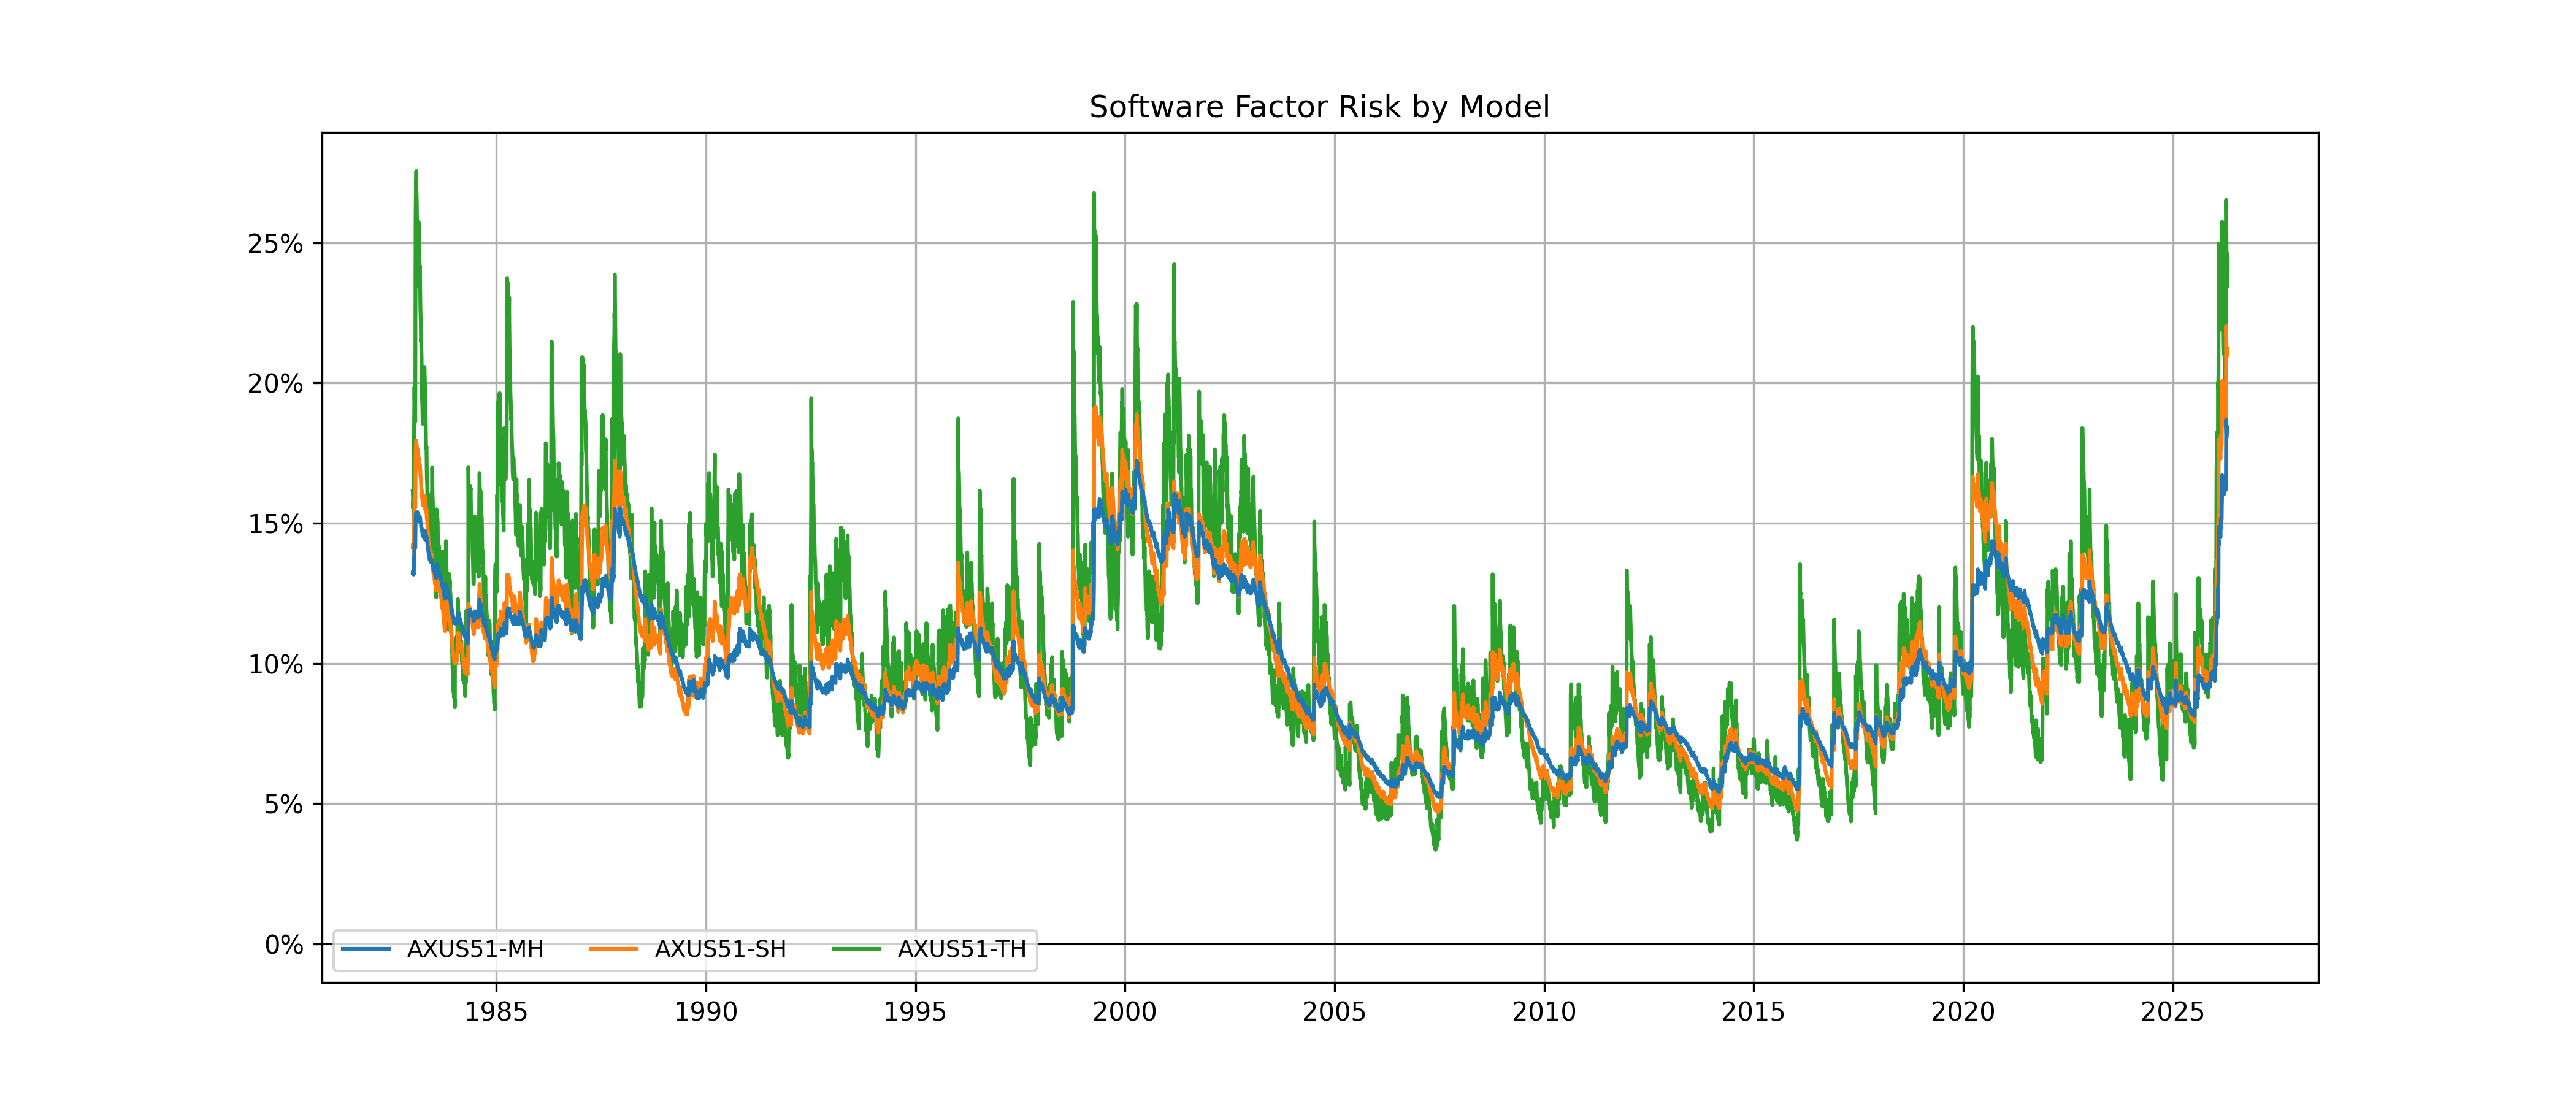
If we look at the risk of the Software factor, we see that in the early 2000’s that predicted risk was elevated into mid-2003 after the initial spike in late 1998. Last time we wrote on the subject, we remarked that we'd monitor this in the "coming weeks”, but from today’s vantage point, it seems that we will need to be monitoring this factor for years.
The following chart is not included in the Equity Risk Monitors but is available on request:
You may also like
.png%3Fh%3D810%26iar%3D0%26w%3D1080&w=3840&q=75)
.png%3Fh%3D810%26iar%3D0%26w%3D1080&w=3840&q=75)
