

EQUITY RISK MONITOR HIGHLIGHTS
WEEK ENDED JUNE 19, 2026
- US market saw the biggest risk increase among major benchmarks last week, and remains among the highest risk
- Market risk may be lower, but Industry volatility has climbed substantially
- Momentum and Liquidity could be signaling we are close to a market top
US market saw the biggest risk increase among major benchmarks last week, and remains among the highest risk
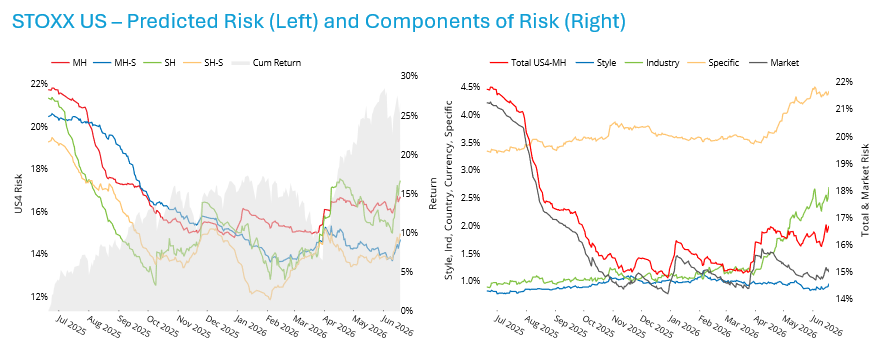
Last week, predicted volatility according to Axioma’s short-horizon fundamental models rose in all indices we track closely except STOXX Europe 600, where it fell slightly. The biggest proportional increase came from the US, where short-horizon risk for the STOXX US Universal index rose from 15.7% at the end of the prior week to 17.5% on June 19. This 11% increase over four days (as the US market was closed on Friday):
- actually occurred between the close on Friday, June 12 and the close on Monday, June 15 and
- is one of the biggest four-day gains in predicted volatility since at least 2012, falling into the 97th percentile relative to history. While the SpaceX IPO was the big news at the end of the prior week (see our analysis here), the increase in volatility seems unrelated. The continued uncertainty about the opening of the Strait of Hormuz driving oil price volatility may be one culprit, but no doubt there are quite a few others.
Both Style and Industry risk in aggregate saw the biggest proportional increases over the week, each climbing more than 11%. Stock specific risk did not drive total benchmark risk higher last week, although it has been on the upswing since May.
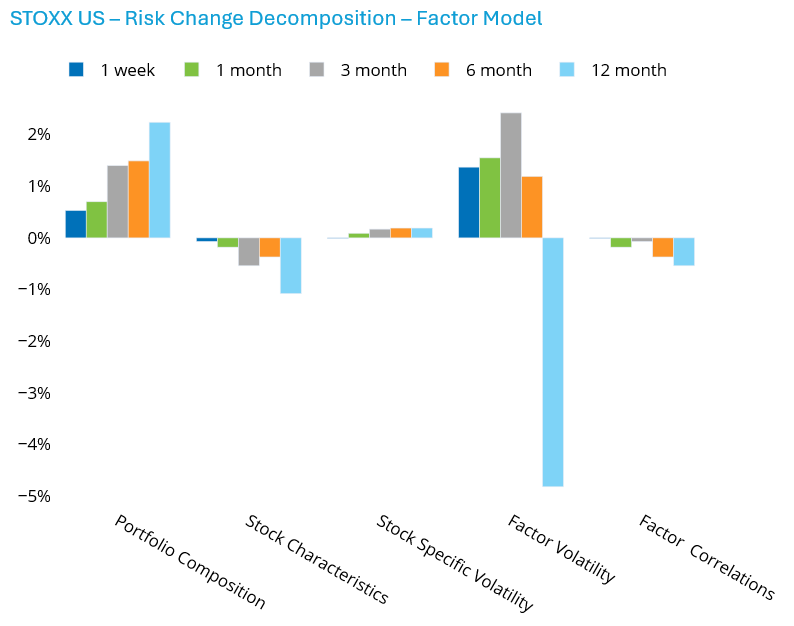
The decomposition of the change in risk for the week according to the factor model confirms that higher factor volatility (in the case of the US model this means the style and industry components) was the major reason for the increase. However, at least some could be attributed to a change in the composition of the index1. We believe the contribution from the change in portfolio composition came from certain riskier Info Tech names – their weights went up, and their risk was high, thus leading to a meaningful difference in overall benchmark risk.
See charts from the STOXX US AXUS4 Equity Risk Monitors of June 18, 2026
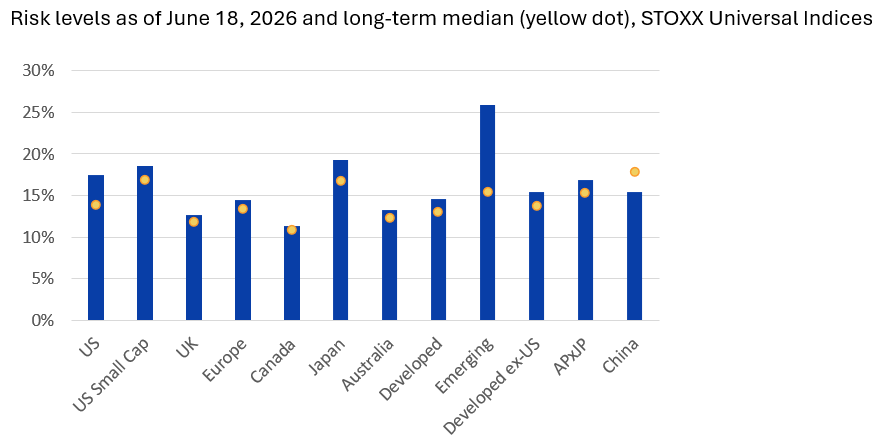
Despite its decreasing risk level through late last year driving its relative risk lower at the time, the core US equity market is currently the fourth-riskiest of 13 market we track closely owing to the more recent surge. US risk now falls behind only that of US Small Cap, Japan and Emerging Markets (note that all markets are denominated in local currency). The reasons for the relatively elevated risk in each market differ based on their industry exposures, economic sensitivities, etc., but the US and Japan typically have risk that is lower than other markets so this relatively high level is somewhat unexpected. And while all markets except China have risk above their long-term median levels, the US is also the farthest above the median with the exception of Emerging Markets. So, while the US continues to dominate Global markets in terms of its overall weight and contribution to global risk, investing in it entails more risk than most other major countries and regions.
The following chart does not appear in the risk monitors, but is available on request:
Market risk may be lower, but Industry volatility has climbed substantially
To be sure, US risk remains well below its level of a year ago, when the heightened volatility resulting from “Independence Day” tariffs was peaking. Much of the reduced level of US risk now versus then is attributable to substantially lower Market risk. In fact, Industry risk has been trending up since April, and is now about 2.5 times its level a year ago. As it comprises a much smaller part of overall risk than Market risk, its increase has not been reflected in total benchmark risk to any large degree. However, this is an important component of active risk that managers should be aware of. But to put it succinctly, we went from “everything is risky” because of tariffs to “some industries are risky” because of their AI exposure and others from their economic sensitivity.
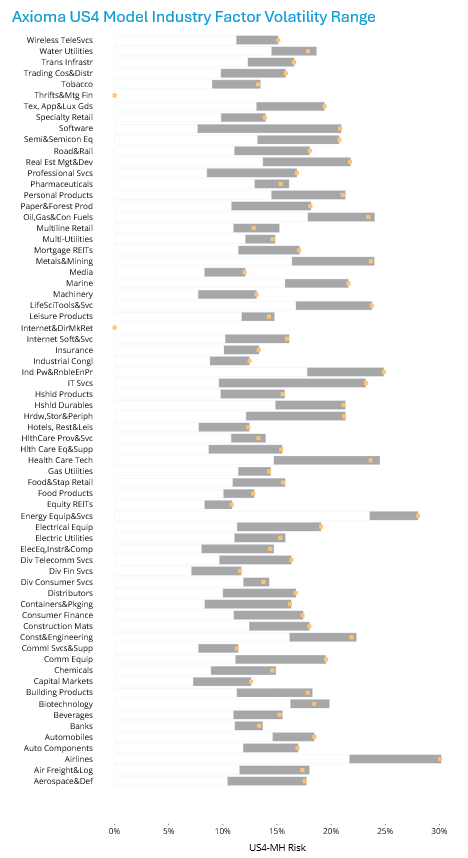
An industry-by-industry breakdown shows that every industry’s current level of predicted volatility (that is, industry volatility over and above that of the market) is at or near its 12-month high, very different from what we see in Market risk. In fact 64 of the 66 industries are within 5% of their 12-month high, and 15 ended last week at the high. Energy Equipment and Services and Airlines are currently the industries expected to be most volatile, likely owing to the volatility in oil prices, but quite a few other industries are not far behind.
Also worthy of note, especially for managers who take industry bets, is that overall Industry risk currently accounts for 8.3% of the total risk of the STOXX US Index, whereas this time last year it only comprised 1.2% of the benchmark risk. The Market factor’s influence has fallen from 95.7% to 83.2% in the past year (the rest, of course, is attributable to Style factors). It is clear that almost any given industry exposure is a lot more risky than it was last year, when it was likely that all industries would be impacted by tariffs, although some of the threat had been alleviated by June 2025.
See charts from the STOXX US AXUS4 Equity Risk Monitors of June 18, 2026
Momentum and Liquidity could be signaling we are close to a market top
In conjunction with one of our partners, EDS, we recently released a paper about factor returns in the period leading up to a market peak. You can find the paper here. One of the findings was that Medium-Term Momentum returns in the period leading up to a market peak were substantially higher than the long-term average return in most of the 60- and 20-day periods prior to market peaks since 1982. Results were similar, if a bit less consistent, for the Liquidity factor. Tests were done on the US market, although we believe they could translate to other markets as well.
Since the inception of the US model in 1982 the average 60-day return for Medium-Term Momentum was 80 basis points; it was 90 basis points in the WW5 model. Liquidity’s returns were 44 and 26 basis points, respectively in US5 and WW5.
Momentum has seemed to surge recently. While there have been ups and downs in daily performance, the magnitude of returns on the positive days has been higher than it does on down days. Overall, the return for the 60 days ending June 18 was 2.28%, almost three times the average. For WW5 the 60-day return ending June 19 was 1.76, almost two times the average.
Liquidity has also produced positive returns, rivaling Momentum’s in magnitude.. In the US, the return over the past 60 days was 1.77%, four times the average. In WW5, the return was even more startling, 2.56% - almost 10 times average!
Does this mean we are at a market peak? Not necessarily, but it does provide one more data point about the optimism of investors that the winners will continue to win while the losers lose. At the same time, investors seem to be seeking (or needing) ever-higher levels of Liquidity to implement their trades. Taken with other potential signs of a market top – such as high valuations and the increased likelihood the Fed will hike rates, these signals keep us cautious about the market’s outlook. We fear that if the general sentiment changes – signaled by a Momentum reversal – the current high level of market valuation indicates the decline could be large.
Footnotes
1 The index was actually rebalanced as of the open on June 22, but it had not yet been rebalanced on the 18th.
You may also like


