

EQUITY RISK MONITOR HIGHLIGHTS
WEEK ENDED AUGUST 21, 2026
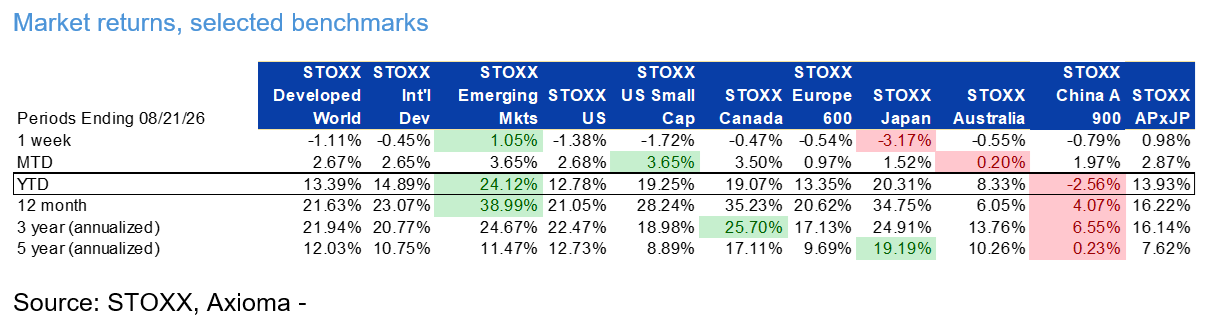
- There were few markets in which to hide last week…
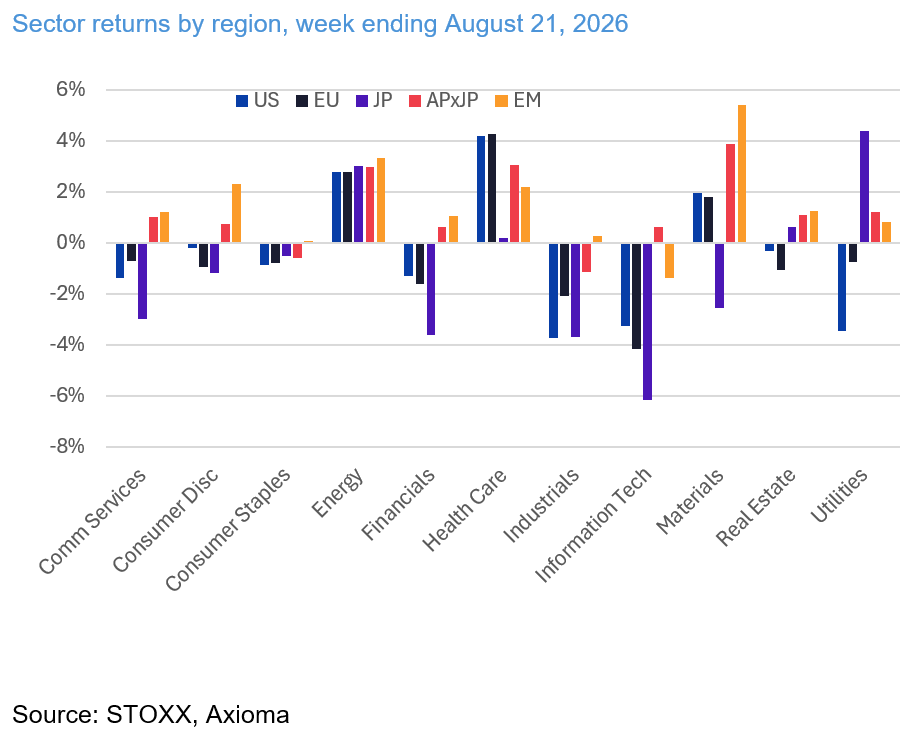
- …and there were substantial regional differences in sector returns
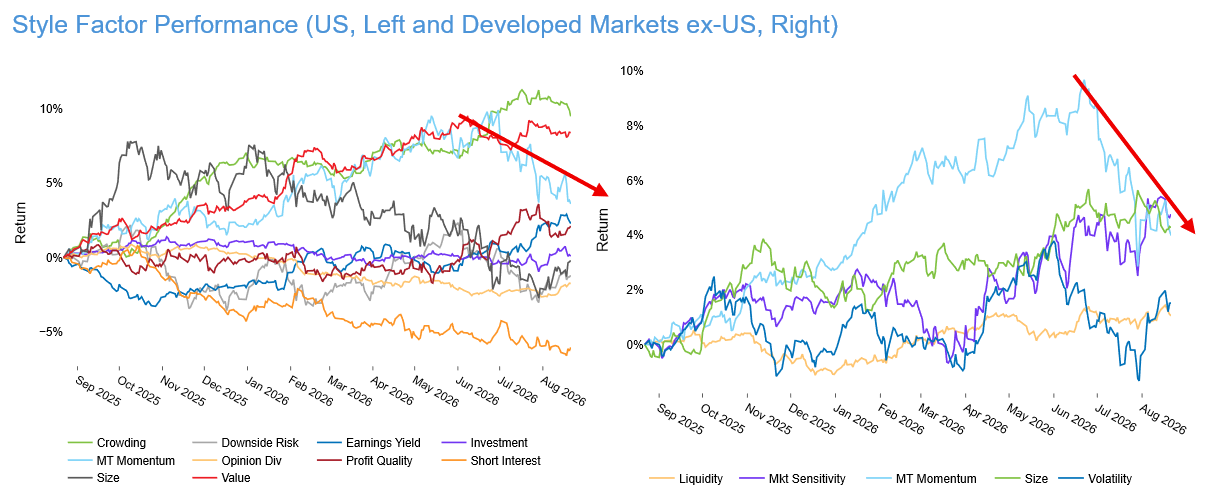
- Momentum hit a pothole – or a sinkhole, increasing its volatility
There were few markets in which to hide last week…
Most major markets fell last week. Of the indices we follow closely, STOXX Japan was hit hardest, down 3.2%, followed by STOXX US Small Cap (-1.7%) and the STOXX US Index (-1.4%). STOXX Europe 600 and STOXX International Developed Markets ex-US were both down just 0.5%. There was some better news for investors last week – both STOXX Emerging Markets STOXX Asia Pacific ex-Japan 600 were up around 1.0%.
The market and economic news was largely disappointing, as the US 30-year treasury yield hit its highest level in almost 20 years, despite the Treasury Secretary’s buyback announcement. The bond vigilantes, so aptly named by Ed Yardeni (www.yardeni.com) many years ago were not placated, and are clearly back in force. They seem unhappy with US debt reaching a new milestone of over $40 trillion-with-a-T and persistently high oil prices as the end of the conflict in Iran seems elusive. In addition the tempering of inflation down to the Fed’s 2% target seems to be proving more difficult than expected.
The following table does not appear in the equity risk monitors but is available on request:
…and substantial regional differences in sector returns
The biggest sector losses in Europe and Japan were in Information Technology (-4.2% and -6.2%, respectively). The sector was down 1.4% in Emerging Markets, the biggest, and only, sector loss in Emerging Markets. Info Tech stocks rose in Asia ex-Japan.
In contrast, in the US, most sectors fell. Industrials suffered the biggest loss (-3.7%) and Info Tech was close behind (-3.3%). US Utilities also suffered, much more so than in other regions, by falling 3.5%.
Health Care, however, was the best, or one of the best, performing sectors almost everywhere: up 4.2% in STOXX US and 4.3% in STOXX Europe 600. In addition, rising oil prices propped up the Energy sector, which rose 2.8% in the US, 3.3% in Emerging Markets, and saw returns between those two bookends in other regions.
The following table does not appear in the equity risk monitors but is available on request:
Momentum hit a pothole- or a sinkhole – last week, increasing its volatility
On Wednesday, August 19, the Medium-Term Momentum factor in the US5.1 medium-horizon model experienced one of its worst days ever. The factor return was -1.13% that day. Of the 11,250 days of the model, this return was the 36th worst – in other words in the bottom 1% of all daily returns. In addition, the day’s performance was more than 4.5 standard deviations below average.
The shortfall in Momentum was not just a US phenomenon. That same day the factor fell in the bottom 4% of daily returns in Europe and Asia ex-Japan, and in the bottom percentile in the Worldwide and Developed Markets ex-US models. It was in the bottom 2% in Emerging Markets. In Japan, the return fell just above the bottom decile.
The next day’s return was slightly better, albeit still negative, in many regions, but the factor eked out a small gain in the US, only to fall again the next day. As we wrote recently in our article “How AI Uncovers Factors That May Signal Market Peaks,” Momentum has tended to fall apart at past market peaks, so this underperformance bears watching.
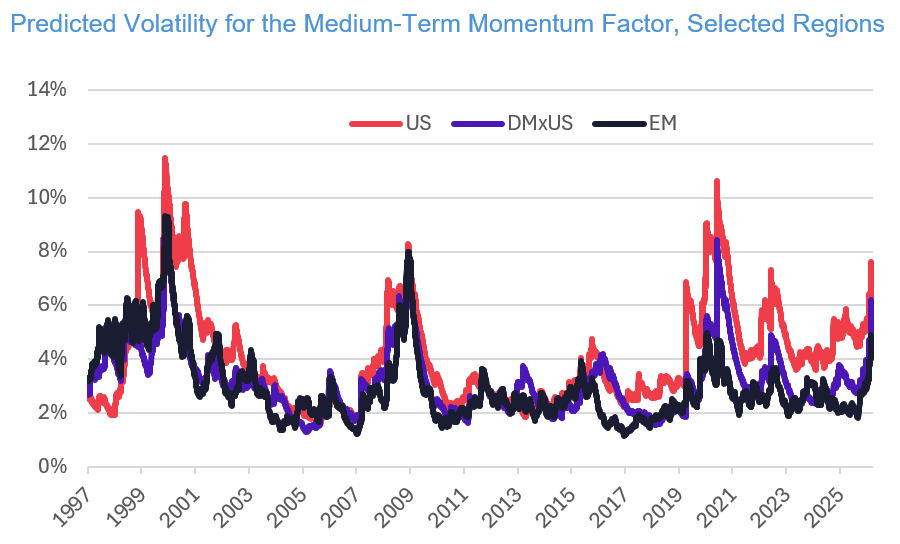
See charts from US and Developed Markets ex-US Equity Risk Monitors as of August 21, 2026:
The sharp factor decline in Medium-Term Momentum also had the effect of driving its volatility higher (as we saw for many style factors and covered in last week’s Equity Highlights. The predicted volatility for Momentum is not only at the high end of its 12-month range, it is in the top decile of historical levels in the US, Japan, Asia ex-Japan and Developed Markets ex-US, in the 88th percentile in Emerging Markets and the 84th in Europe.
See charts from US and Developed Markets ex-US Equity Risk Monitors as of August 21, 2026:
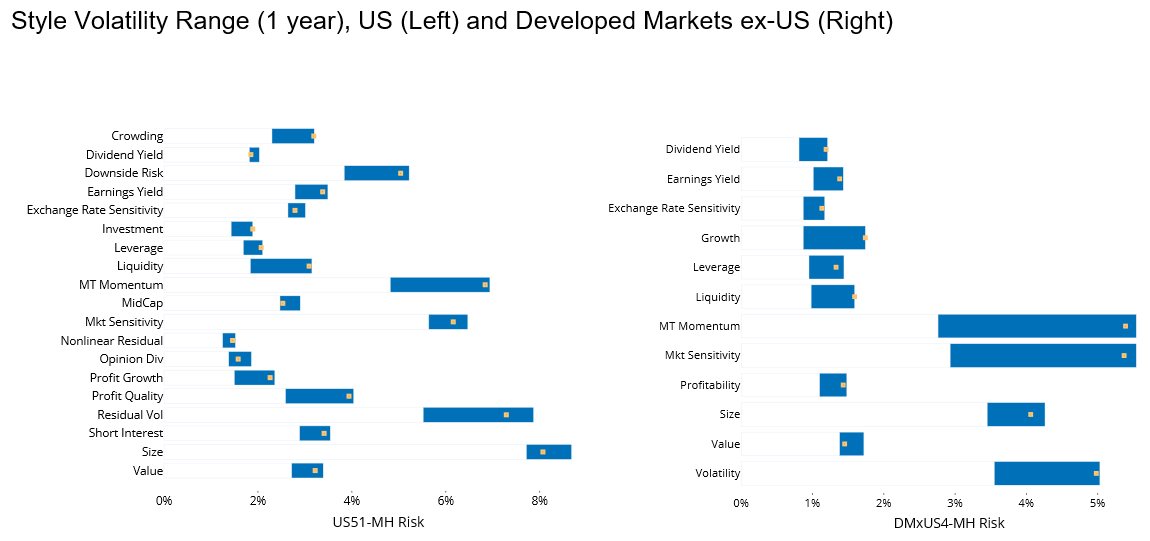
Note: we have limited the number of charts we are showing here, but these charts appear in each of the equity monitors.
The following table does not appear in the equity risk monitors but is available on request:
You may also like


