

EQUITY RISK MONITOR HIGHLIGHTS
WEEK ENDED NOVEMBER 13, 2026
- Markets have recovered, but many remain below their pre-US-election highs
- Higher realized volatility means higher predicted volatility
- Factor returns have calmed down with the market, but more of them than expected are “outsized”
Markets have recovered, but many remain below their pre-US-election highs
Equity markets started November quietly, likely in anticipation of the US election. As we wrote last week (see here), the initial reaction was extremely positive but quickly turned south, especially in the US, as optimism about AI turned into pessimism. The major markets that fared the worst on November 5 (STOXX US and the Russell 2000) and November 6th (Emerging Markets) have recovered, although not quite to their highs before the declines. While the magnitude of daily returns has fallen, we still observe that four of the nine days (44.4%) this month saw US market returns in excess of 1% whereas the long-term average is about 25% of days with returns of that magnitude.
The following charts do not appear in the Equity Risk Monitors but are available on request:
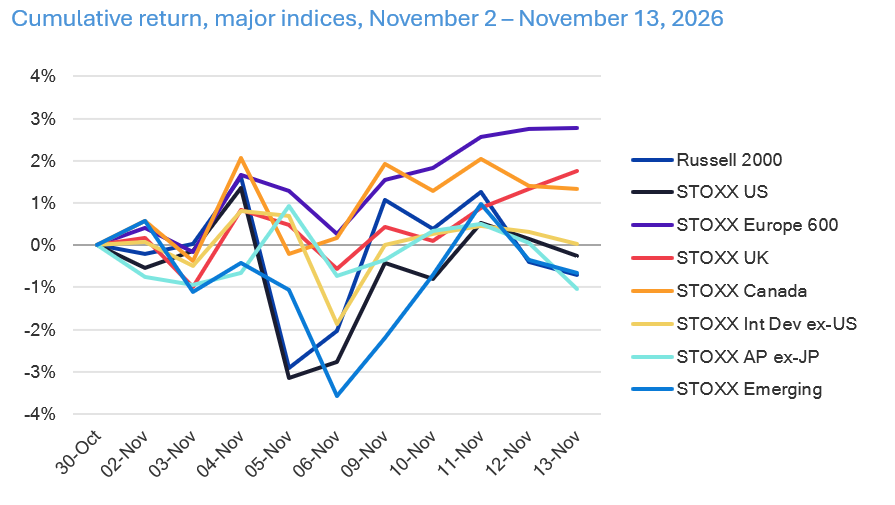
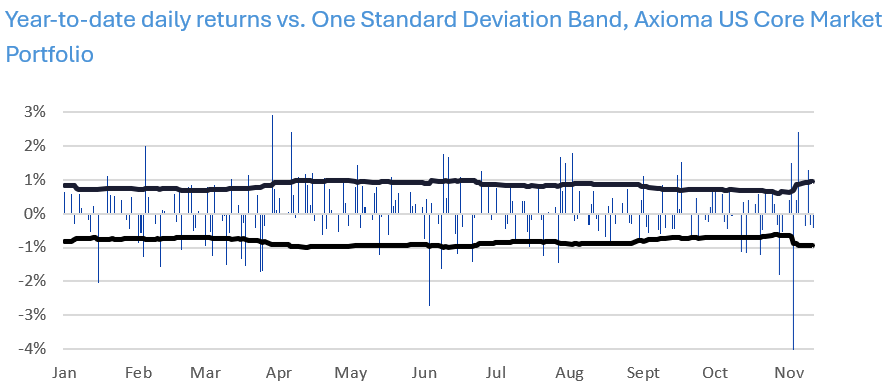
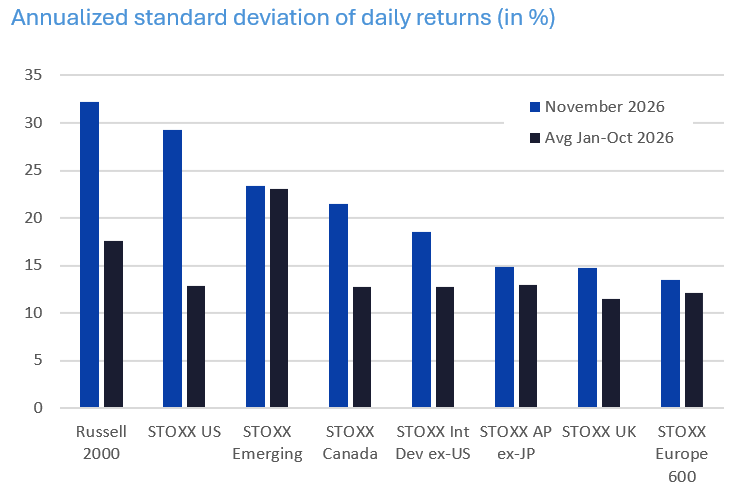
As a result, after a period of relative calm for many, equity markets saw a good deal of realized volatility in November. November-to-date has seen the highest realized standard deviation of daily returns as compared with every other month this year in the US (both the STOXX US and the Russell 2000) and Canada. In contrast, November’s volatility was about average in Emerging Markets. In no month was November’s volatility below average, however.
The following charts do not appear in the Equity Risk Monitors but are available on request:
Higher realized volatility means higher predicted volatility
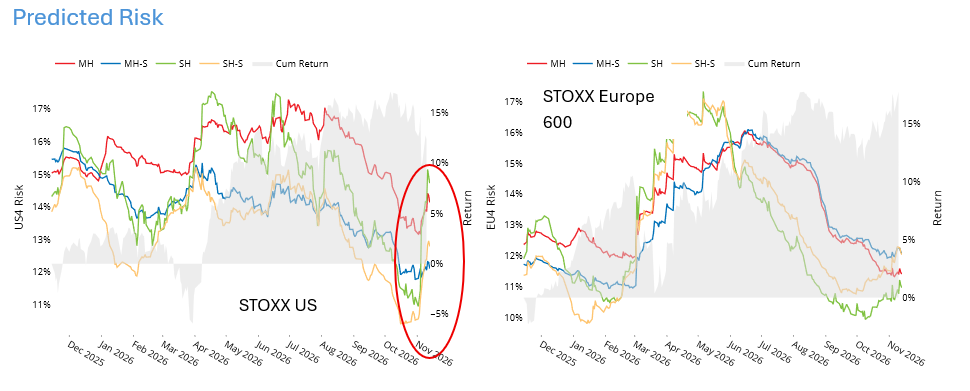
As realized volatility rose, predicted volatility followed suit. Short- and medium-horizon risk has increased since the end of October for some of the benchmarks we track closely, although the biggest increase came in the US, where short-horizon fundamental risk rose from 11.24% on October 31 to 14.73% as of the end of last week, a 31% gain. Given the heightened volatility in AI-related stocks along with the troubles that have surfaced for Nvidia (currently the second or third-largest stock in the US, depending on the index), it is not surprising that risk has jumped so substantially. Nvidia’s risk alone jumped from 42.3% (29.0% specific risk, or 47% of Nvidia’s total risk) to 54.1% (38.7% specific, 51% of company’s total risk). While the jump in risk from the end of October was severe, we note the index risk level had previously been in the bottom one-third of risk readings going back to 1982 as recently as October 30. The increase since then only places the current level of risk at its long-term median level, clearly not cause for alarm.
Japan’s short-horizon risk was up proportionally almost as much as the US’s (13.72% to 17.55%, a 28% increase). This increase in volatility seems to be related more to Japan-specific issues such as an unexpected contraction in GDP and a huge increase in producer price inflation. After Japan, Asia ex-Japan posted an 11.8% increase in risk, while all other major markets saw single-digit increases (Canada, not shown, experienced a slight decline).
More broadly, 70 countries around the world had an increase in risk versus last week, although only seven saw double-digit increases. Where risk fell the decrease was small.
See charts from the STOXX US, STOXX Europe 600, STOXX Japan, STOXX Asia ex-Japan 600, STOXX International Developed Markets and STOXX Emerging Markets Equity Risk Monitors as of November 13, 2026:
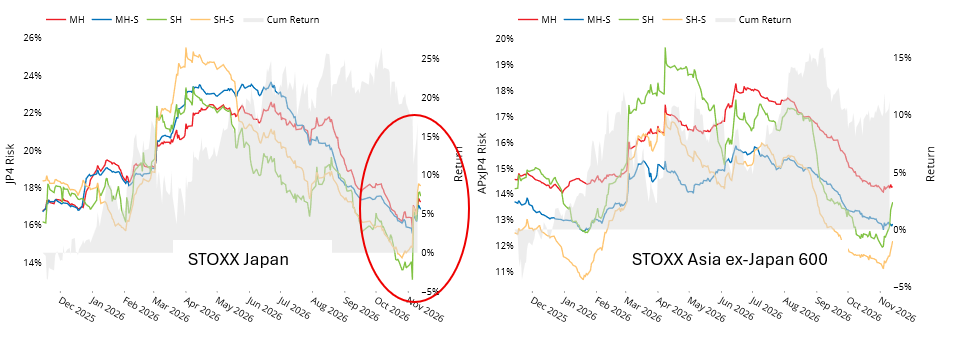
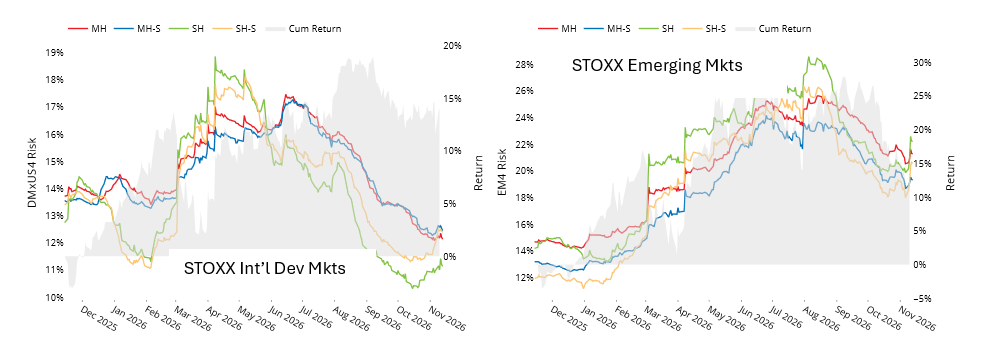
See chart from all Equity Risk Monitors as of November 13, 2026:
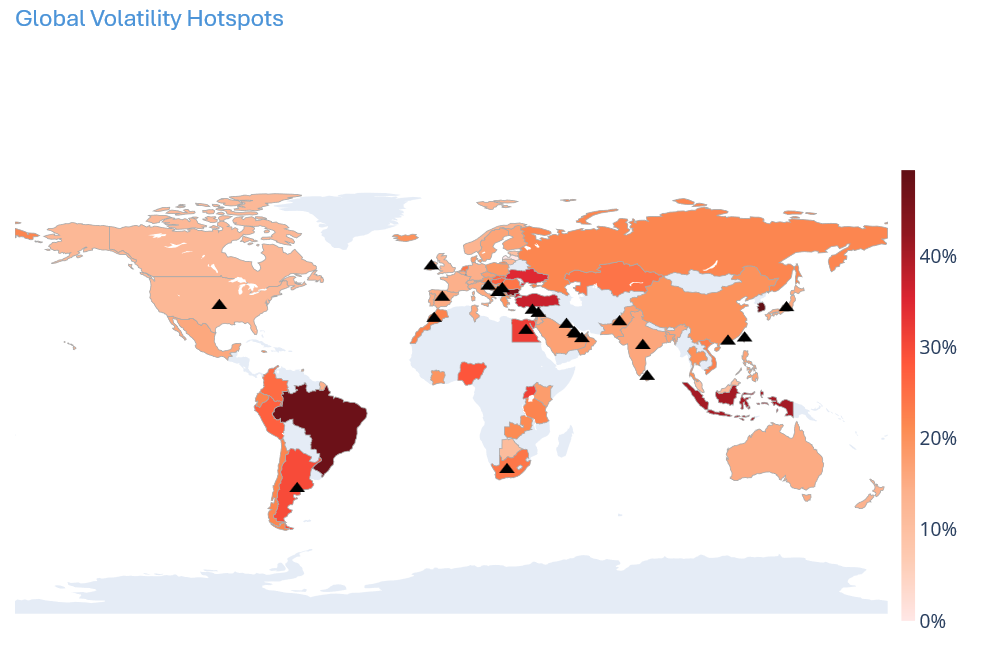
Note: Upward facing arrows indicate an increase of 1% over the past week in the country’s volatility
Factor returns have calmed down with the market, but more of them than expected are “outsized”
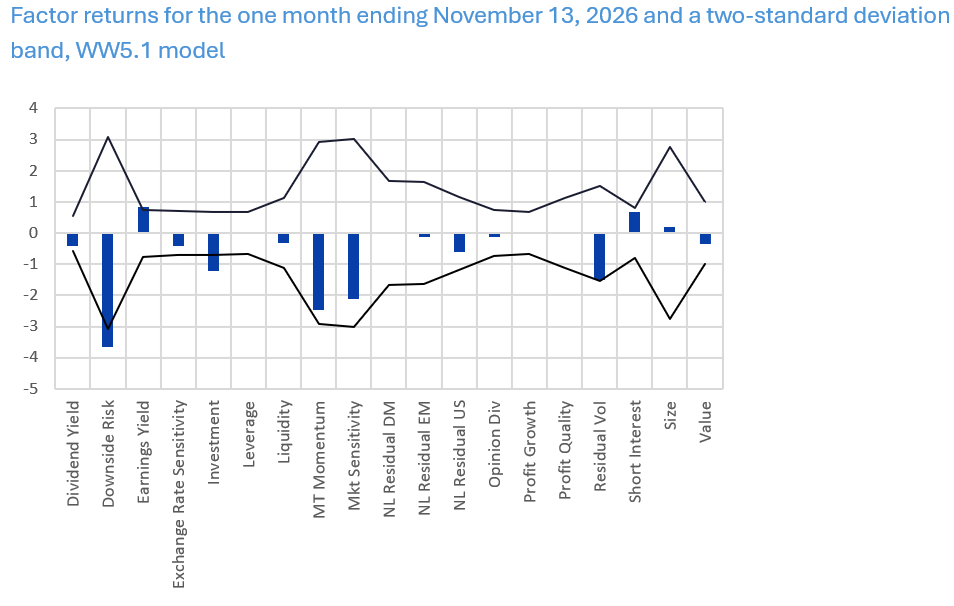
Finally, a note on factor performance. We have written about very short-term performance of model factors, especially in the US, and how so many fell outside of a one- or two-standard deviation range as a result of the market turmoil since the US election (see here and here). This week we have taken a look at performance of the factors in our US5.1 and WW5.1 models for the one-month period starting October 16 and ending November 13.
Although factor returns largely calmed down last week, six of the 19 factors’ monthly returns fell outside of the two-standard deviation band (where the standard deviation is defined as the risk forecast at the beginning of the period). In the US there was one exception - Short Interest, where the -2.14% return for the last five days was not only a sharp reversal from what the factor experienced over the prior two weeks as a result of short covering, but was also a more-than-four-standard deviation event. For the month, Short Interest’s return remained positive, however.
The factors with the outsized monthly returns on the positive side, as expected based on their long-term averages, were Crowding, Earnings Yield, and Opinion Divergence. Investment’s return was negative, in line with expectations. MidCap (positive) and Residual Volatility (negative) both saw performance of more than two standard deviations, possibly a bigger surprise than the others, since they do not have a long-term risk premium associated with them.
The following charts do not appear in the Equity Risk Monitors but are available on request:
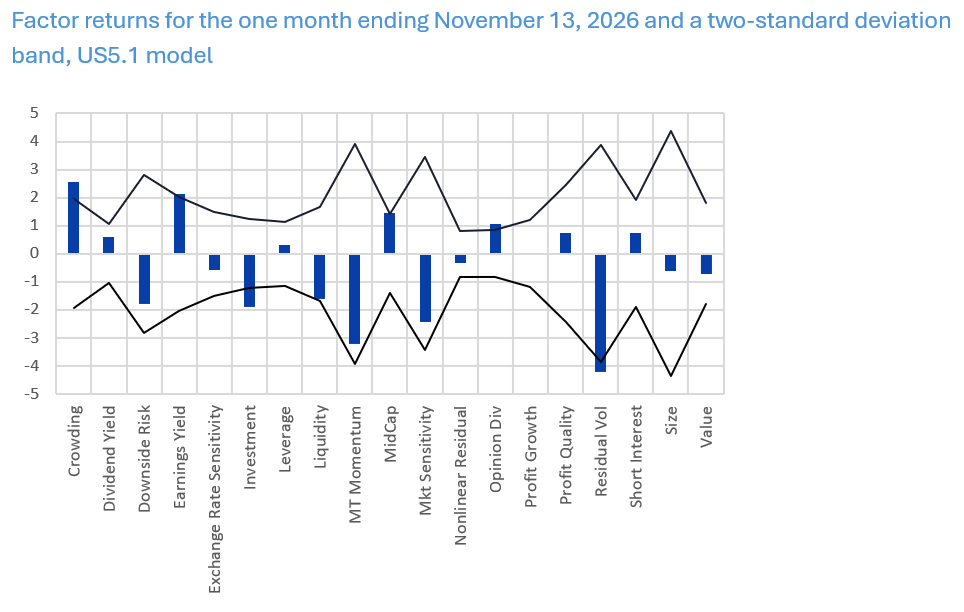
The Worldwide (WW5.1) model saw “just” three outsized returns, all in the expected direction. Downside Risk and Investment were both negative, whereas Earnings Yield posted positive performance. Medium-Term Momentum’s return almost hit the two-standard-deviation threshold, but in the “wrong” direction. Similar to the US, Short Interest reversed course and turned in a negative return last week that was an almost-four-standard-deviation event. The return for the last month, however, remains slightly positive here as well.
Notably, in both the US and Worldwide models, Medium-Term Momentum had a good week last week after falling short during the earlier market turmoil as investors seemed to change their minds about where the market leadership would be.
The following charts do not appear in the Equity Risk Monitors but are available on request:
For more information on factor returns over various periods and cumulatively over the last year, see charts 13, 14 and 17 in the individual Equity Risk Monitors.
You may also like


