

EQUITY RISK MONITOR HIGHLIGHTS
WEEK ENDED NOVEMBER 6, 2026
- Global markets saw large moves in the wake of the US election
- The AI drawdown did not just begin last week
- Risk jumped for the US and Japan, but remained subdued elsewhere
- Finally, a note about factor performance last week
Global markets saw large moves in the wake of the US election
What a week for equity markets last week! The day after the US election, US stocks gained about 1.5%, a top decile day relative to more than 40 years of history. However, that optimism quickly faded as investors focused on the AI-infrastructure story. AI has been driving the US (and other markets), as Technology accounts for a large portion of the market. The story went as follows:
- Several newly elected governors noted they wanted a moratorium on new AI buildouts.
- This concern about moratoriums built on the previous worries about whether tech companies would have the cash flows to cover the infrastructure buildout.
- Although we have been discussing that issue for a while, (see here and here for example) several tech companies reporting negative free cash flow in Q3 earnings suddenly made the issue more real.
The tremor was felt the following day (Thursday, 5 November) when the US market fell more than 4%. That return fell into the bottom 0.3% of 44 years of daily returns. In other words, only 39 days of the last 11,302 saw worse performance.
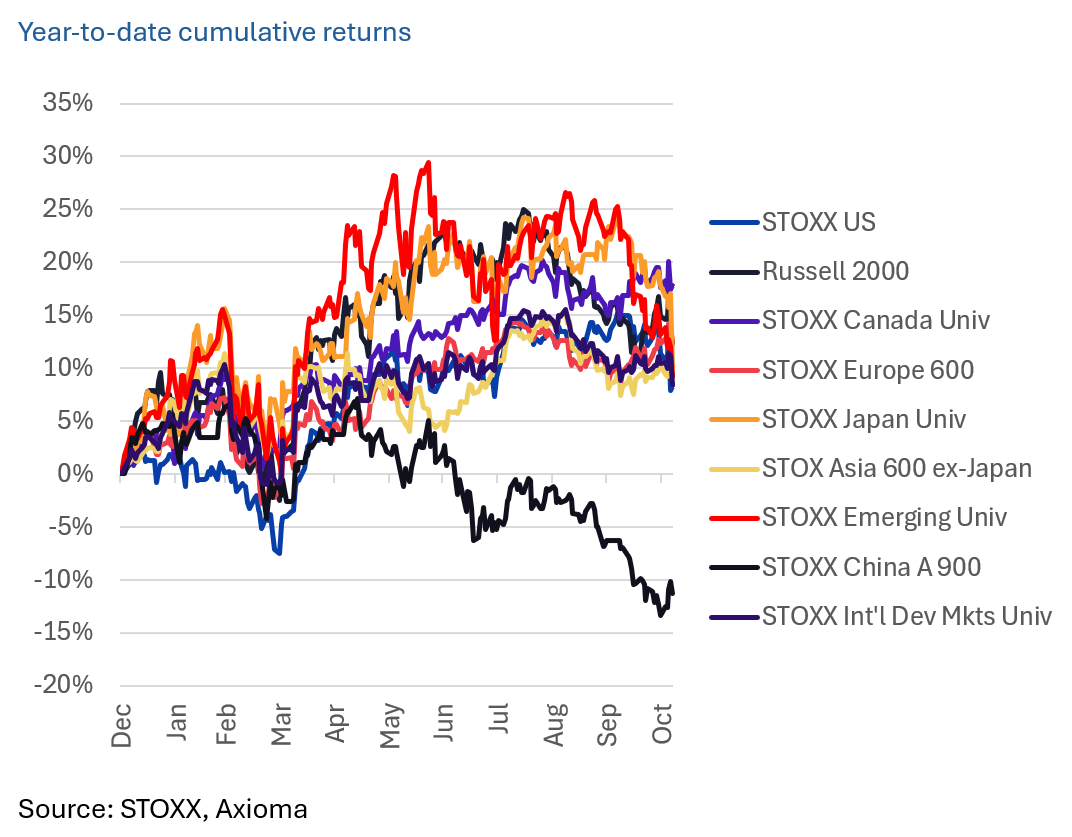
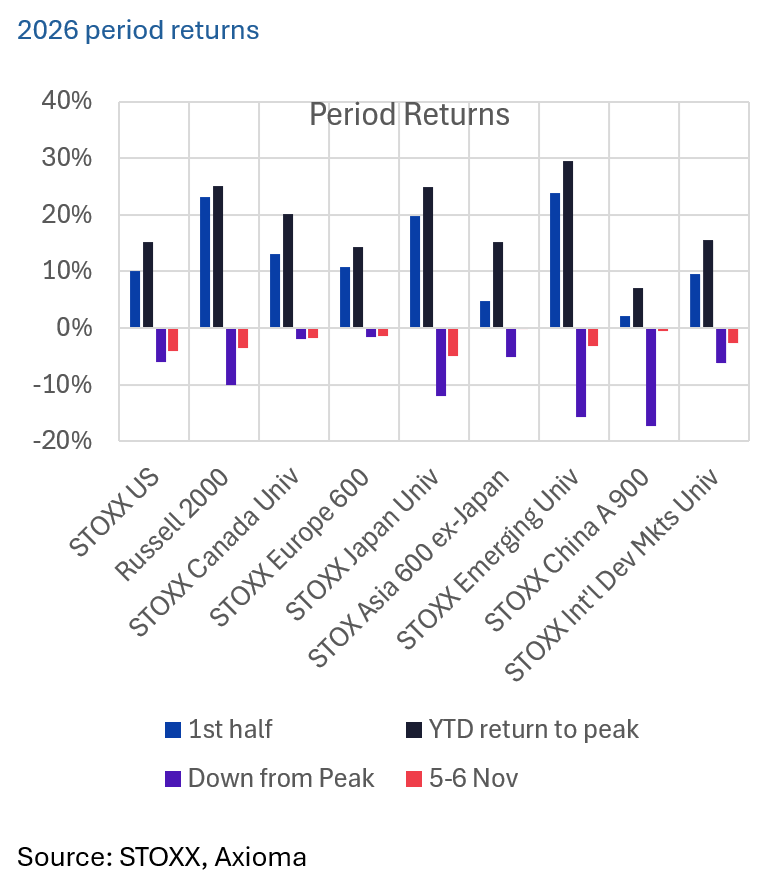
Most non-US markets followed the US down on Friday, 6 November, but the US recovered a bit that day. Markets have seen a year-to-date peak at different times this year, but all are down from those recent highs. The core US market is now about 6% below its October 6 peak while US small-cap stocks are down about 10% from their mid-August high. Japan is 12% below its October high. Emerging Markets reached its near-term top in June and is down almost 16% from there. The biggest drawdown was in China, which peaked in mid-May and has fallen more than 17% from that point. It is the only market to be down year to date.
The following charts do not appear in the Equity Risk Monitors but are available on request:
The AI drawdown did not just begin last week
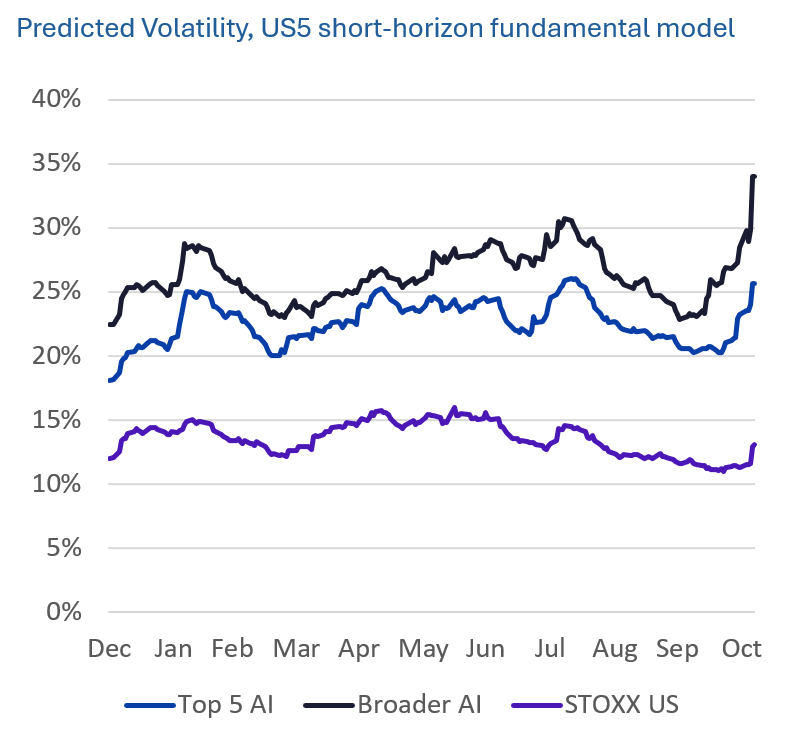
The AI story was already struggling. To examine this in more depth, we used two portfolios:
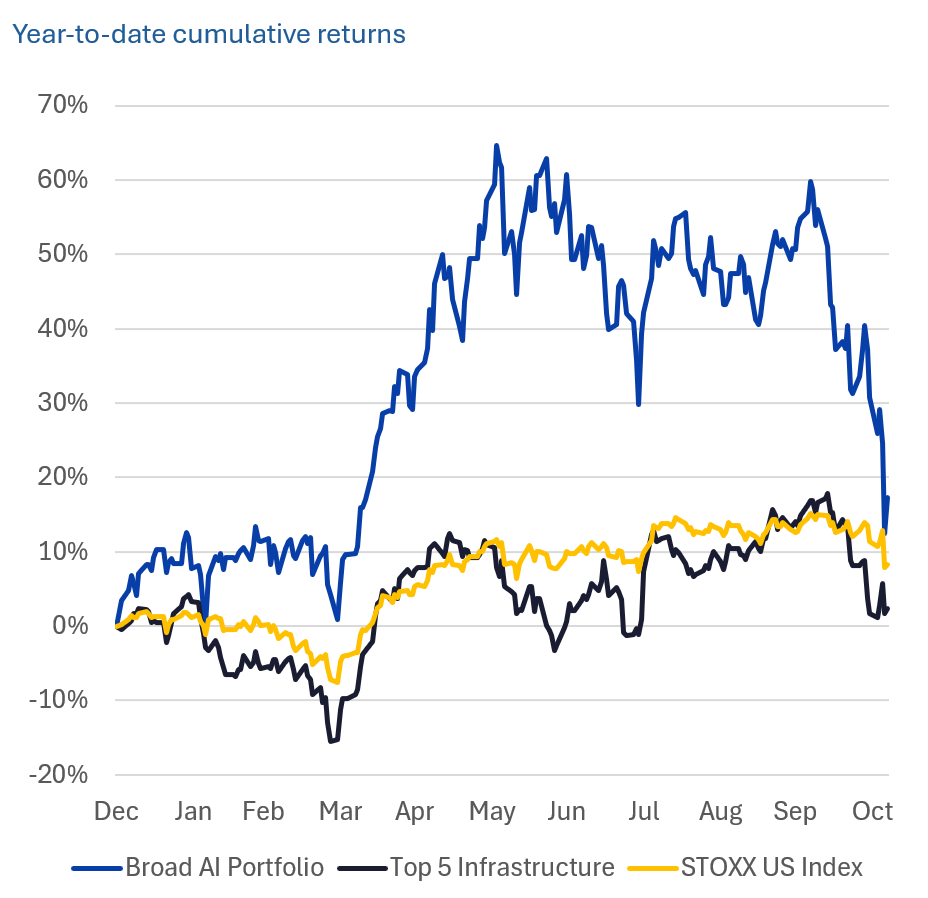
- We built an equal-weighted portfolio of the top 5 AI infrastructure companies (Alphabet, Amazon, Meta, Microsoft and Nvidia , 6 stocks because Alphabet has two share classes). These companies account for more than 24% of the STOXX US index, so the overall market return is closely tied to their performance. They fared slightly better than the US market on November 5.
- We call the second, broader portfolio the AI Ecosystem portfolio. It is an equal-weighted portfolio of 36 names across 14 industries, designed to capture the broader AI ecosystem, extending beyond mega-cap tech to include indirect beneficiaries of the AI buildout, such as power generation, cooling equipment, and infrastructure REITs. For more details on how the portfolio was constructed, see the blog post: The AI bubble question you're asking wrong. This portfolio fared much better that the infrastructure names and the market as a whole in the first half of 2026, bounced around a lot until early October, and has plummeted since then. On November 5 they were down more than 12%.
- Our conclusion is that the US election and data-center stoppages did not cause, but may have accelerated, the decline. The concerns clearly started well before the election as is apparent in the performance chart.
The following chart does not appear in the Equity Risk Monitors but is available on request:
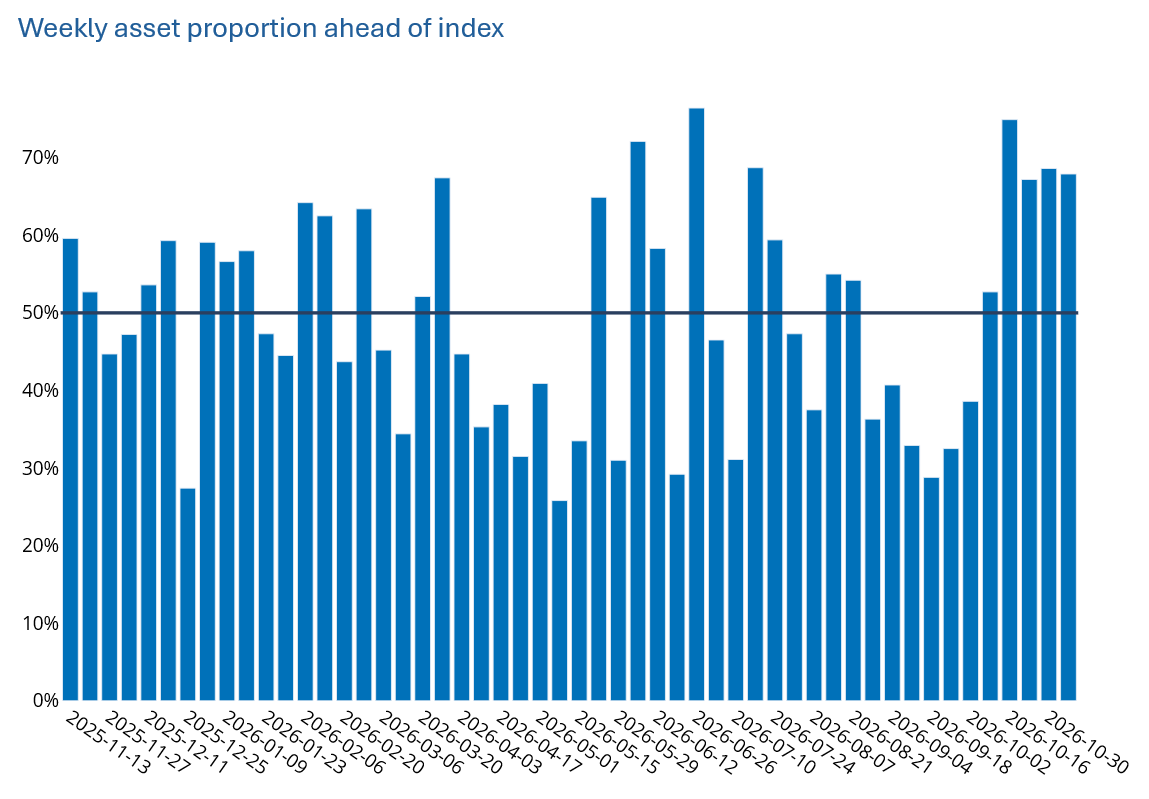
There is some good news on the market breadth front: almost 70% of stocks in the STOXX US index outperformed the index in five of the last 5-day periods. This gives investors a bit more chance of beating the market.
See chart from the STOXX US Equity Risk Monitor as of November 6, 2026:
Risk jumped for the US and Japan, but remained subdued elsewhere
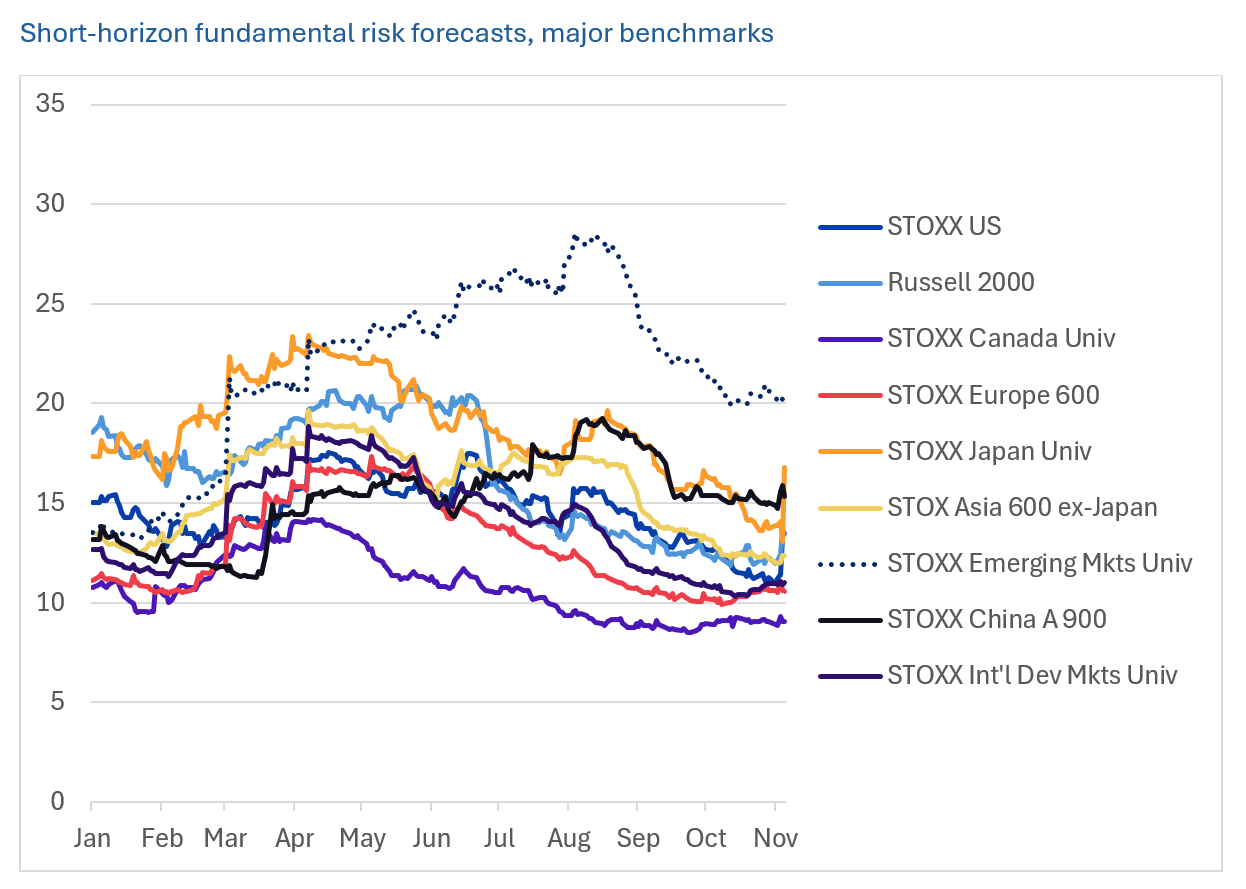
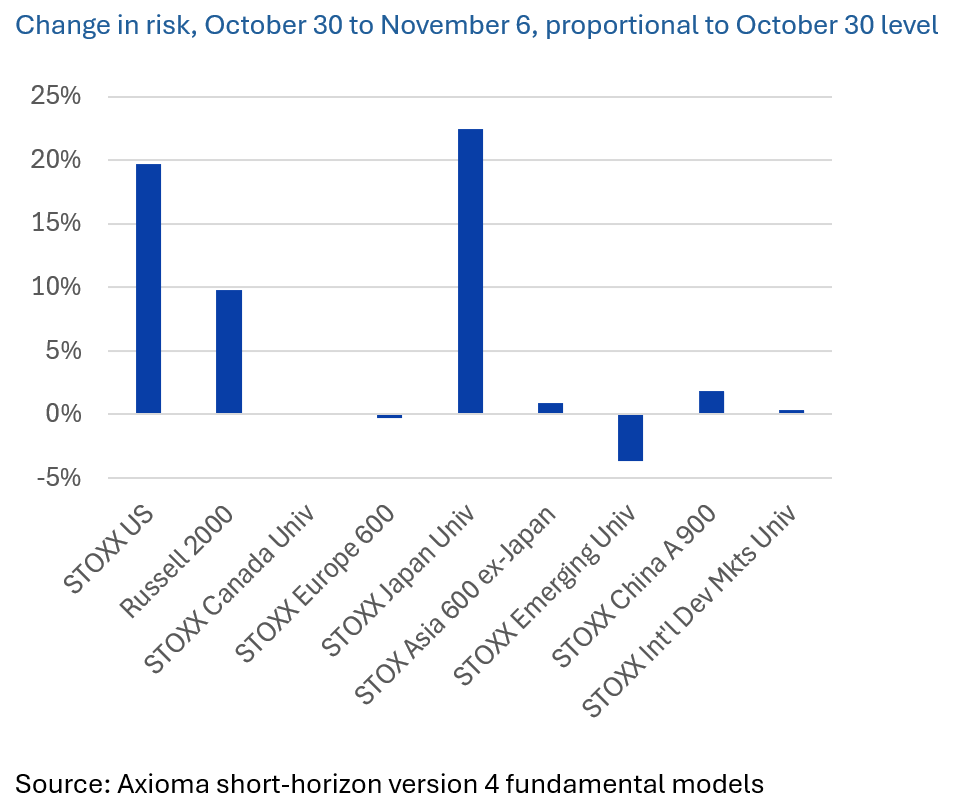
As a result of the market plunge, predicted equity risk jumped, but mainly in the US (including for both of our AI-based portfolios) and Japan. While it remains well below highs reached earlier this year, we expect it to continue to rise unless the market settles down quickly. The sharp decline in the 36-stock AI portfolio led to a sharp increase in its risk, while the AI Infrastructure 5-name portfolio also saw risk jump. In comparison, the US market increase for last week looks small – but since it is from a lower base the percentage changes are similar.
The following charts do not appear in the Equity Risk Monitors but are available on request:
Finally, a note about factor performance
We wrote about the outsized performance of many style factors in the US (according to the Axioma US5.1 model) on the day of the market rout (you can see the LinkedIn post here). Fifteen of the 20 factors’ returns fell outside a one standard deviation band (using historical daily returns to calculate the standard deviation), 13 were outside a two-standard-deviation band and six factors saw three-standard-deviation performance.
However, in most cases the returns were in the same direction as the long- term average, so in the expected direction. A strong flight to quality could be seen in negative returns to Downside Risk, Residual Volatility and Market Sensitivity. Returns were positive, the likely direction of a portfolio bet, in Crowding, Earnings Yield and Profit Quality. And interestingly, although one of the data center issues is the high cost of debt, the return to Leverage was positive, and about a three standard deviation return. This may be because since much of the financing is off balance sheet, hyperscalers actually have lower than average Leverage.
At the same time, a few factors “misbehaved”. Short-term Momentum had a hugely positive return whereas it is expected to be negative. Not surprisingly, Short Interest was positive, as there was a large amount of short covering that day. Most notably, Medium-Term Momentum had a negative, three-standard-deviation return that fell into the bottom percentile of daily returns back to 1982.
There was a sharp reversal in factor performance on the next day, Friday November 6, creating something of a whipsaw effect along with the US market reversal. Once again, returns were outsized, with Downside Risk, Exchange Rate Sensitivity, Investment, Market Sensitivity, MidCap, Opinion Divergence, Profit Growth, Profit Quality, Short-Term Momentum, Short Interest and Value all seeing returns outside a one-standard-deviation band, and mostly in the opposite direction to the prior day. If you went away on Wednesday and came back the following Monday, you may have thought that not much happened, but you would have been wrong!
The following chart does not appear in the Equity Risk Monitors but is available on request:
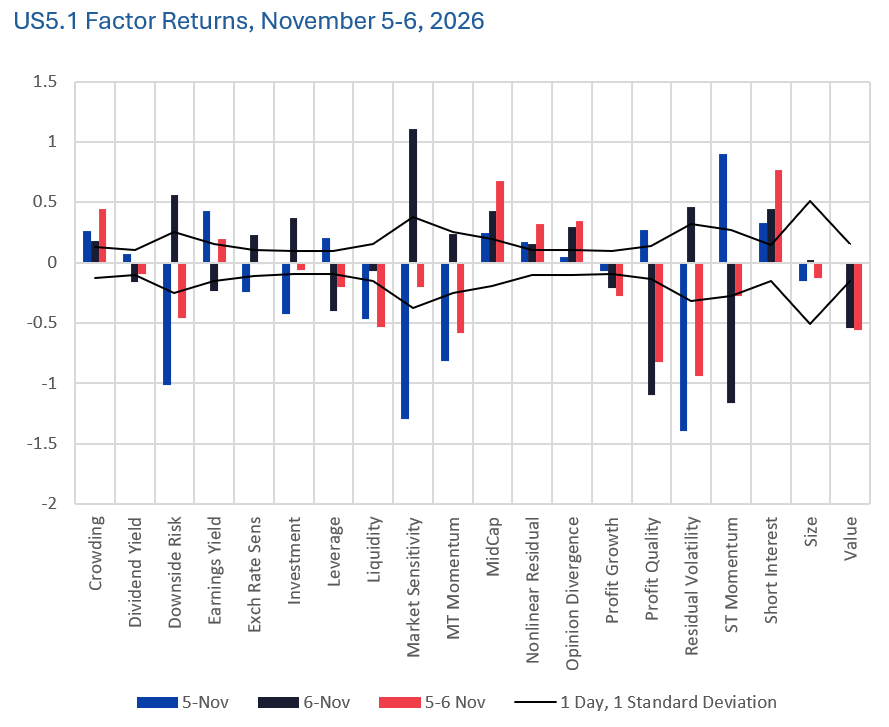
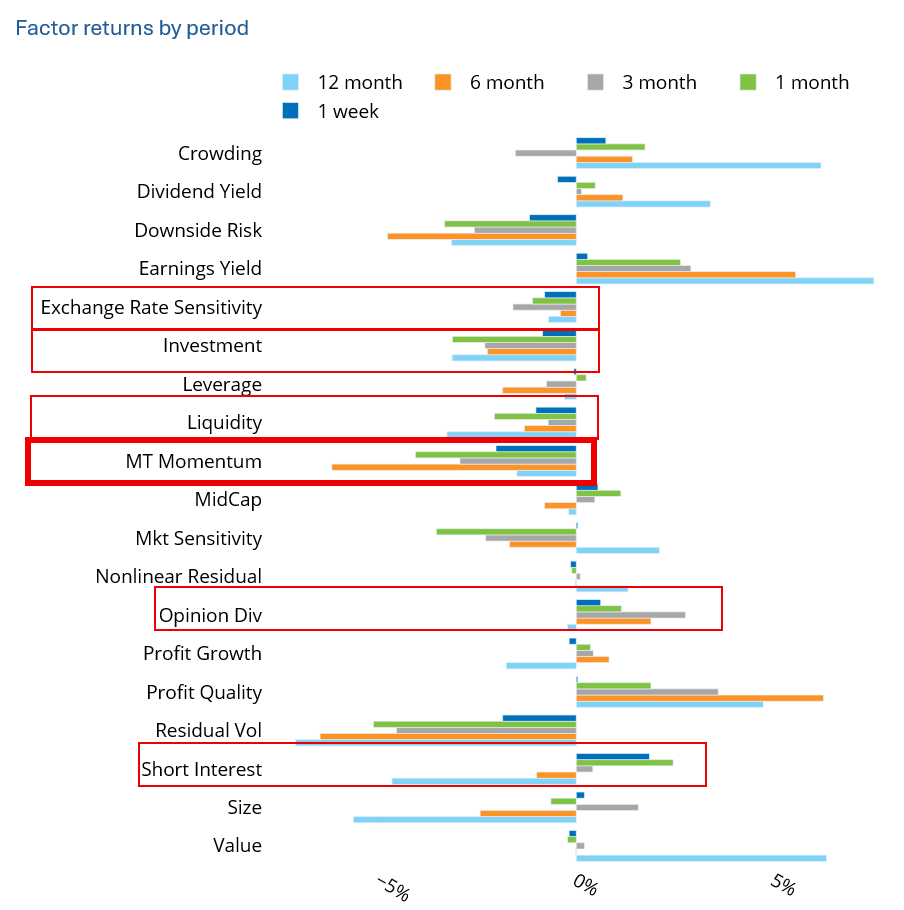
Medium-Term Momentum had even worse days on both Monday and Wednesday of last week, producing a full-week return of -2.03%, also a two-standard-deviation occurrence. (The factor is now down for the last week, month, 3 months, 6 months and 12 months.) In fact, for the full week, several other factors had 2-4 standard-deviation returns: Exchange Rate Sensitivity, Investment, and Liquidity (all negative), and Opinion Divergence and Short Interest (both unexpectedly positive).
See chart from the Russell 1000 Equity Risk Monitor as of November 6, 2026:
You may also like


