
EQUITY RISK MONITOR HIGHLIGHTS
WEEK ENDED MARCH 27, 2026
- The US market fell the most of 11 major markets last week, making March the worst month in more than three years…
- …yet style factors are “behaving” for the most part
- Oil had one of its highest-return months ever, and so did credit and term spreads, while Gold one of the worst
- Energy’s risk soared and many of its style exposures saw big changes
The US market fell the most of 11 major markets last week, making March the worst month in more than three years…
After the rout in the US market last week, March is on track to be the worst month for the US market since September of 2022 and among the 20 worst months in the past 30 years. Outside the US, March’s return to date is even lower than that of the US. This represents the worst month in six years and is among the 10 lowest monthly returns since at least the beginning of 1997, based on the Axioma Developed Markets ex-USA Market Portfolio.
The US equity market fared the worst of any of the major markets last week, dragging the year-to-date return to the lowest of the 11 markets as well. For March it falls in the middle of the pack.
The following chart does not appear in the equity risk monitors but is available on request.
Major index returns, last week, March to date and year to date, sorted by last week’s return
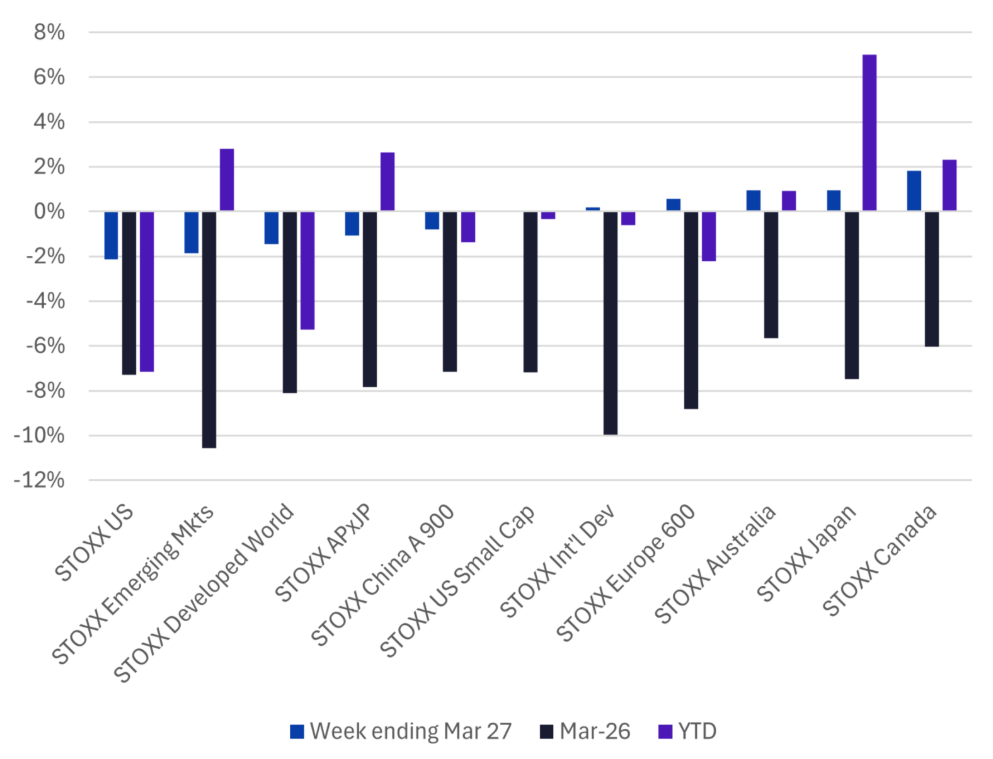
Note: STOXX China A 900, Europe 600, Australia, Japan and Canada returns are in their local currencies. All others are based in USD.
…yet style factors are “behaving” for the most part
Despite the market downturn, many style factors are behaving as expected, with month-to-date returns in the same direction as the long-term average. Where the return is in the opposite direction, it is in most cases not “outsized”, meaning it is within a two-standard deviation band based on the risk forecast at the beginning of March.
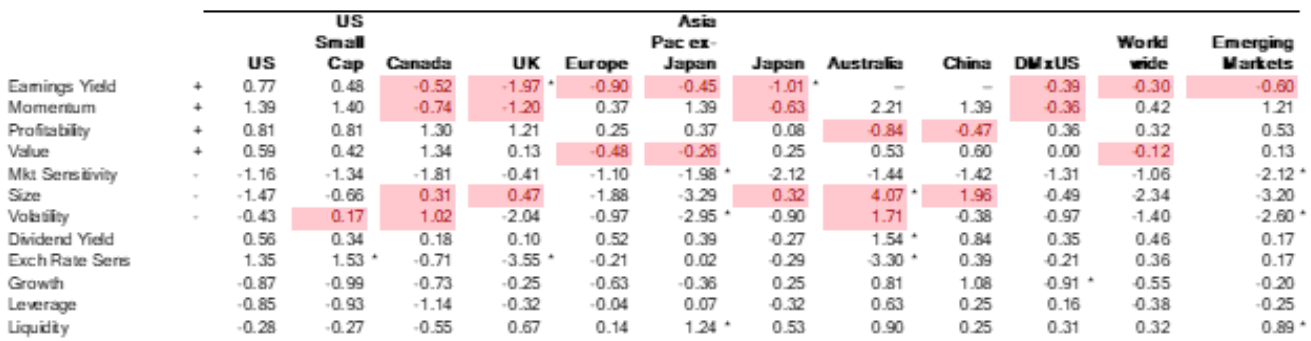
The table below is similar to what we show in our quarterly Insight presentation (register for the upcoming webinar here), but sorted slightly differently and highlighting where a factor in a region has the opposite sign to what is expected in pink. The asterisks continue to signify where the return fall outside a two standard deviation band. The “+” or “-“ next to the factor name is the expected sign, if the factor is believed to have a long term risk premium.
Only Earnings Yield seems to be having an unusually bad month across many regions, especially according to the Axioma UK and Japan version 4 models. Medium-Term Momentum’s return is positive, as expected, in eight of the 12 regions, and within the two-standard deviation band in all of them. Investors are seeking higher Profitability in all regions except Australia and China, and Value is performing well everywhere but Europe and Asia ex-Japan, as well as in the Worldwide model where its return is only slightly negative.
For factors where the long-term average return, and thus the expected risk premium, is negative, Market Sensitivity has delivered across the board, with particularly negative returns in Asia ex-Japan and Emerging Markets. This is not surprising given the overall flight to safety we are seeing. Higher Volatility stocks have fared well in US Small Cap, Canada and Australia, but the return has been negative – meaning lower Volatility names are outperforming – elsewhere.
Size returns are decidedly mixed, with larger-cap names beating their smaller counterparts in Canada, UK, Japan, China, and especially Australia. One might expect a falling market to favor larger, presumably safer names but we sometimes see that investors sell what they can – usually the higher capitalization holdings, so large-cap returns lag. Of course in the US, as the mega-cap tech selloff continues, the reasoning behind small-cap outperformance may be a little different.
Finally, we note that as the dollar strengthens as investors seek a presumably safe haven and interest rates are rising, stocks highly sensitive to movements in their local currency have seen some big returns. In other words, Exchange Rate Sensitivity saw a highly positive return in the US, especially in small-cap stocks, whereas it was negative in other regions (albeit with a small positive return in Emerging Markets).
The following table does not appear in the equity risk monitors but is available on request.
March-to-date style factor returns (through March 27), Version 4 models
Oil had one of its highest-return months ever, and so did credit and term spreads, while Gold one of the worst
Although we do not produce a risk monitor for the Worldwide Macroeconomic Projection model, we found that the current environment of higher oil prices and inflation expectations, along with widening credit and term spreads merits a discussion. The month-to-date returns to many of the macro factors in the models were exceedingly high or low compared with history, assuming we do not see a major change in direction for the rest of the month.
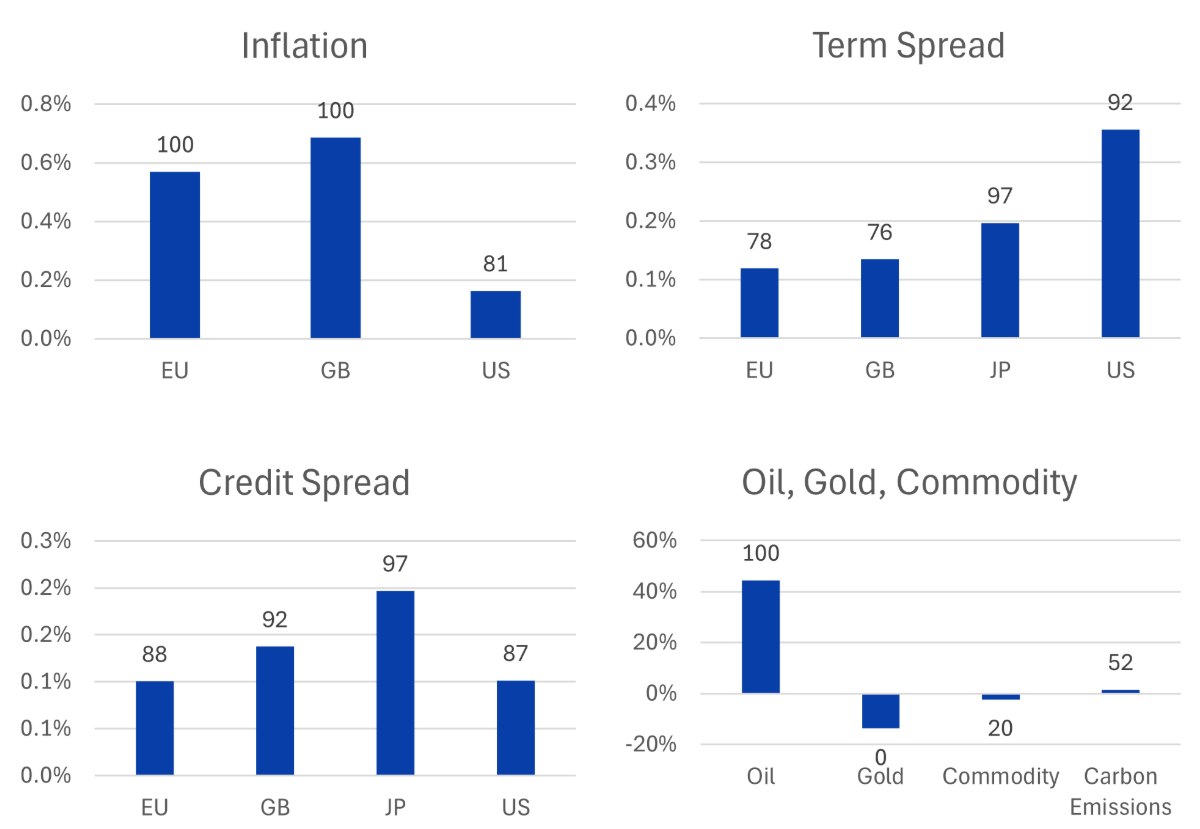
Sharply higher oil prices as a result of the Iran war and closing of the Strait of Hormuz has had a dramatic effect on inflation expectations. Both EU and GB Inflation’s returns (based on changes in 5-year break-even inflation) were the second-highest in the history of the model. While US Inflation’s return was not quite as historically high, it was in the top quintile.
Yield curves have steepened even as short rates increased. Longer-term bond yields were driven even higher from higher inflation expectations and prospects for more government spending. Term-spread returns (using the change in the 10-year to 6-month spread) were in the top quartile for EU and GB, and in the top decile for JP and US. Credit spread returns (based on returns for the 5-year node of BBB spread) were similarly high, in or near the top decile, a result of increasing economic concerns and higher rates , while the only month in which the return to oil was higher was in May 2020.
The sharp investor retreat from Gold – apparently no longer considered a safe haven - led to a return that was only more highly negative once in the model’s history, on the heels of the Global Financial Crisis in October 2008. This rout came after two months with top-decile returns.
The overall macro picture changed substantially in March as a result of the war in Iran, and it was quite obvious in the macro factor returns, which in many other cases – Oil, Inflation and Term Spreads - was a sharp reversal from February. (See our weekly ROOF highlights for more discussion of the implications, here.)
The following charts do not appear in the equity risk monitors but are available on request.
March-to-date macro factor returns (through March 27), percentile relative to history above or below bars
Energy’s risk soared and many of its style exposures saw big changes
Over the past month, global Energy stocks have gained almost 13%, while every other sector in the STOXX Developed World Index has experienced losses. We discussed the sector’s performance in detail in last week’s highlights (see here). This week we look at some of the risk characteristics of the sector, as the return spread between Energy and that of the worst-performing sector, Materials, is more than 25%. Energy’s relative strength means that its factor exposures have shifted, far more than for any other sector.
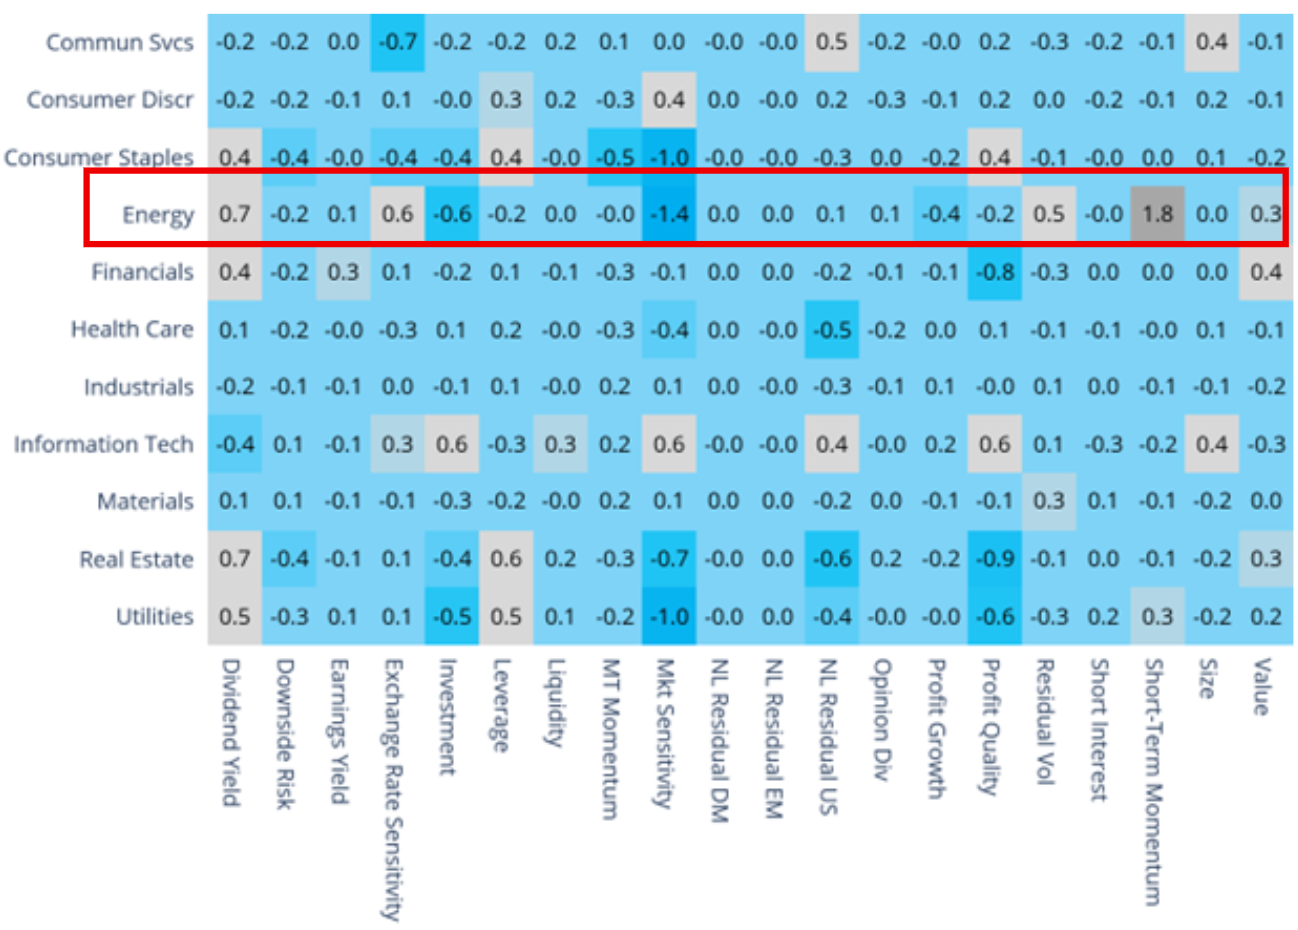
- Its exposures to value-oriented factors – Dividend Yield, Earnings Yield and Value have fallen as compared with a month ago as the sector’s stock prices have gone up. While Dividend Yield and Value exposures remain positive, Earnings Yield exposure for Energy stocks is now close to zero.
- Reflecting the recent relative strength, Energy’s exposure to Medium-Term Momentum is now close to zero, 0.21 standard deviations higher than it was at the beginning of March. As the uncertainty surrounding oil prices (and the stocks’ volatility) has increased, the exposure to Short-Term Momentum has also risen versus a month ago.
- Although the exposure to Short Interest is small in magnitude, it was slightly negative a month ago but is now positive.
- With a decrease of 0.9 standard deviations, the biggest change in exposure came from Market Sensitivity. The current reading of -1.4 is the most negative of any sector-style exposure.
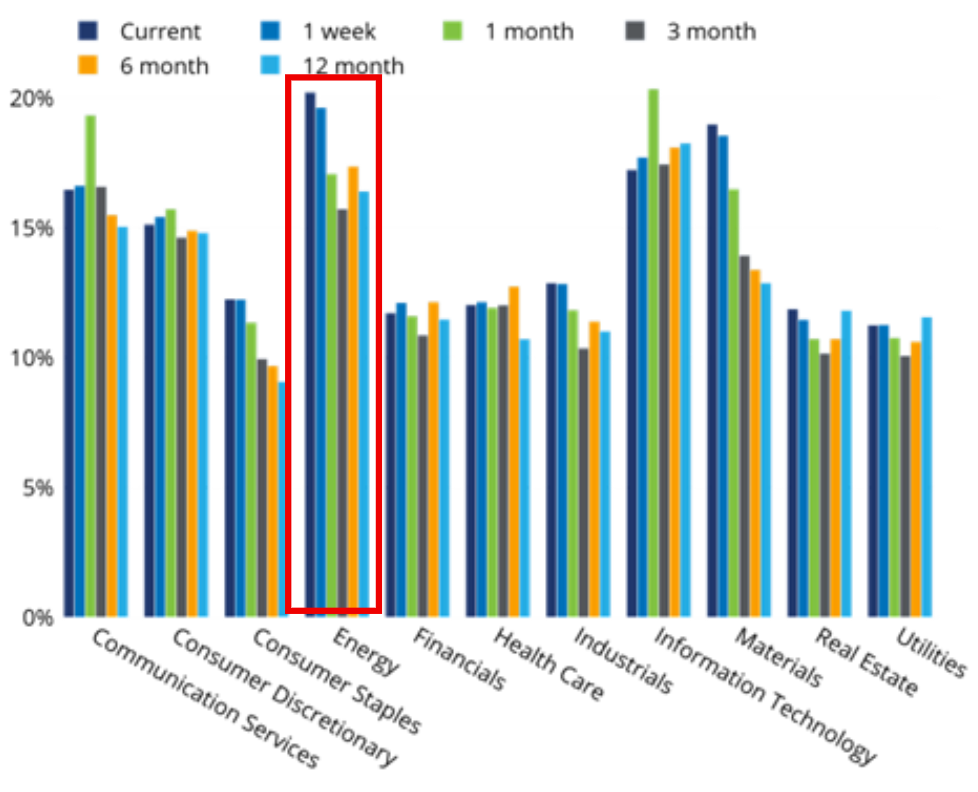
Investors with any bets on Energy may want to examine how the portfolio risks related to the sector have changed, especially since the overall risk in the sector is up about 18% (from 17.1% to 20.2%) over the past month, a bigger proportional increase than we have seen for any other sector.
See charts from the STOXX Developed Markets – WW5.1 Equity Risk Monitor as of March 27, 2026
STOXX Developed World – Sector Style Exposures
STOXX Developed World – Sector Risk
You may also like


