

EQUITY RISK MONITOR HIGHLIGHTS
WEEK ENDED APRIL 17, 2026
Axioma Risk Monitor: Markets recover war losses as leadership shifts; Rising markets mask a higher risk reality; Style Factors drive US Small Cap outperformance
Markets recover war losses as leadership shifts
After sharp, war-driven selloffs in March, global equity markets staged a powerful rebound in April. In several cases, markets not only recovered prior-month losses but also pushed higher than their levels at the outset of the US–Iran conflict on February 28. The result has been a reshuffling of regional winners and laggards.
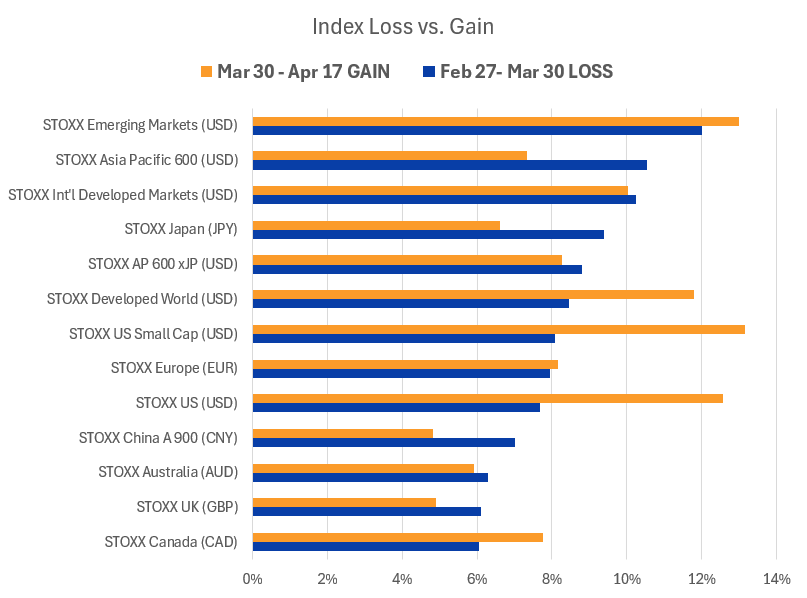
The initial shock from the escalation was broadly felt, but its severity varied significantly by region. Between February 27 and the market trough around March 30, Emerging Markets, Asia Pacific, and International Developed Markets (Developed Markets ex-US) experienced the steepest declines, falling between 10% and 12%. By contrast, Canada, the UK, and Australia proved more resilient, each declining by roughly 6%.
In the first week of April, markets began to “buy the rumor” of a ceasefire, and the rally accelerated sharply following the announcement of a two-week ceasefire on April 7. Even as the ceasefire remains fragile and a lasting agreement elusive, momentum carried through, with most major markets posting gains last week.
From March 30 to April 17, Emerging Markets and US equities led the recovery, each rising 13%. At the other end of the spectrum, China and the UK lagged, gaining about 5% over the same period.
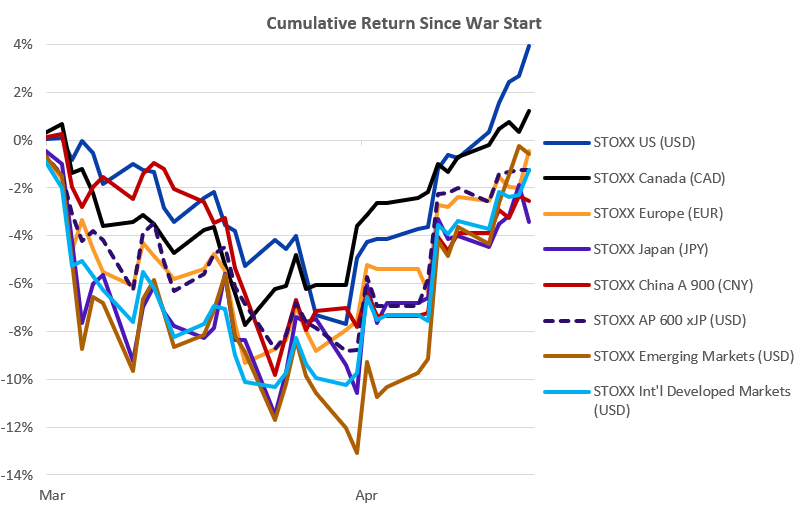
Across regions from the start of the war through last Friday, the US has been the top performer, up nearly 4%, followed by Canada. Most other regions have remained in negative territory since the war began, with Japan the weakest performer.
The charts below are not included in the Equity Risk Monitors but are available upon request:
Source: Axioma
Source: Axioma
Rising markets mask a higher risk reality
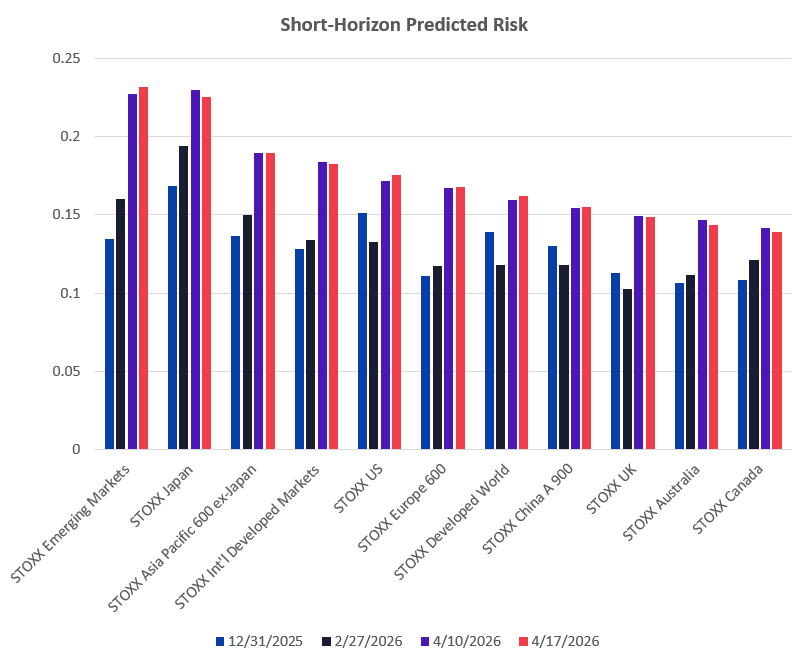
While stock performance has improved markedly, the risk environment tells a more nuanced, and less reassuring, story. Predicted volatility, as measured by Axioma’s short-horizon fundamental regional models, continued to rise last week across several major regions, including the US, Developed Markets, Emerging Markets, and China. Risk levels remained broadly unchanged in Europe and Asia Pacific ex-Japan, while declining modestly elsewhere. In short, rising markets have not been accompanied by a uniform easing of risk.
Since the war began, all regions have experienced double-digit proportional increases in predicted risk. The UK has seen the largest proportional rise, with risk up 45%, although it still ranks among the least risky markets in absolute terms—alongside Australia and Canada. Emerging Markets recorded the second-largest increase, starting from already elevated levels and now standing as the riskiest region overall, surpassing both Japan and the US—the riskiest regions at the beginning of the year.
Japan presents a contrasting case. Although it has seen one of the smallest increases in risk since the war began, its already high starting point means it remains the second riskiest region. The US now sits closer to the middle of the distribution.
As of last Friday, predicted risk of Emerging Markets and Japan stood at roughly 23%, more than 400 basis points above the next riskiest major region.
China has experienced one of the most pronounced shifts in risk positioning. After spending most of March as the least risky region, a sharp increase in volatility has pushed it squarely into the middle of the pack.
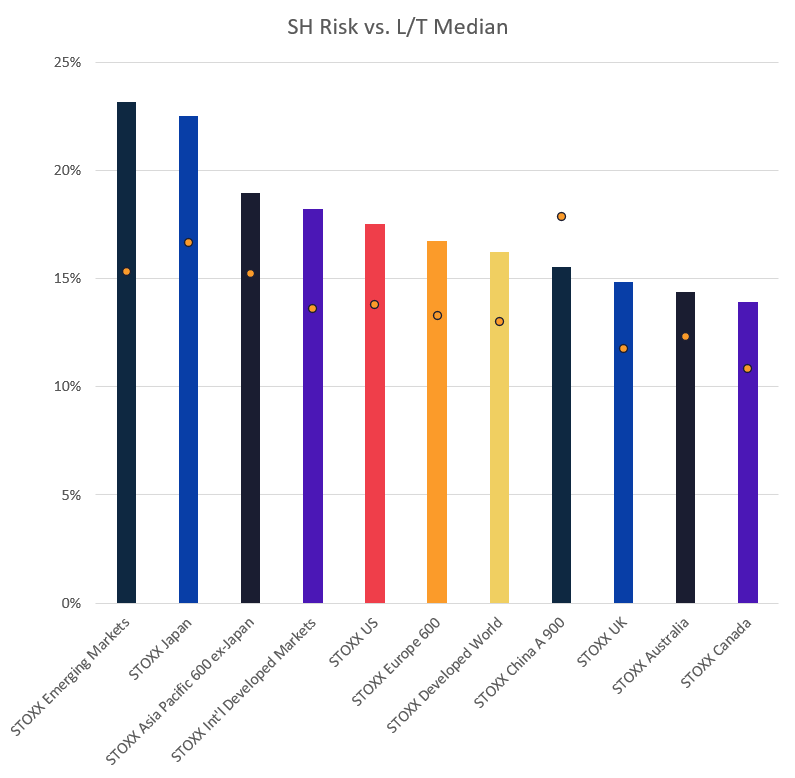
Importantly, current risk levels remain well above their beginning-of-the year levels. For all regions covered by the Equity Risk Monitors, except China, predicted risk is higher than the 14-year median. The gap is especially wide for Emerging Markets and Japan, where risk exceeds long-term medians by eight and six percentage points, respectively—highlighting that while markets may have rebounded, underlying volatility remains firmly elevated.
The charts below are not included in the Equity Risk Monitors but are available upon request:
Source: Axioma
Source: Axioma
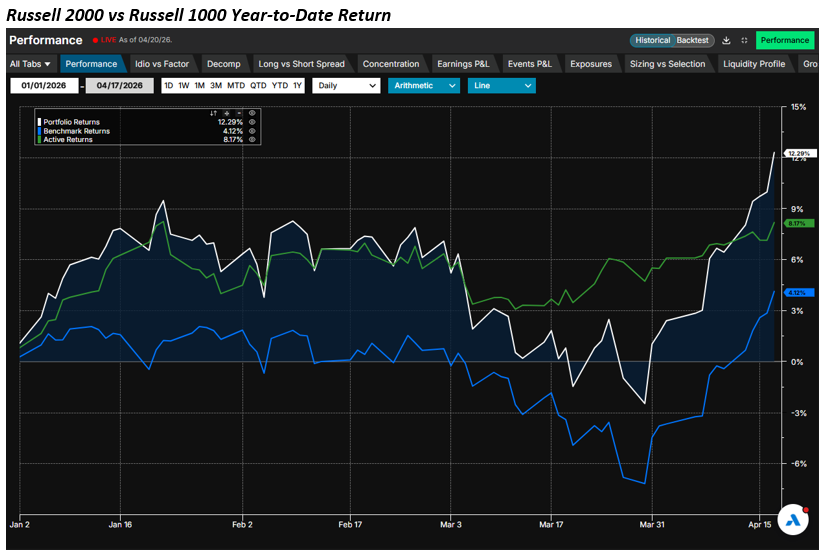
Style Factors drive Small Cap outperformance
US Small Cap stocks have continued to deliver a strong run, demonstrating notable resilience despite the whipsawing effects of the Iran war. Year to date, Small Caps have outperformed their Large Cap peers by more than eight percentage points. Importantly, this leadership has persisted throughout the conflict.
From the start of the war through the March 30 trough, both Small and Large Caps declined by roughly 8%, but Small Caps rebounded more decisively in the subsequent recovery.
This sustained outperformance largely reflects Small Caps’ excess gains prior to the war, driven by the fundamental forces outlined in the blog From Overlooked to Overperforming: The Factors Fueling Small Cap Strength.
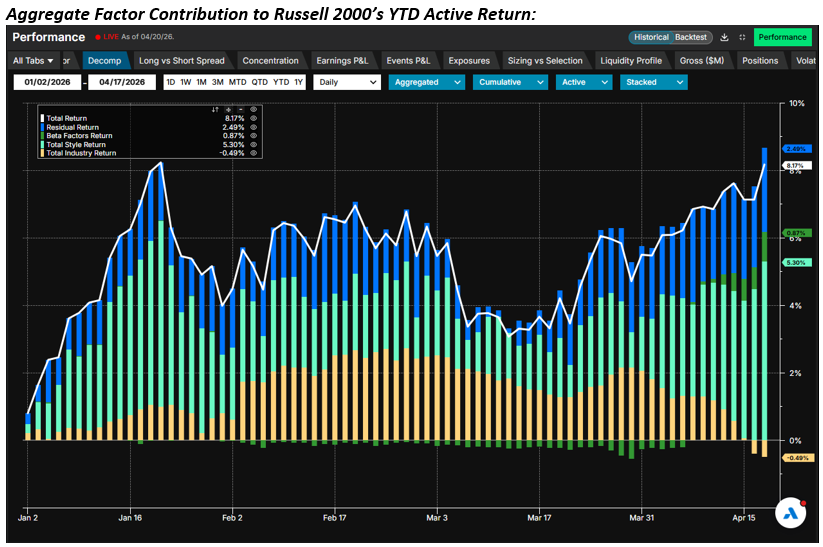
However, factor attribution results suggest an important shift beneath the surface. Based on the Axioma US5.1 fundamental short-horizon model, the Russell 2000’s relative performance since the start of the war has increasingly been driven by style factors and residual returns—capturing idiosyncratic stock-specific movements—rather than industry positioning.
Over the past two weeks in particular, industry effects have diminished and turned slightly negative. Within the industry component, negative contributions from Semiconductors and Technology Hardware more than offset the positive impact from Interactive Media and Software. As a result, the aggregate Industry contribution has exerted a modest drag on the Russell 2000’s active return, reinforcing the idea that Small Cap leadership is no longer industry-driven.
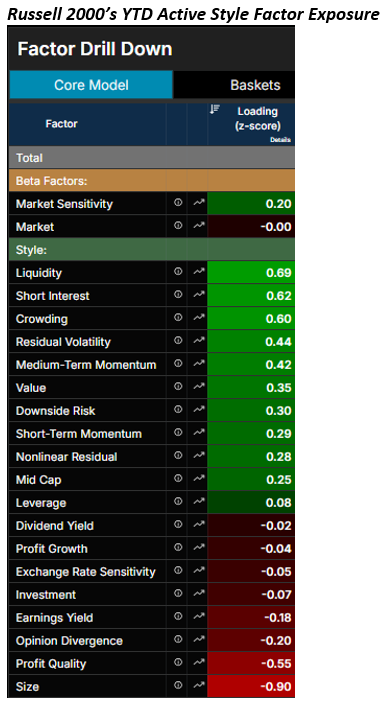
Style factors, by contrast, have become the dominant source of relative strength. Size, Momentum, Value, and Downside Risk have all contributed positively to Small Cap outperformance. While Size has posted a negative year-to-date return, Momentum, Value, and Downside Risk have delivered positive returns, with all four factors contributing negatively to the Russell 1000 and positively to the Russell 2000’s returns. This divergence stems from opposing factor exposures: Small Caps have negative exposure to Size and positive exposure to Momentum, Value, and Downside Risk, while Large Caps displayed the opposite profile for the YTD period.
Taken together, the evidence suggests that Small Cap outperformance has broadened beyond industry effects and is increasingly underpinned by favorable style factor dynamics and stock-specific drivers.
The charts below are not included in the Equity Risk Monitors but are available upon request:
Source: Arcana
Source: Arcana, Axioma
Source: Arcana, Axioma
You may also like


