EQUITY RISK MONITOR HIGHLIGHTS
WEEK ENDED JULY 3, 2026
- Russell Reconstitution Shakes Up Factor Exposures
- Momentum, Momentum Every Where
- Software is the Inverse of AI?
Markets entered the short week with strong returns, propelling both the S&P 500 and NASDAQ to their strongest quarters ending June 30 since the immediate post-COVID recovery in Q2 of 2020. By Wednesday July 1, investors became increasingly focused on the Fed’s interest rate path. A softer than expected June jobs report led to speculation that the Fed may have less urgency to tackle inflation and instead take a more doveish stance for the rest of the year. Internationally, negotiations in the Middle East continue to ease tensions, and semi-conductor stocks in Japan and Korea drove volatility in those markets.
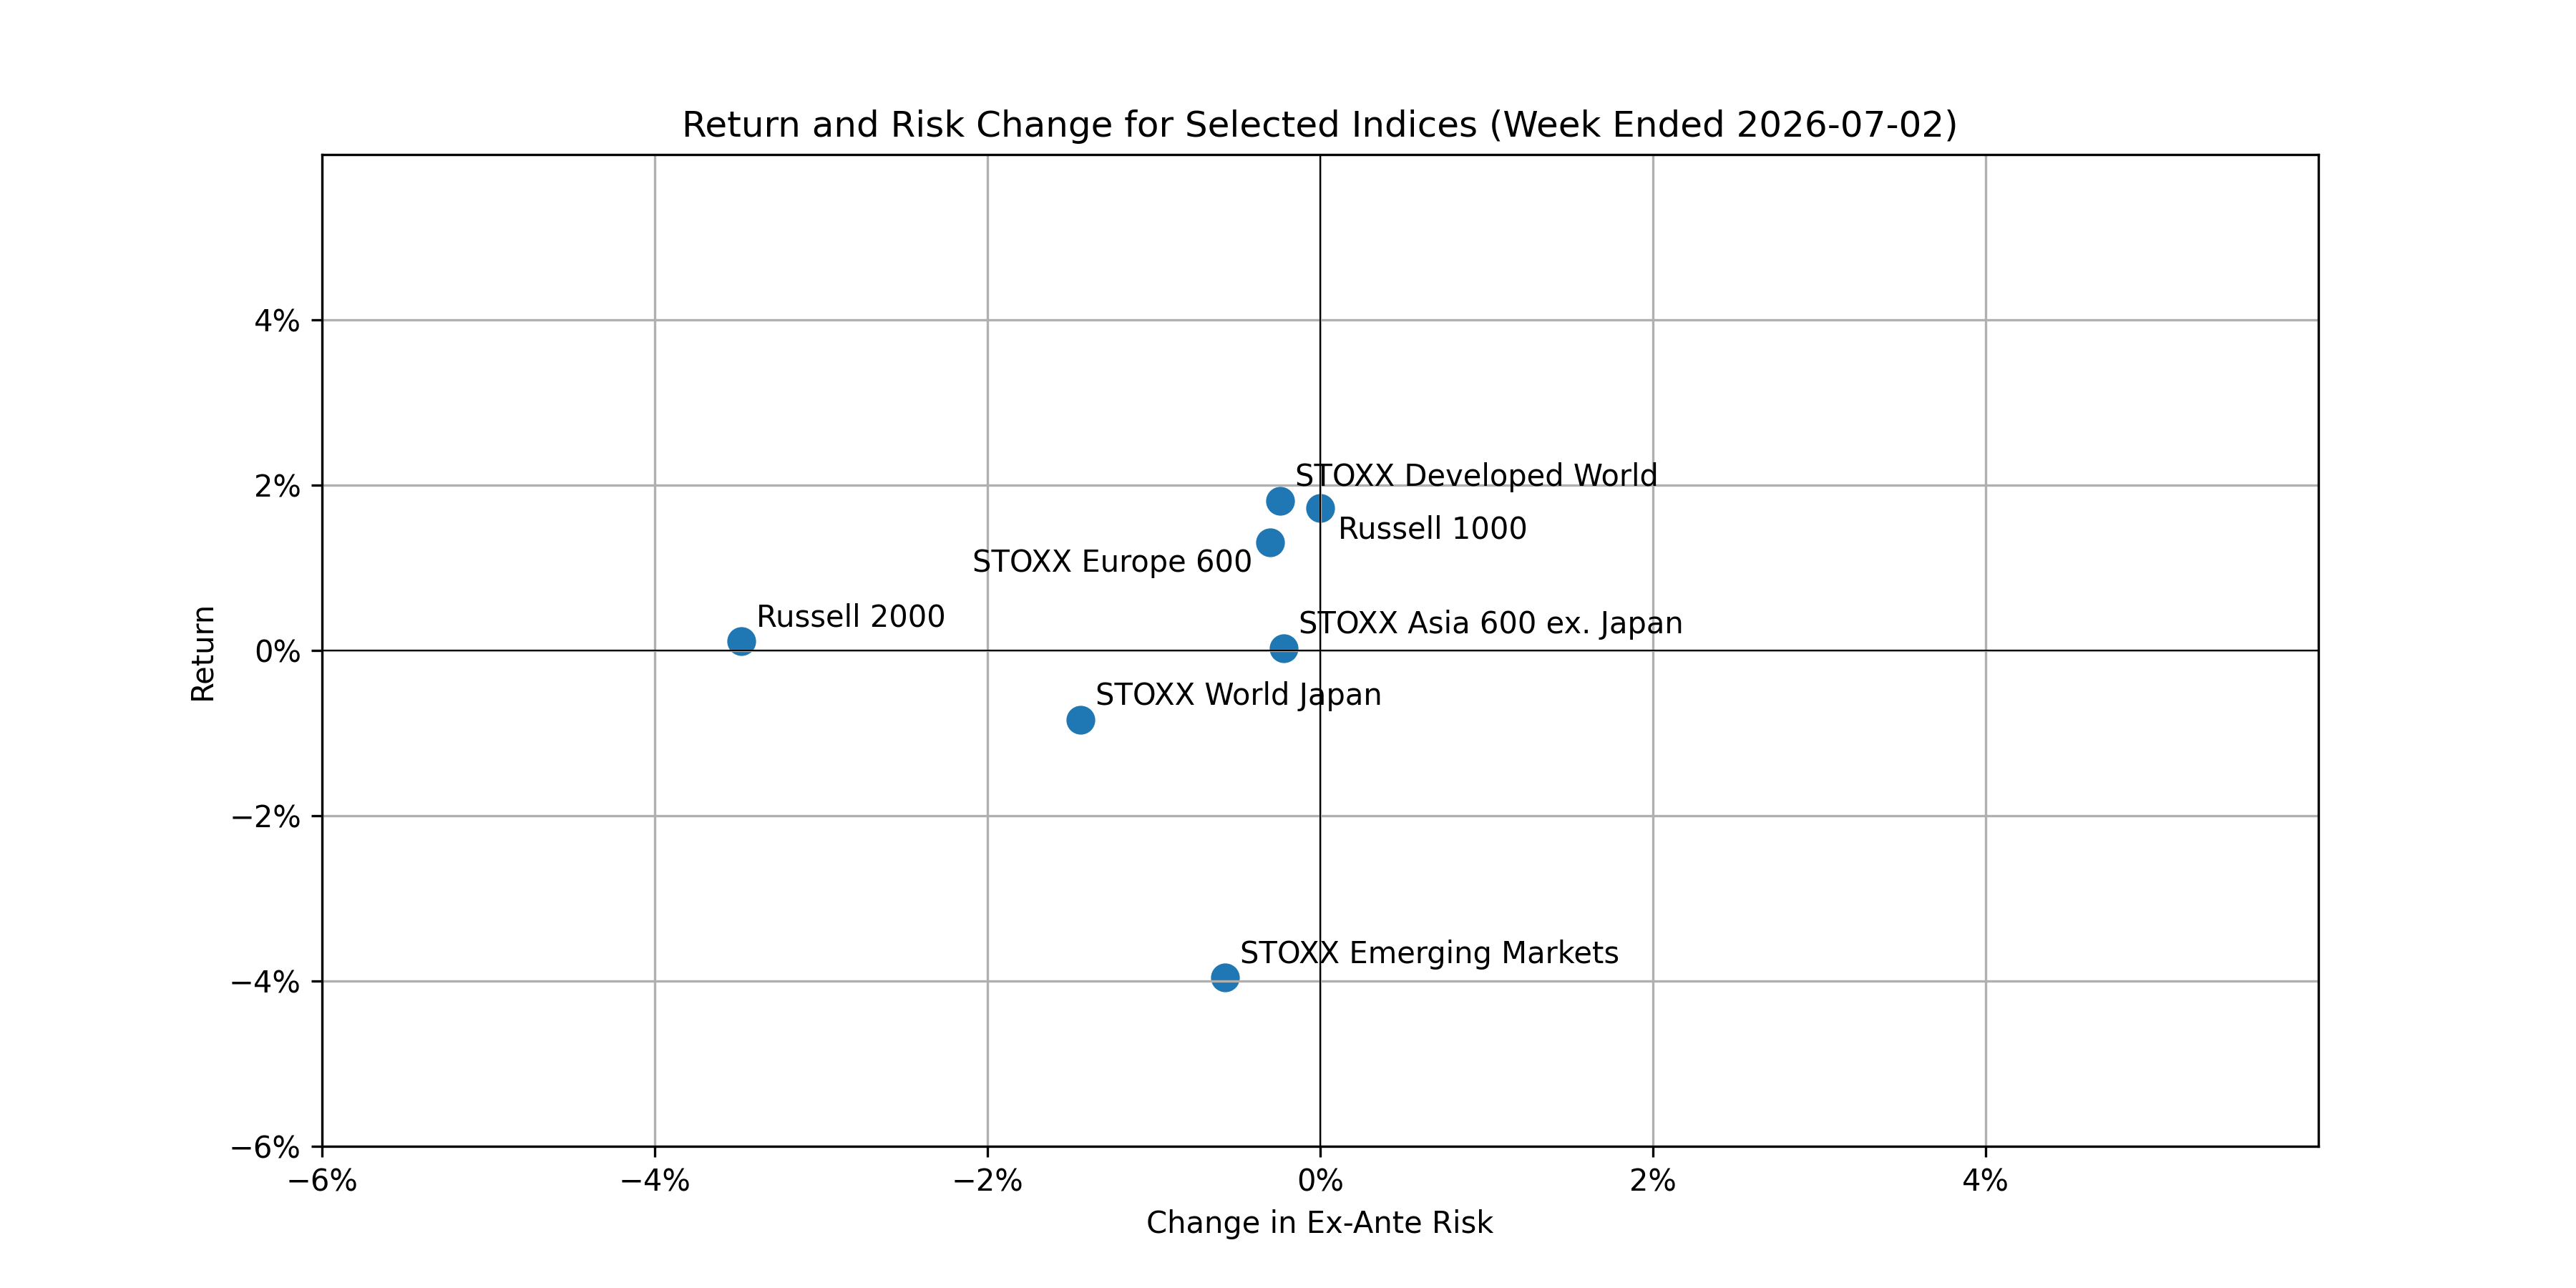
All the indices we track showed flat to decreasing risk. Despite posting an all-time mid-week high, the Russell 2000’s risk decreased significantly more than the other indexes due to a reconstitution that occurred after the close of June 26th.
The following chart is not included in the Equity Risk Monitors but is available on request:
Momentum Lost, Then Found
The Russell reconstitution drastically changed the ex-ante risk of the Russell 2000 across our Fundamental and Statistical models for both Medium and Short horizons.
See chart from Russell 2000 – Axioma United States Small Cap (AXUSSC4) Equity Risk Monitor as of July 3rd, 2026
Russell 2000 - Predicted Risk
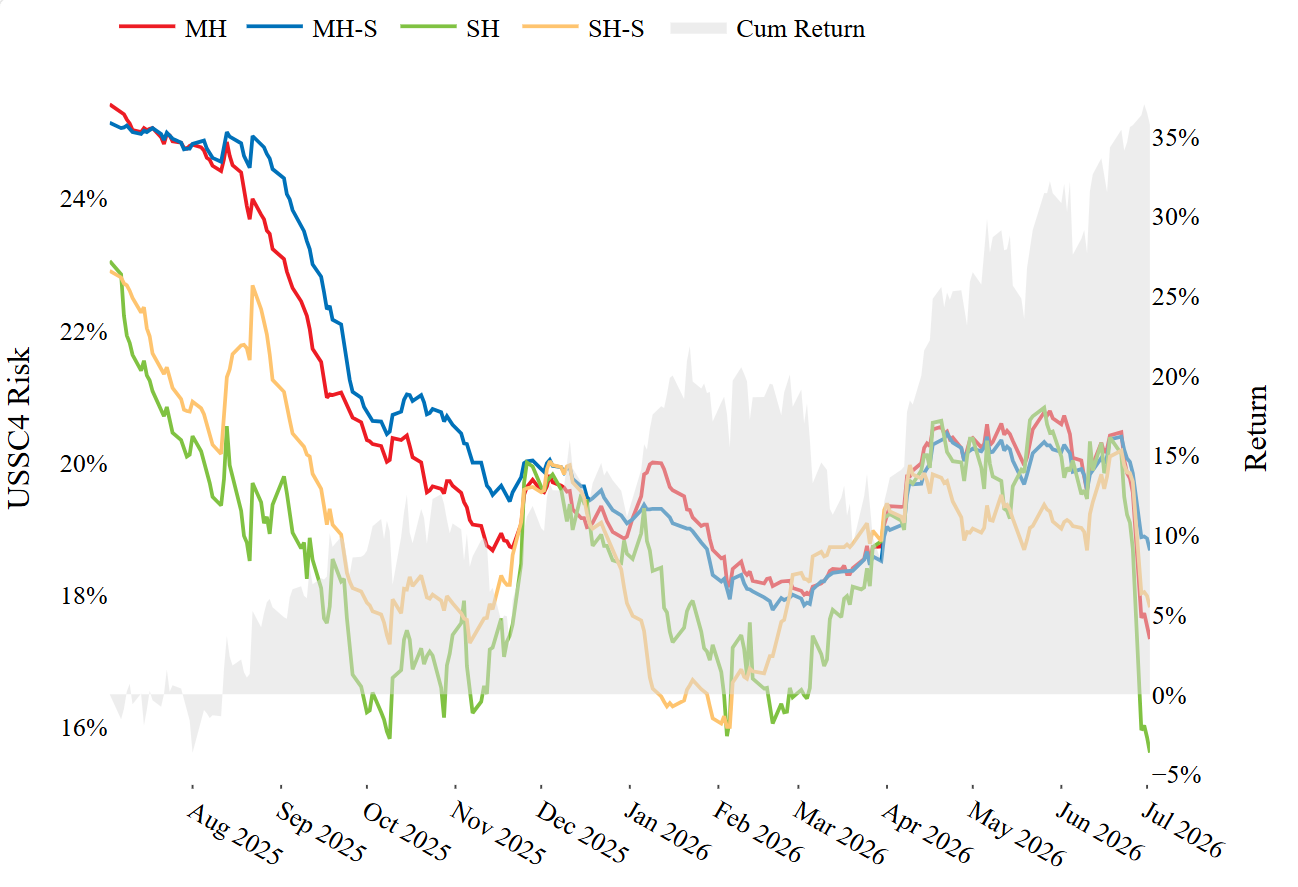
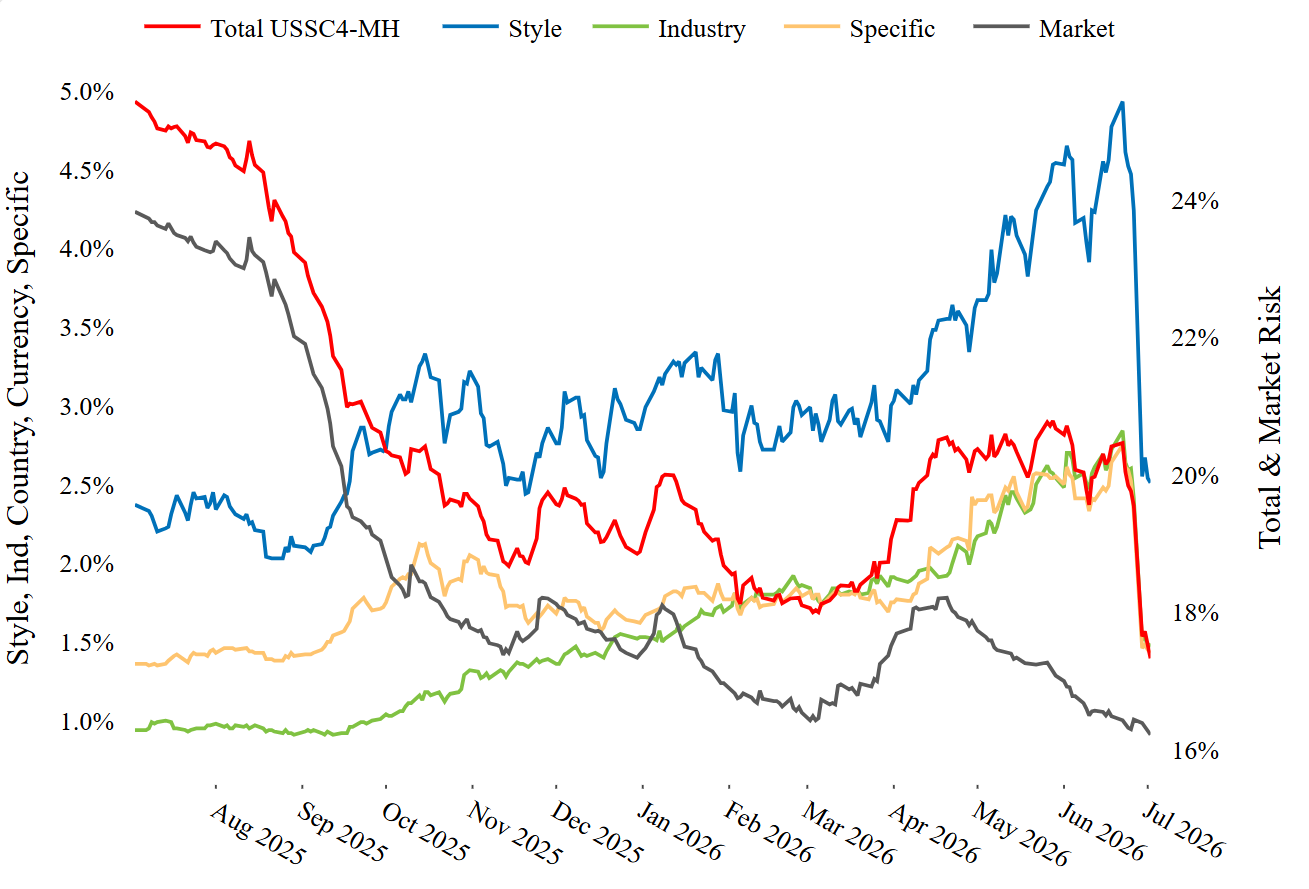
Taking a look at the change in the model’s components, we see that risk coming from Style drove most of the decrease with Industry making up the remainder.
See chart from Russell 2000 – Axioma United States Small Cap (AXUSSC4) Equity Risk Monitor as of July 3rd, 2026
Russell 2000 - Components of Risk
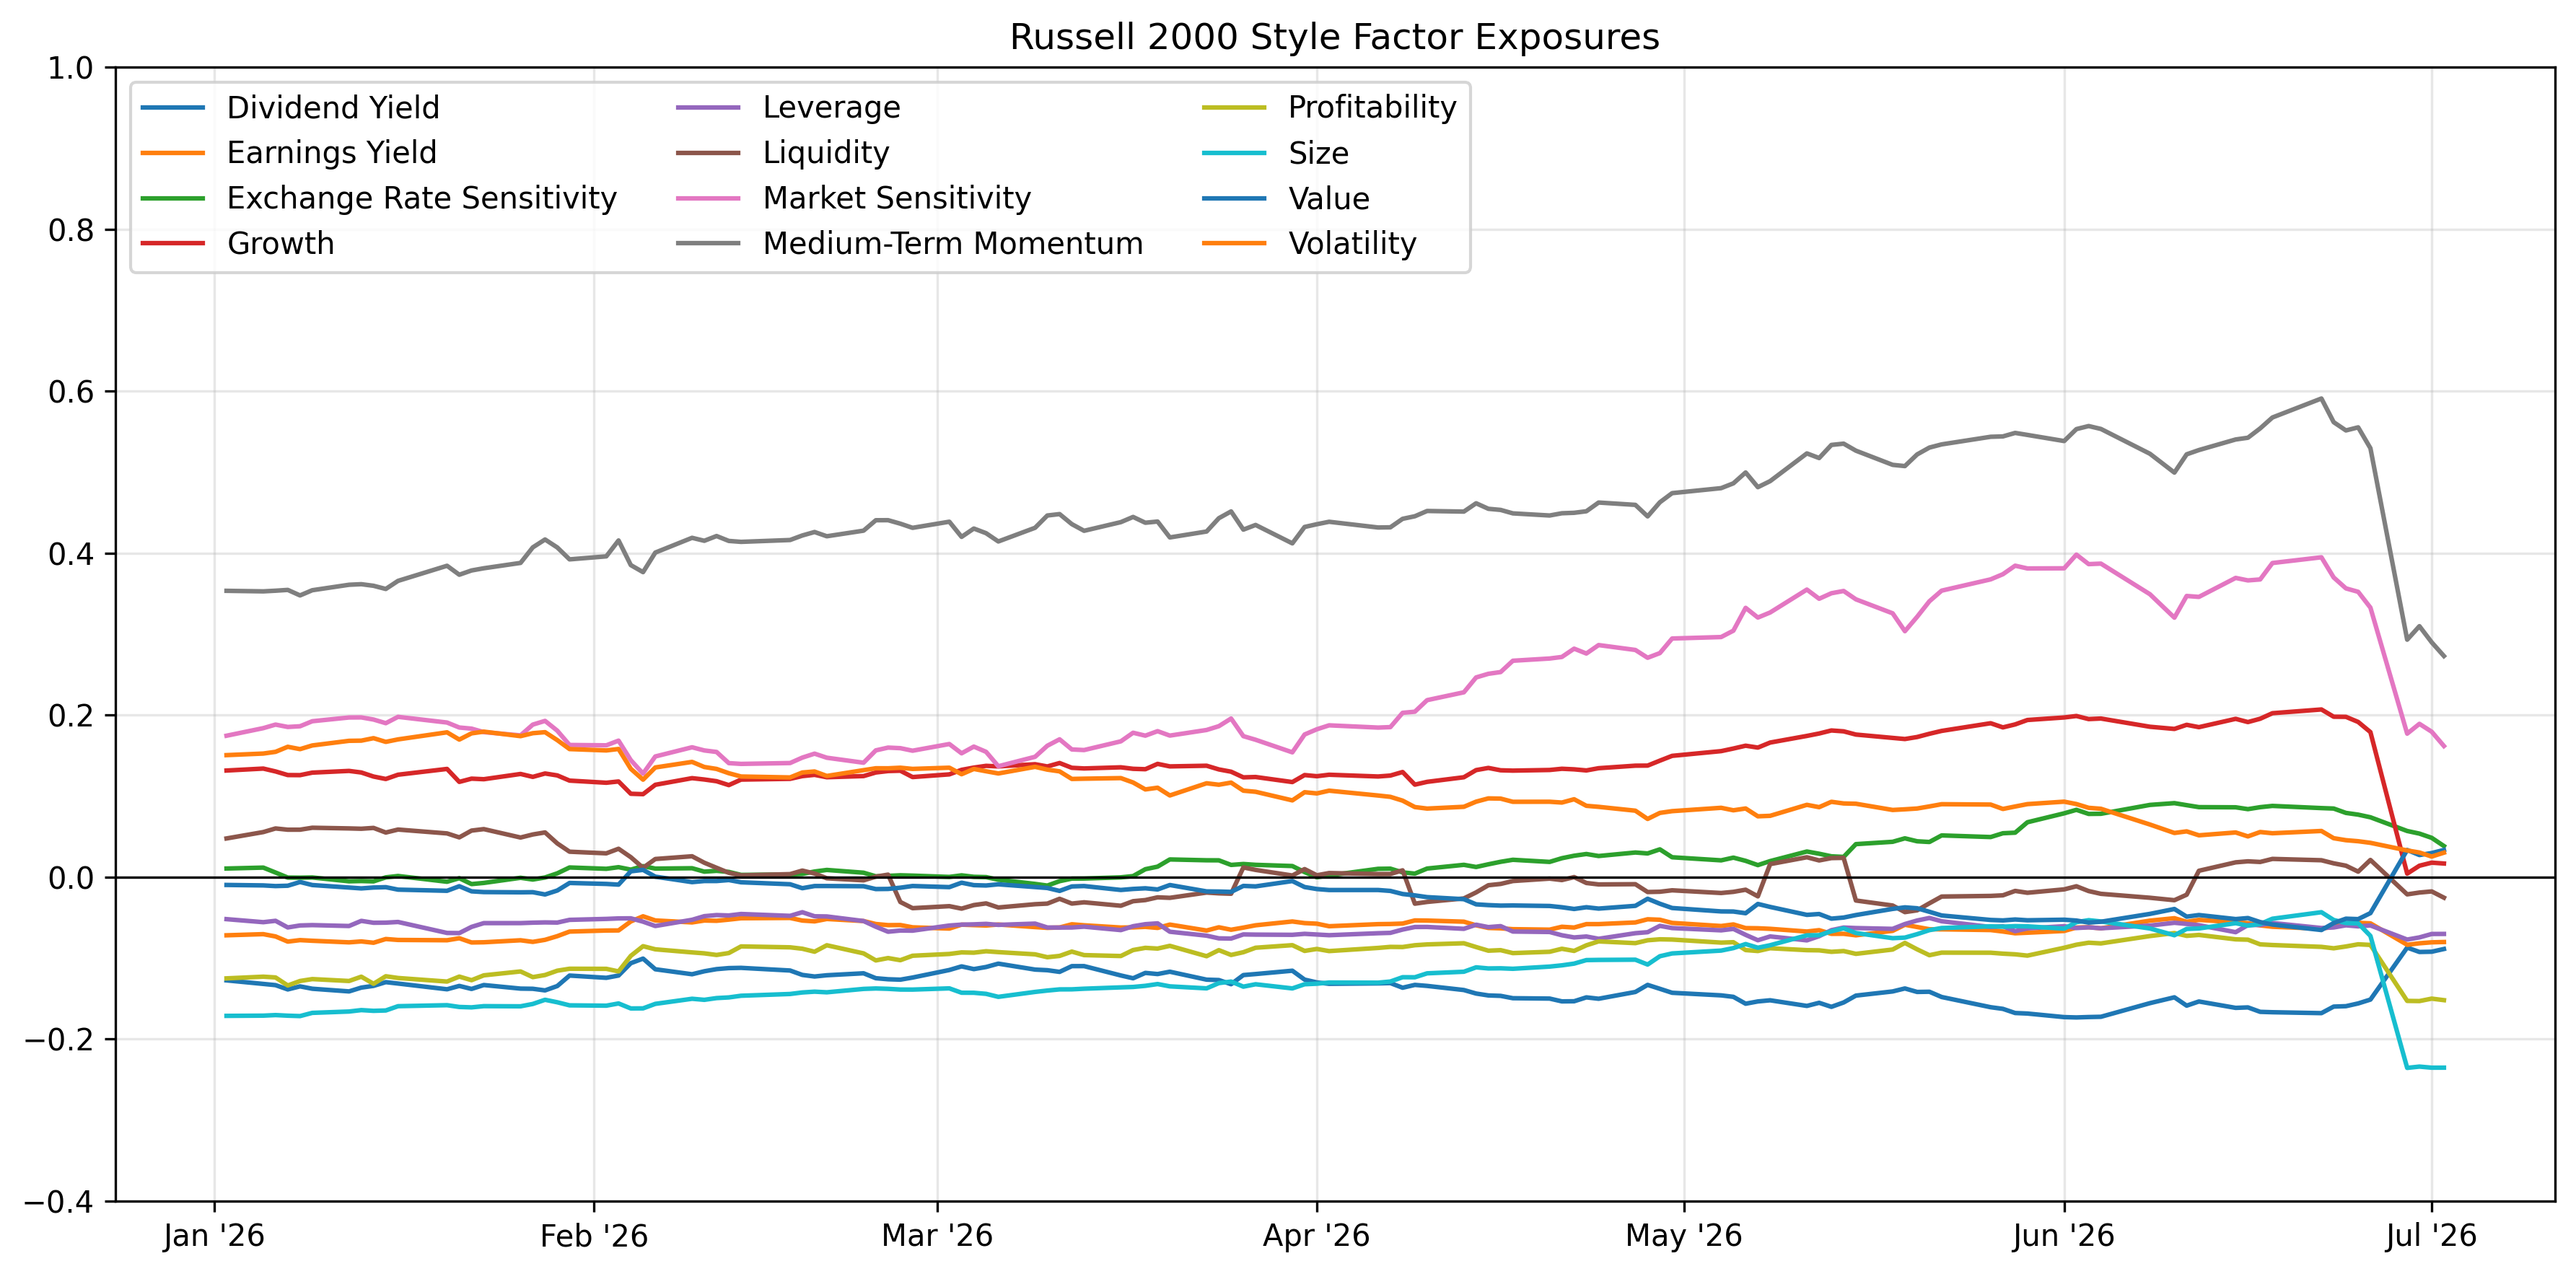
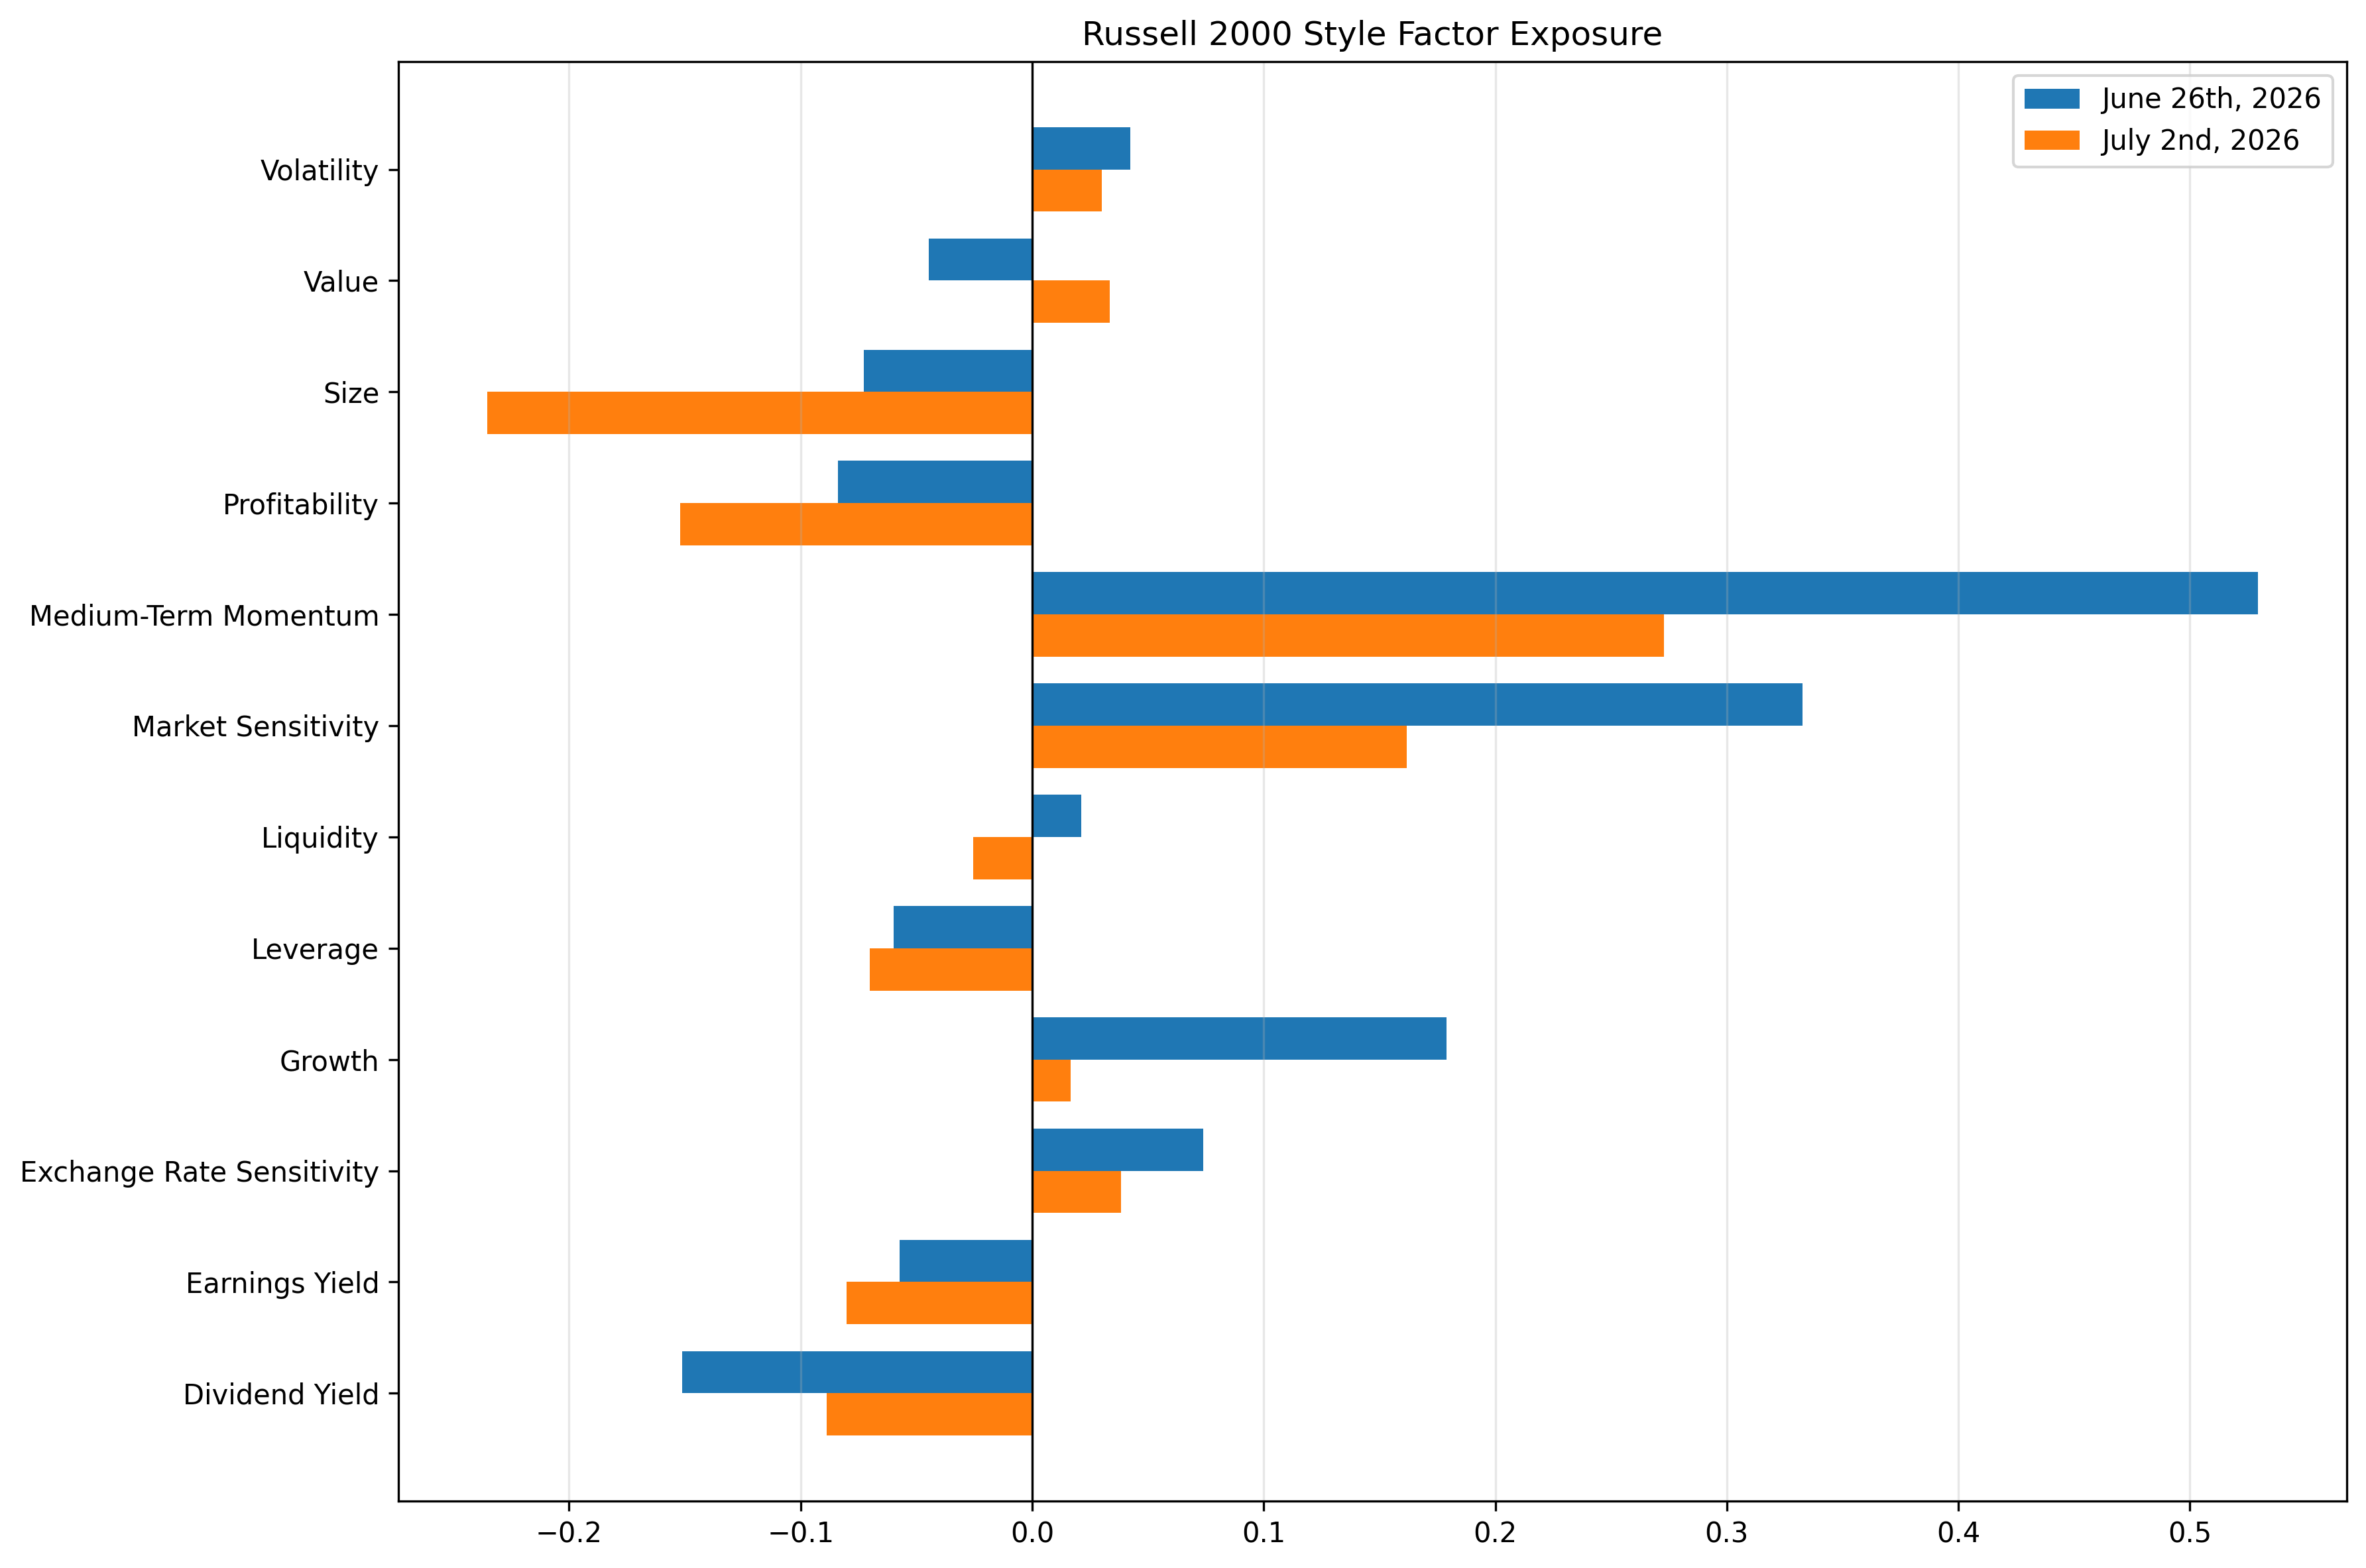
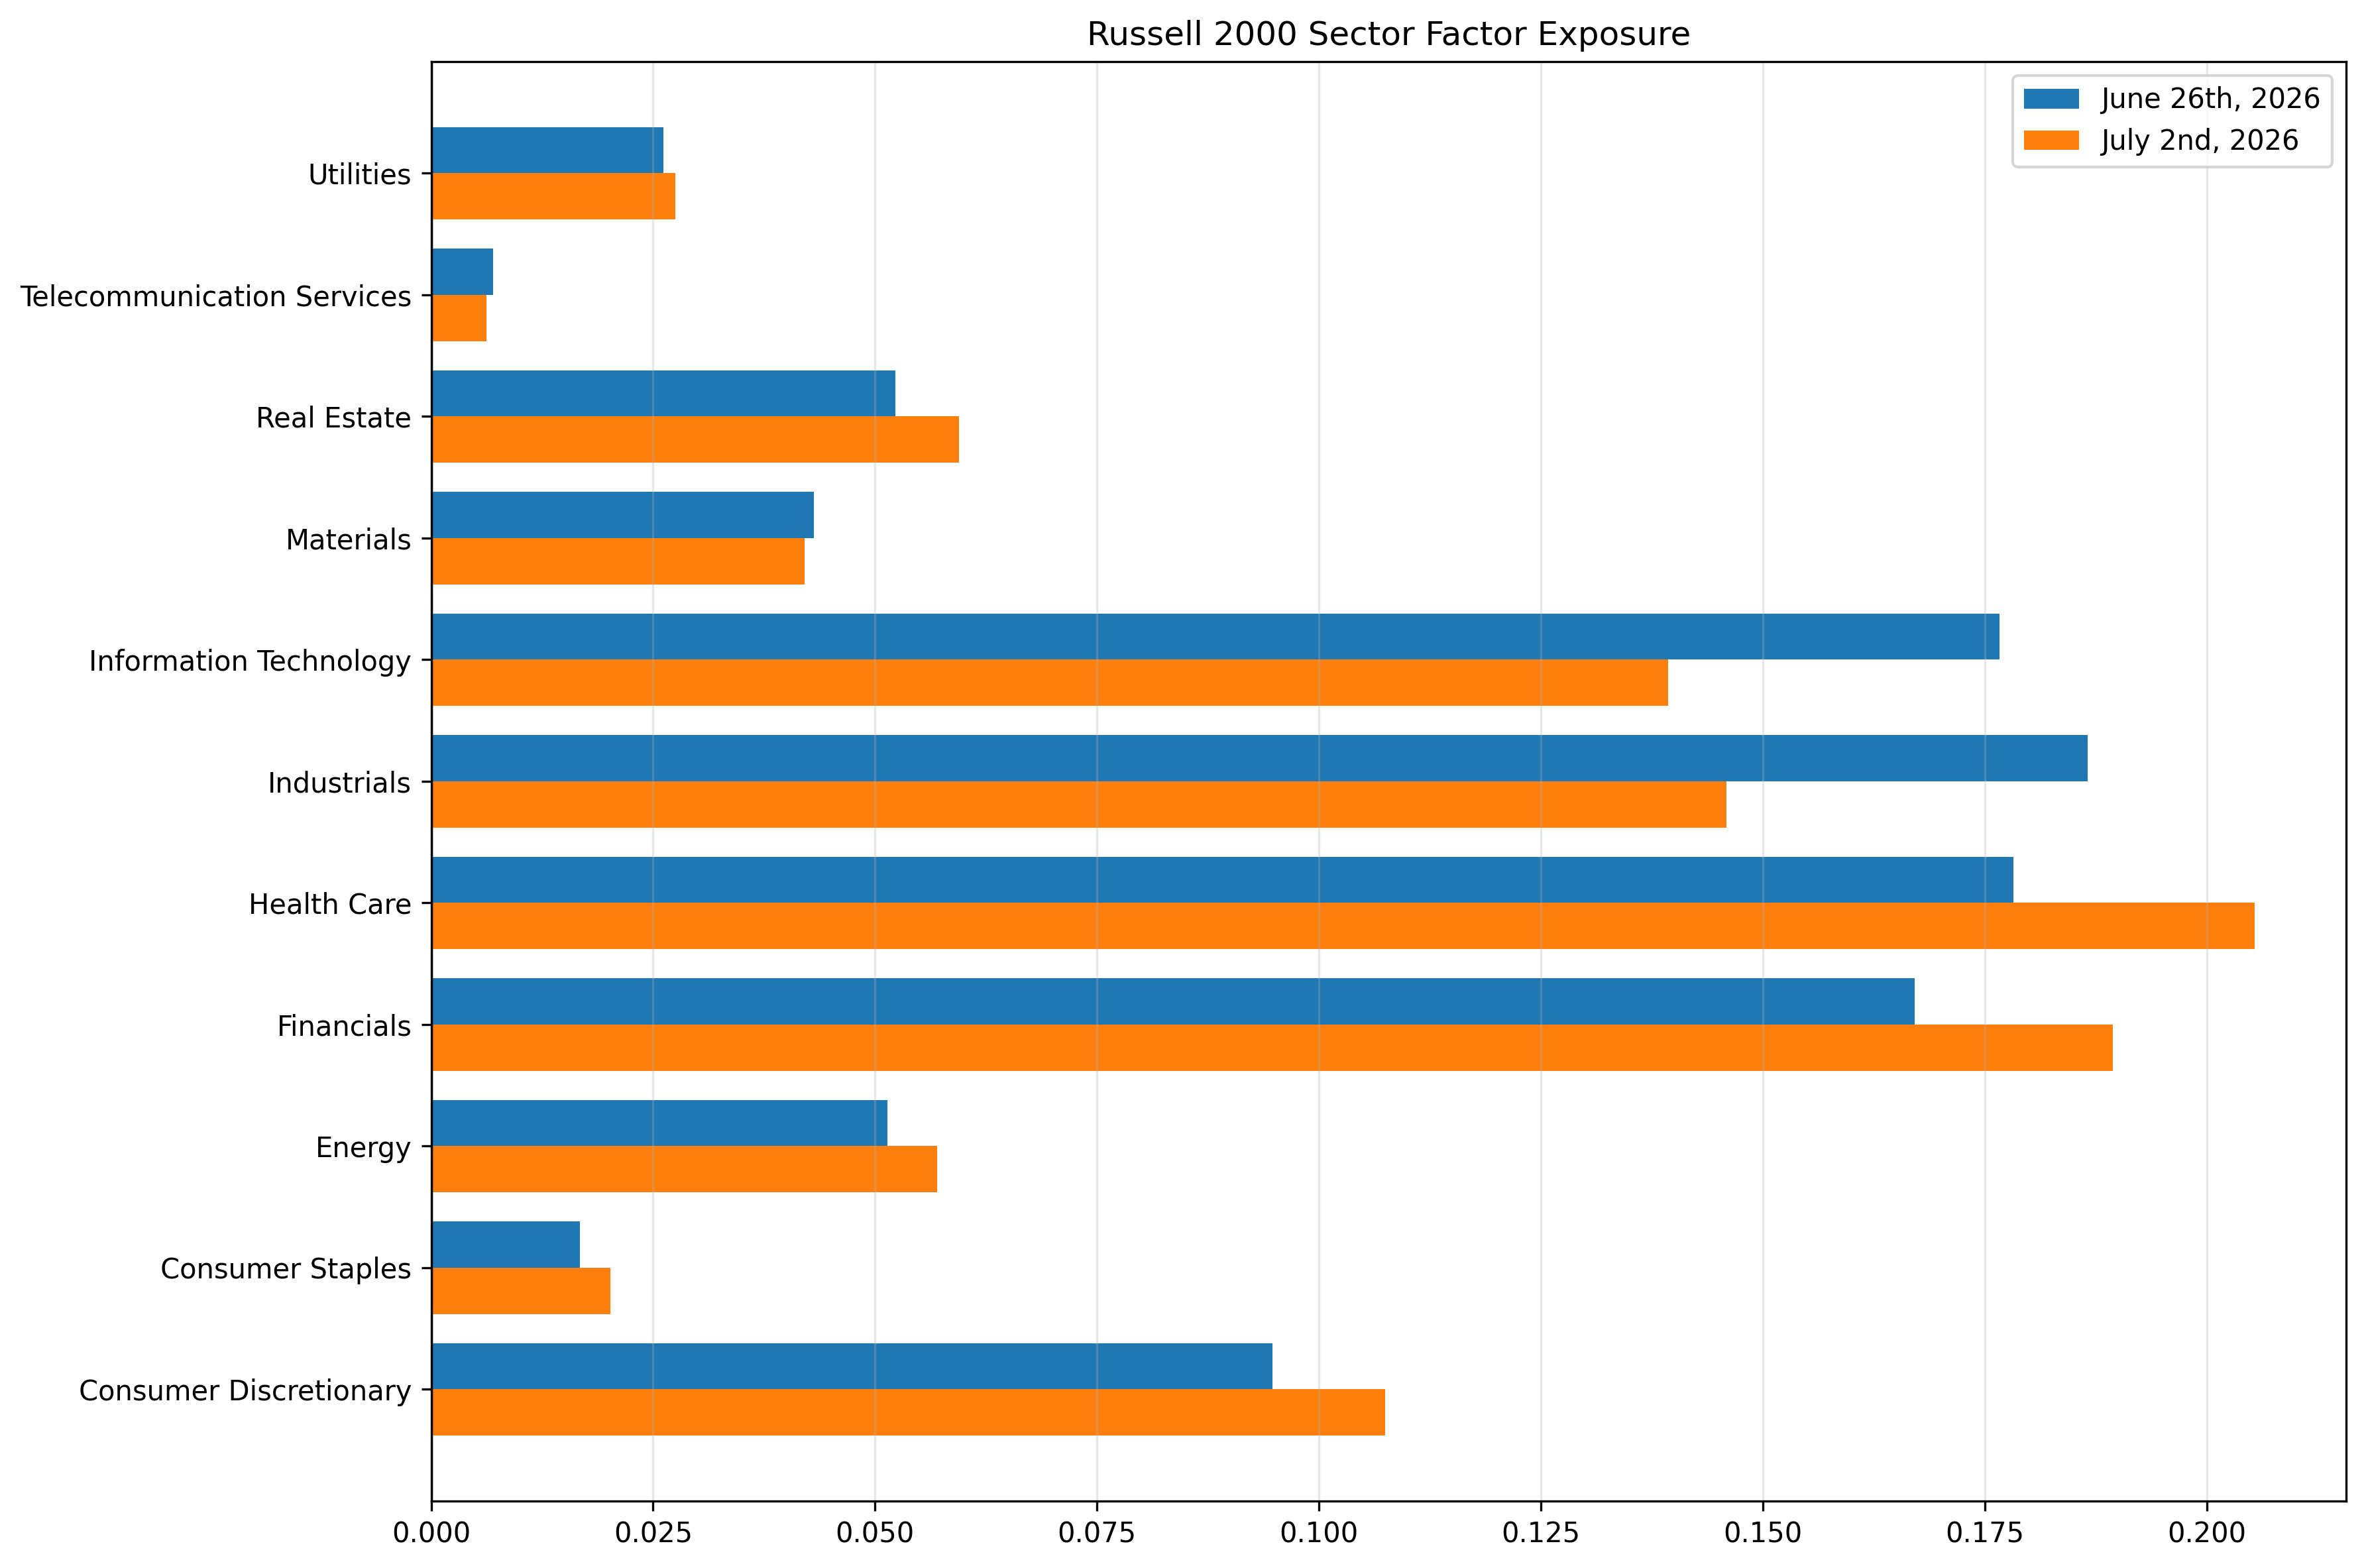
According to our data, the reconstitution moved the 21 largest names in the Russell 2000 into the Russell 1000, accounting for about 12.6% of the Russell 2000’s pre-move index weight. As a result, the Style and Industry factor exposures changed drastically overnight:
The following chart is not included in the Equity Risk Monitors but is available on request:
The following chart is not included in the Equity Risk Monitors but is available on request:
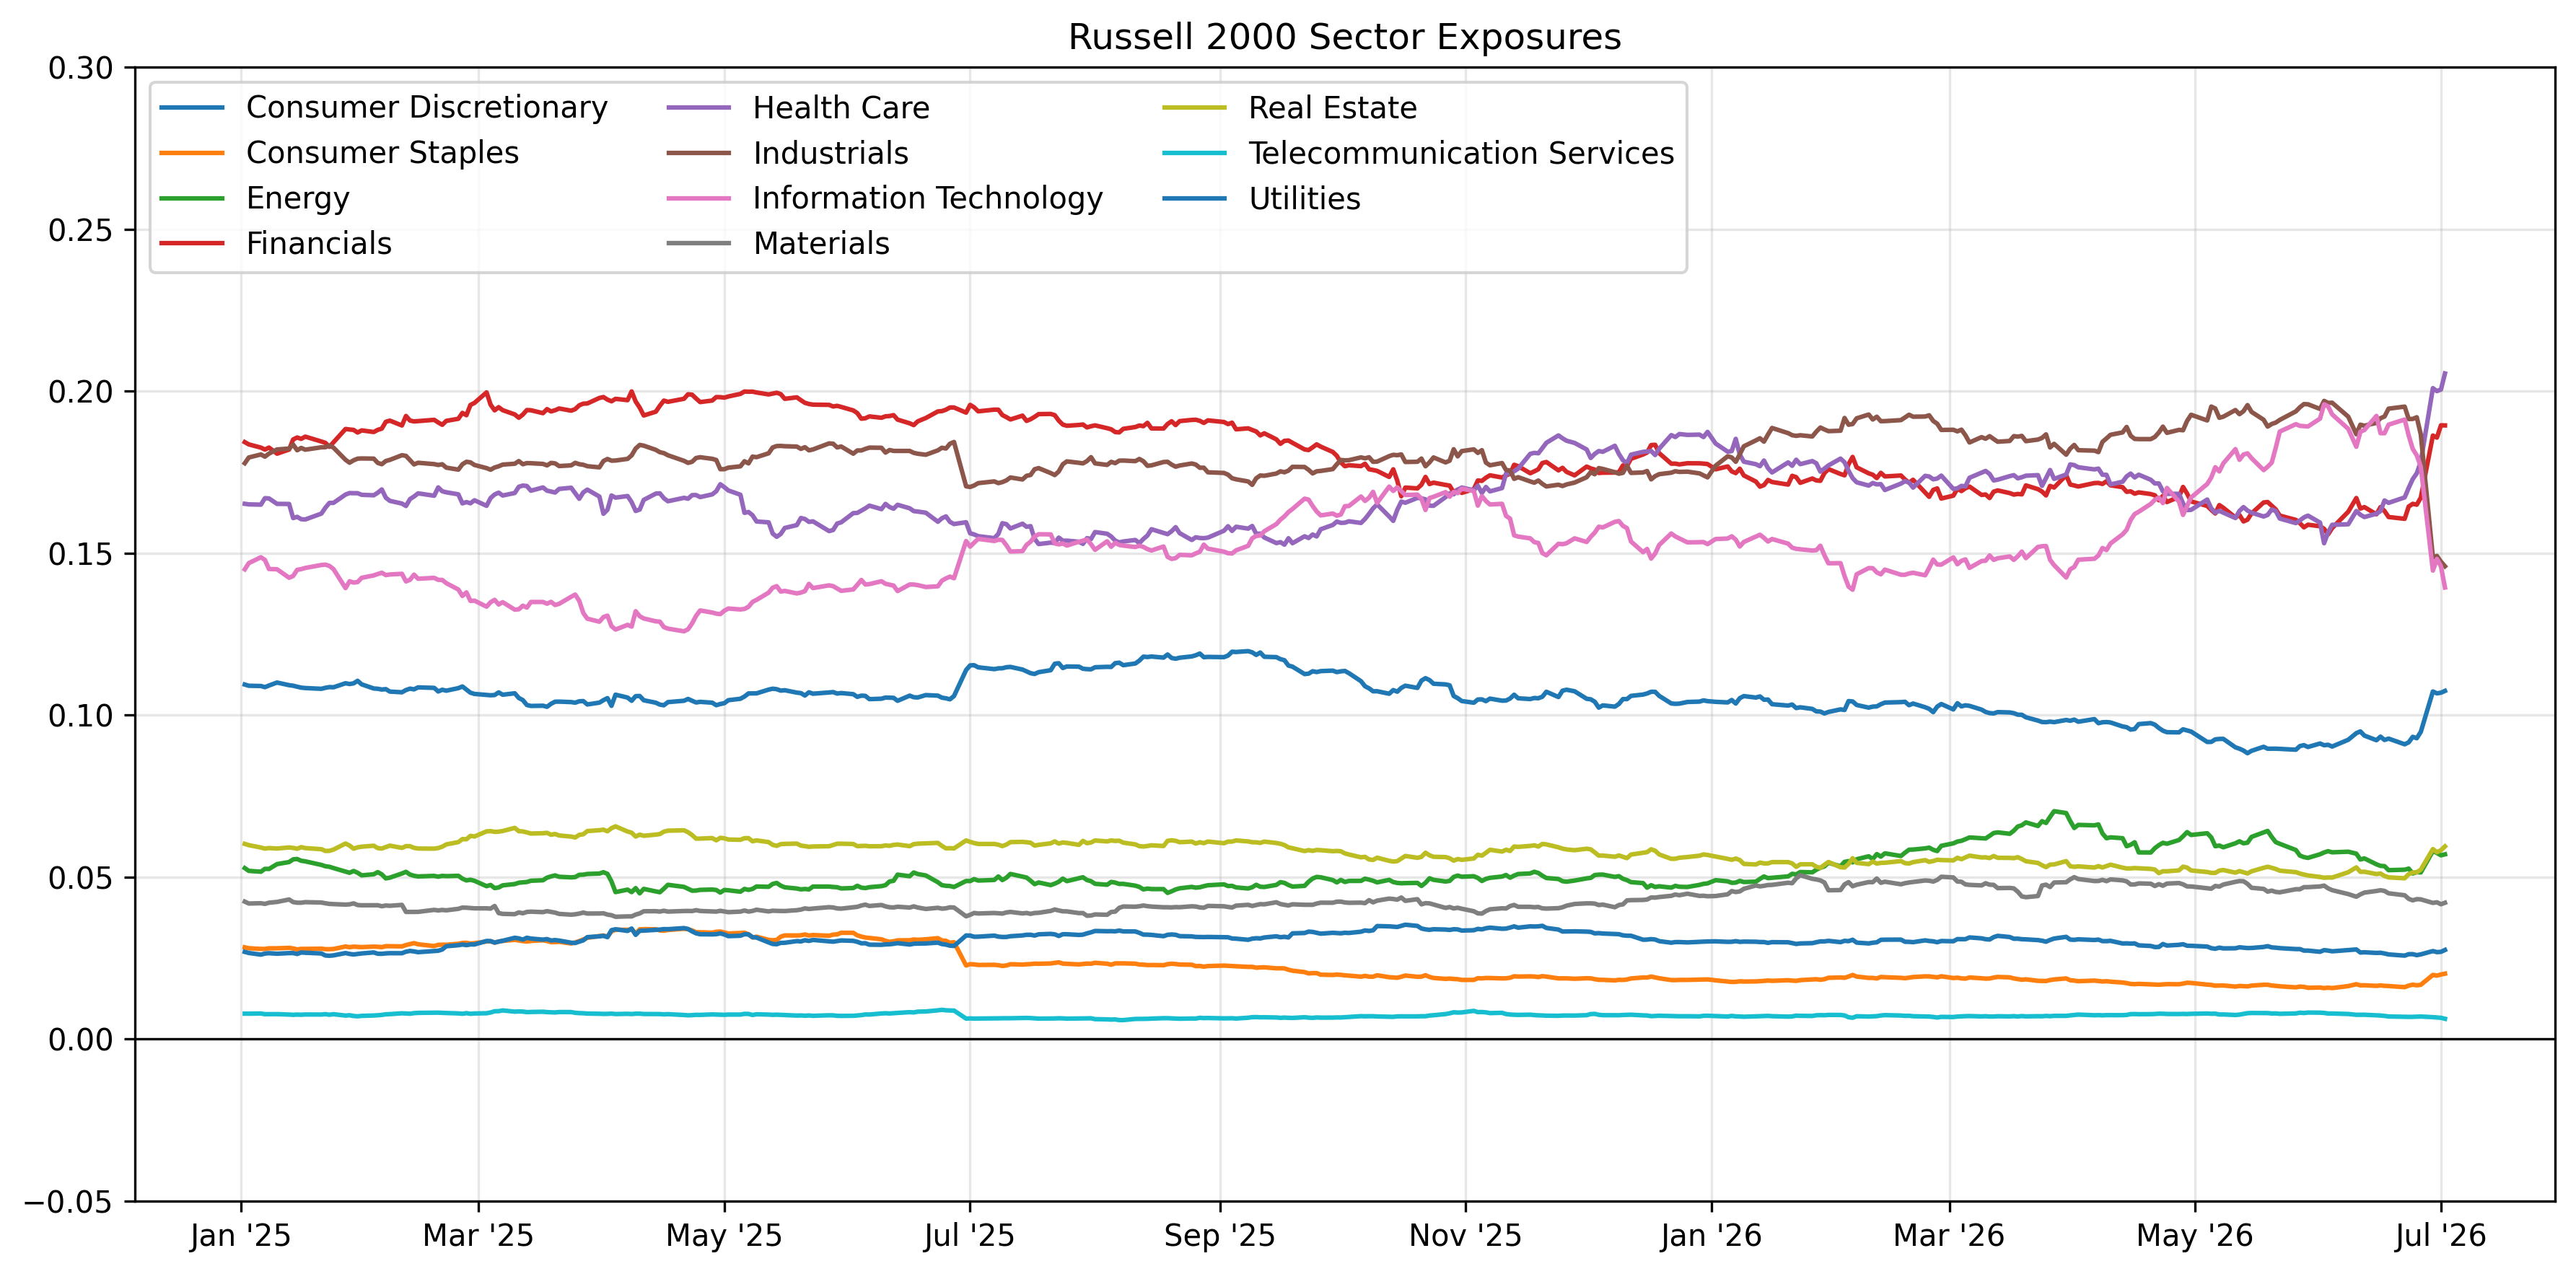
The largest move in Style factor exposures came from Medium Term Momentum, which has recently experienced elevated returns (see the next section for more on this). The sector exposures moved less dramatically (note the smaller range in the y-axis) showing reduced exposures to Information Technology and Industrials and increased exposures to Health Care and Financials.
The following chart is not included in the Equity Risk Monitors but is available on request:
The following chart is not included in the Equity Risk Monitors but is available on request:
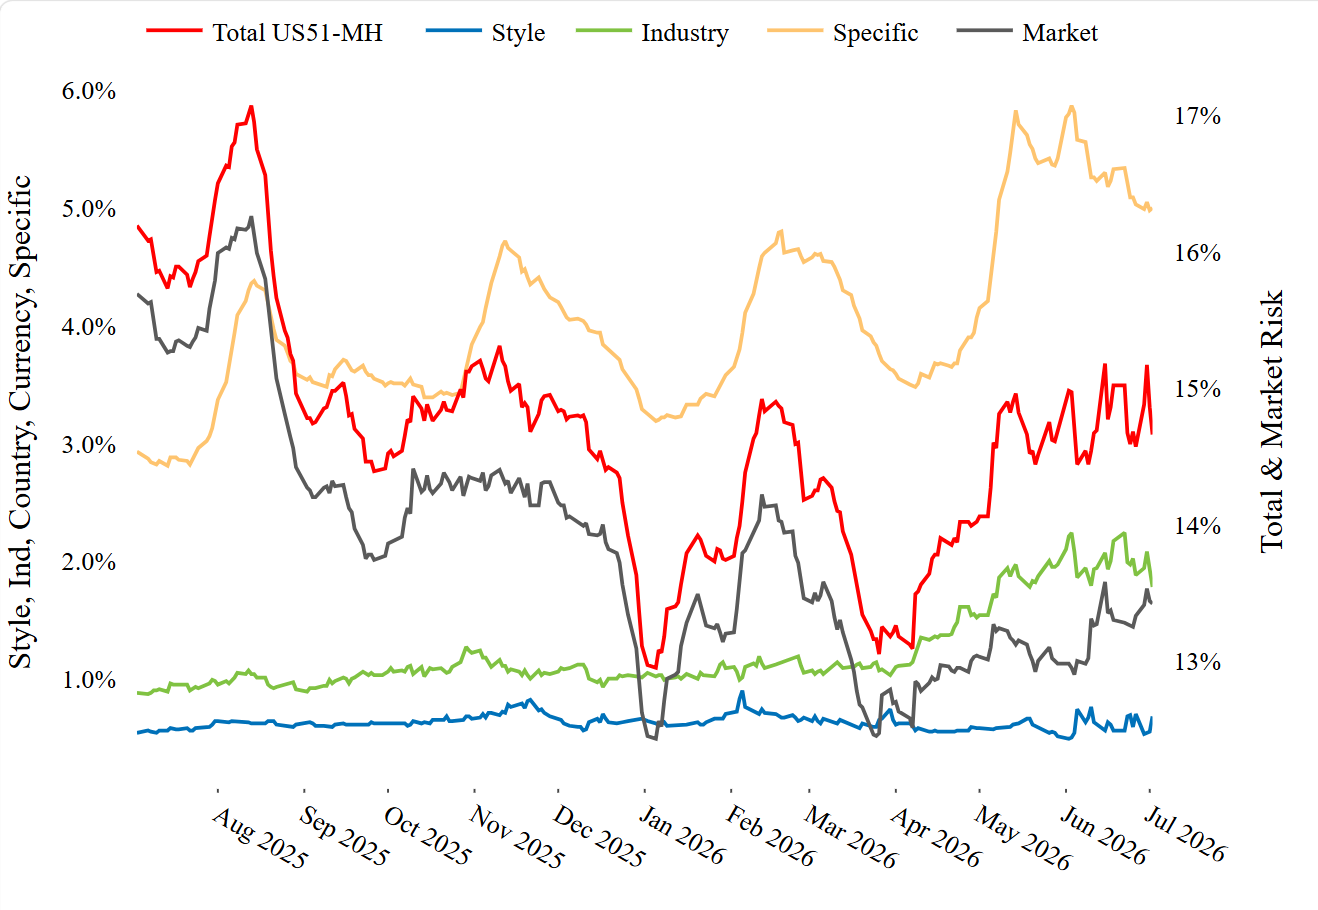
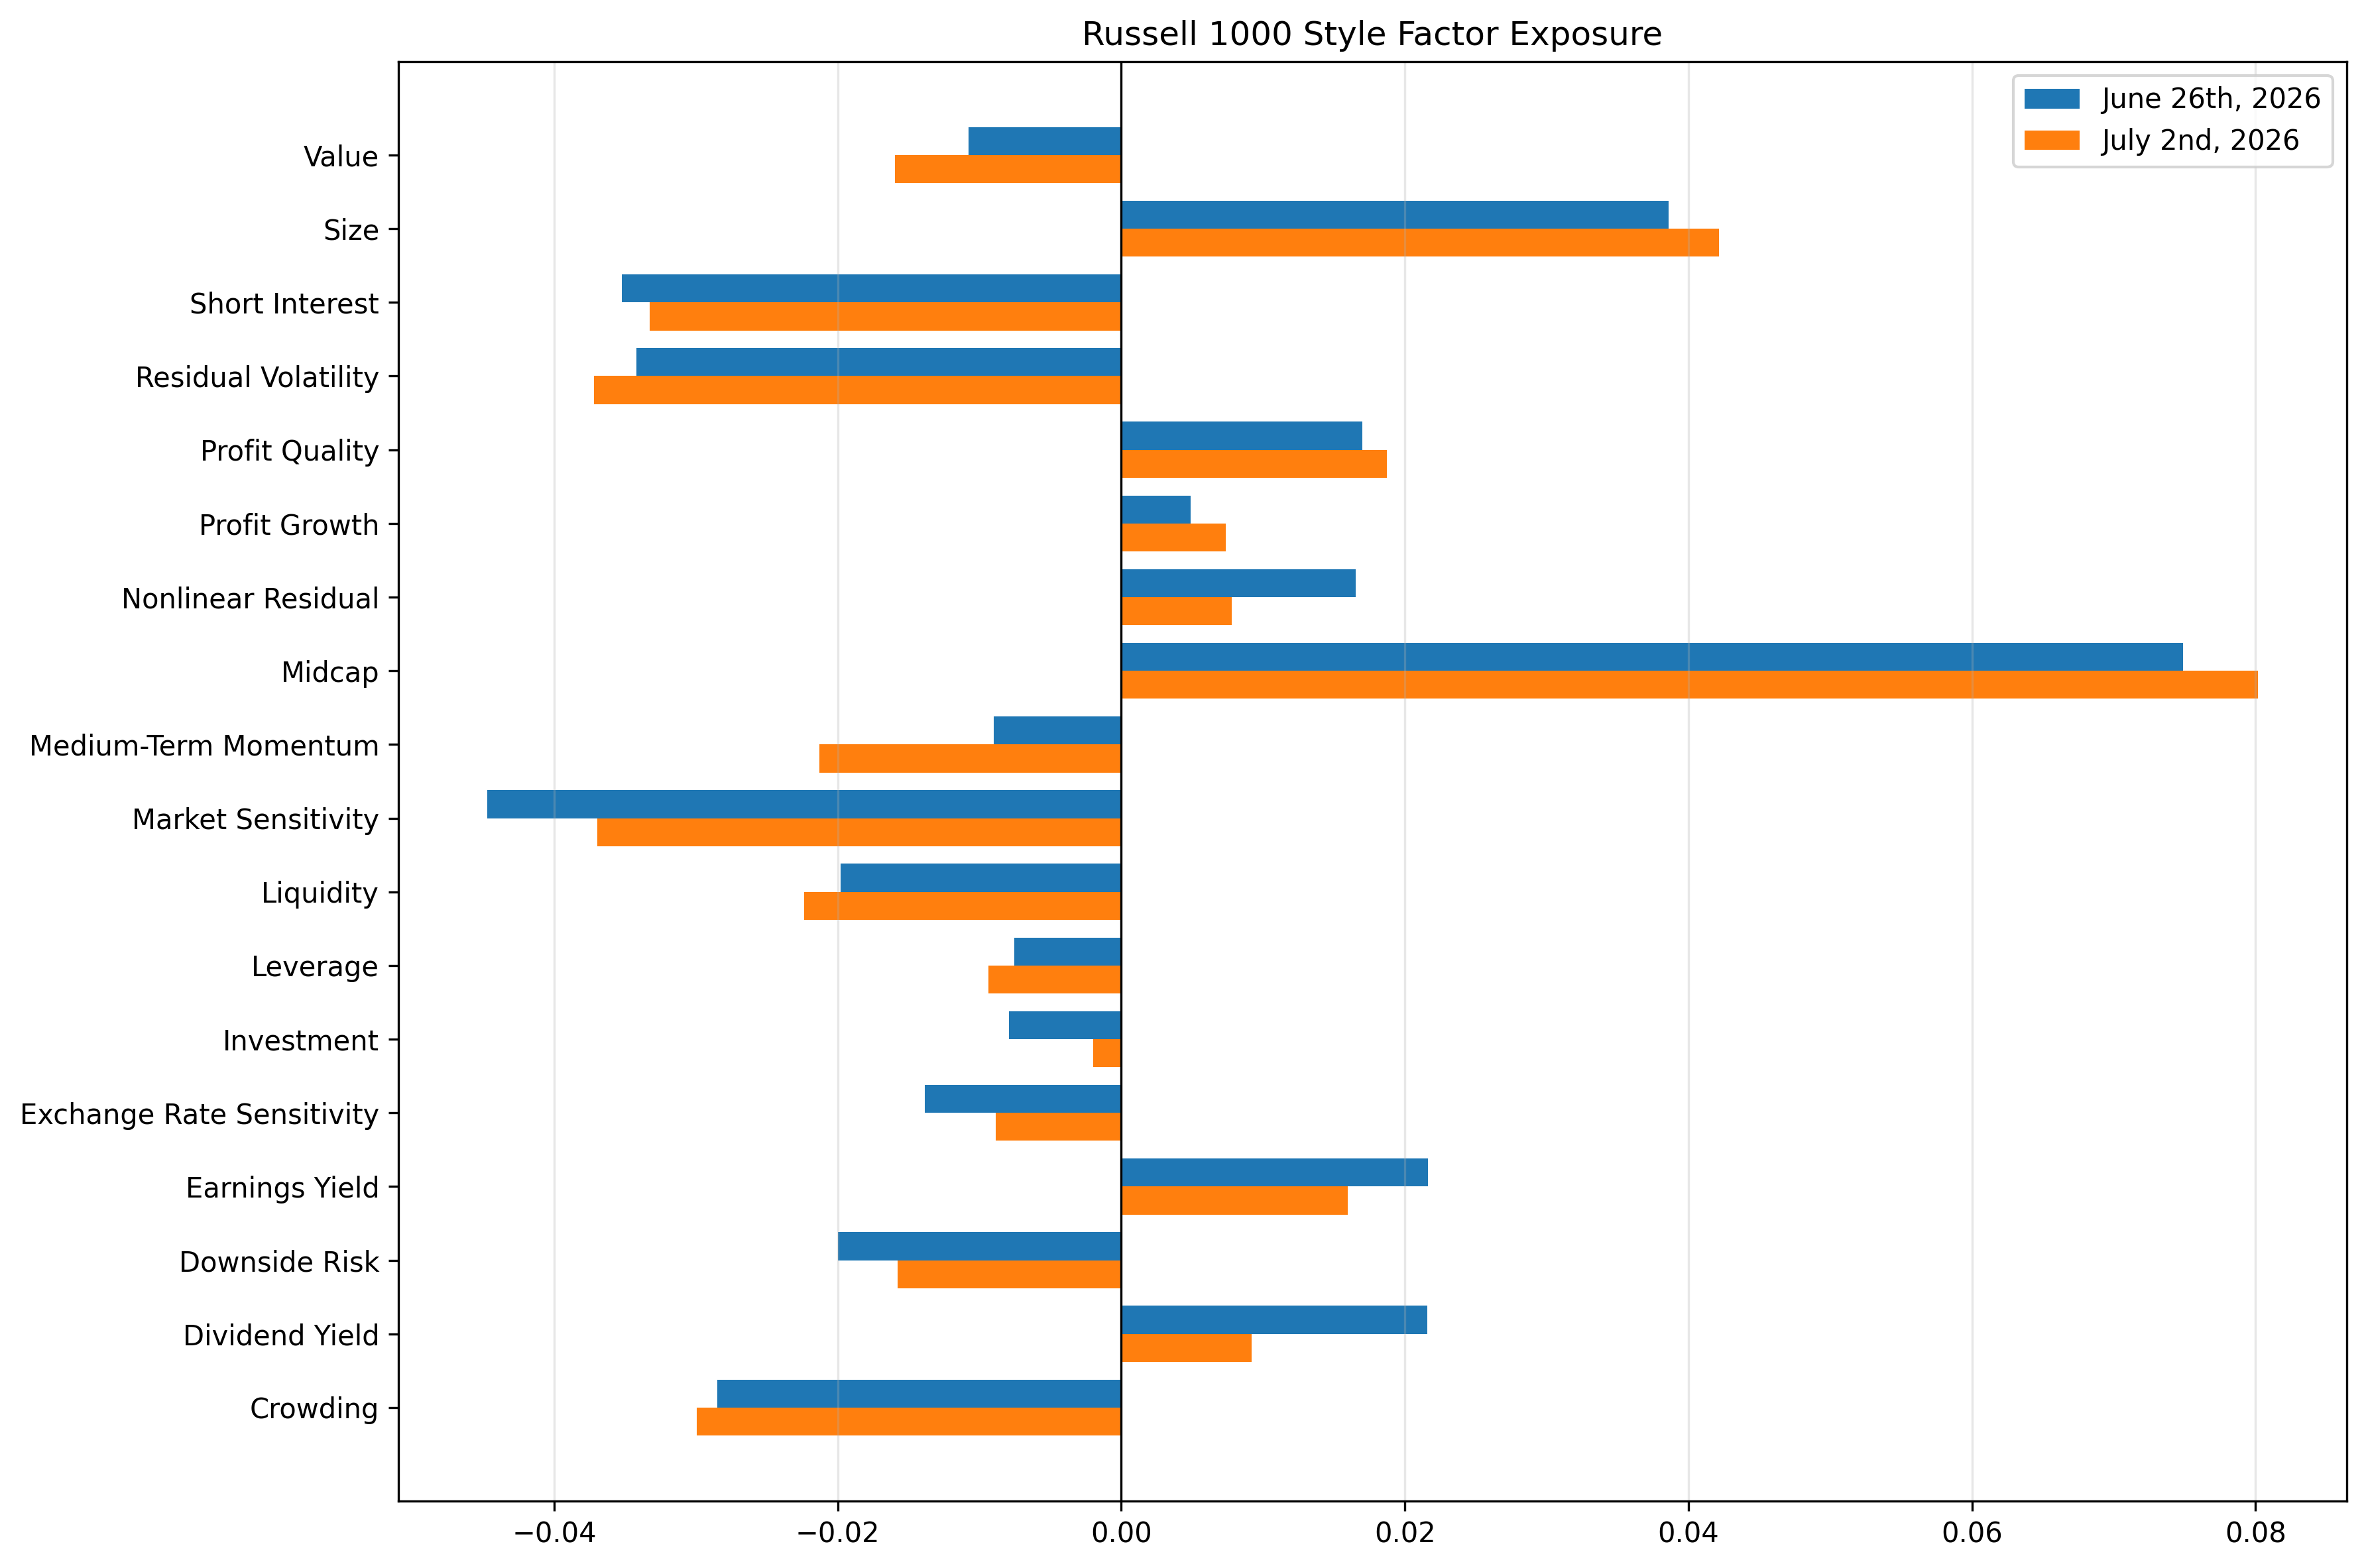
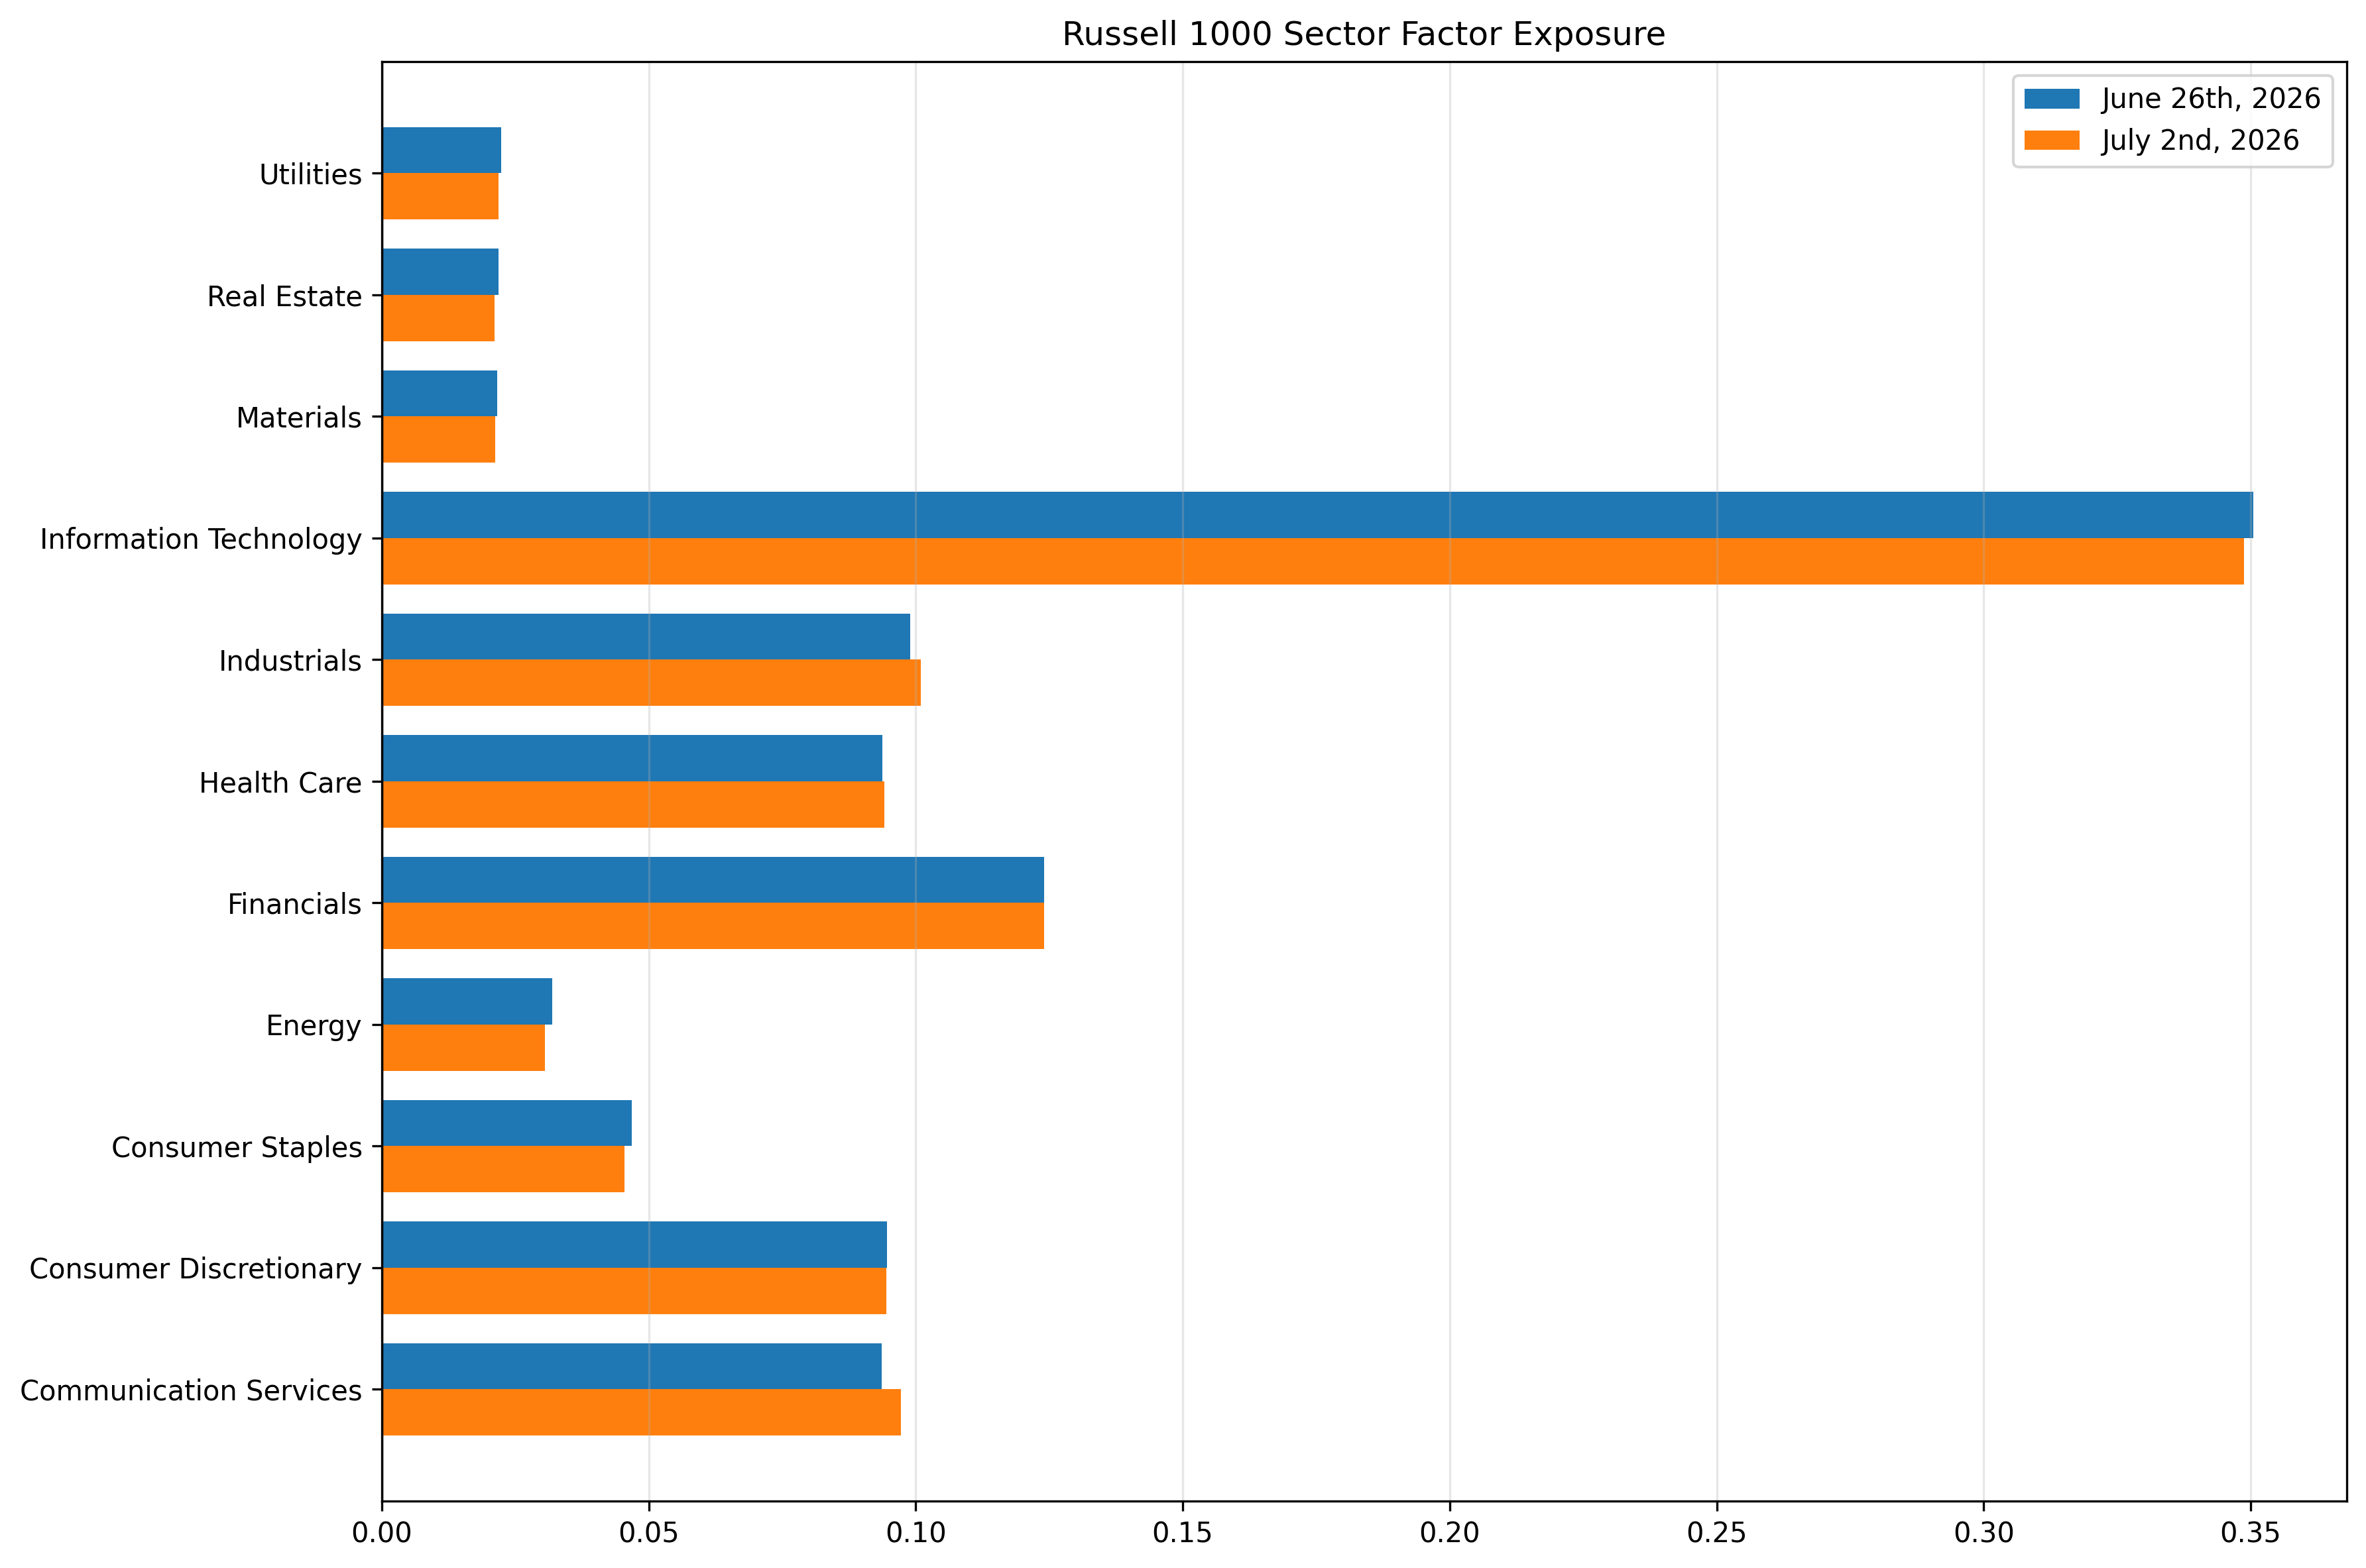
Conversely, the Russell 1000 Style and Industry risk did not move much, since the names added to the index are small relative to the large cap names and thus did not affect exposures significantly.
See chart from Russell 1000 – Axioma United States (AXUS5.1) Equity Risk Monitor as of July 3rd, 2026
Russell 1000 - Components of Risk
The following chart is not included in the Equity Risk Monitors but is available on request:
The following chart is not included in the Equity Risk Monitors but is available on request:
As Long As The Music is Playing…
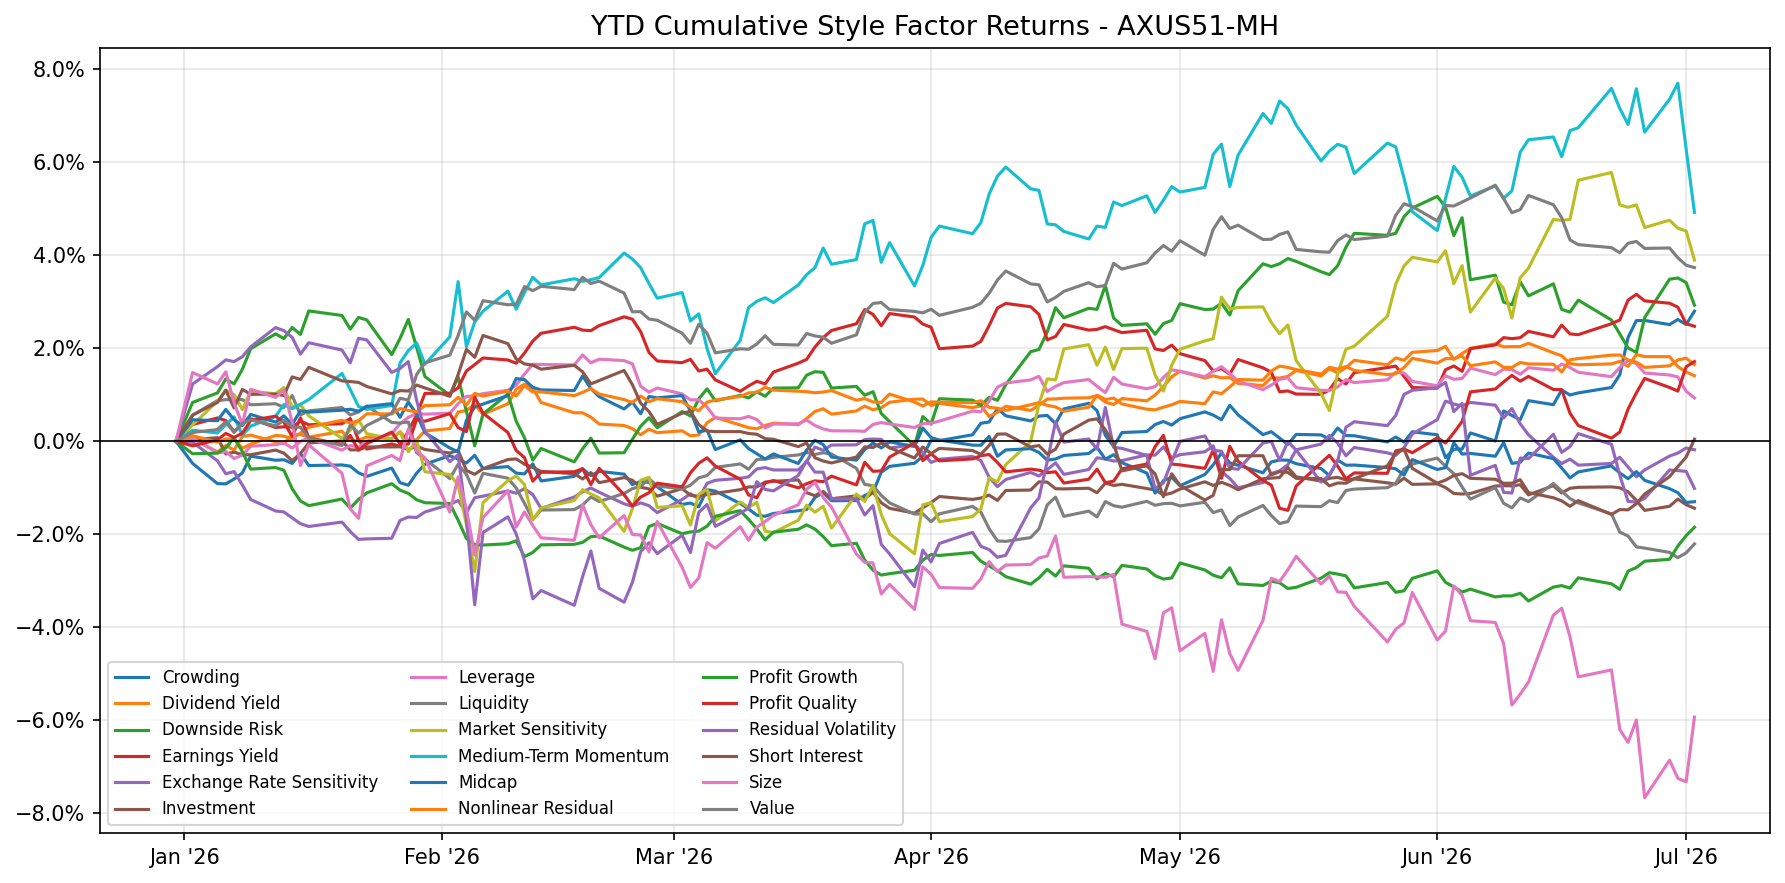
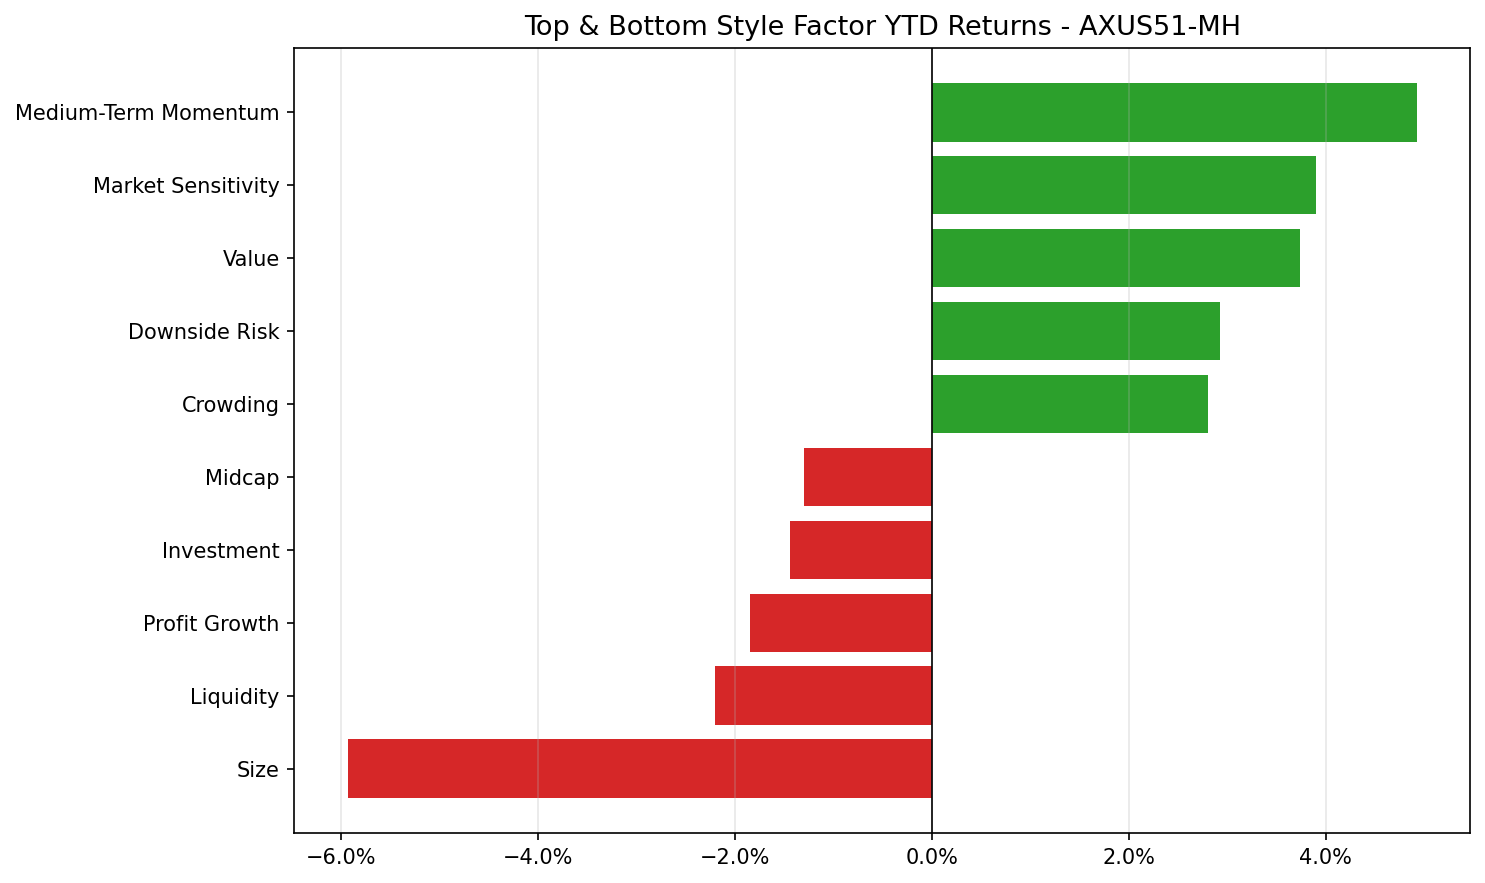
Since we’ve hit the midway point in 2026, we thought we would review the factor returns year to date. In the US, the largest positive returns came from Medium-Term Momentum, Market Sensitivity, and Value, and the most negative return came from Size by a significant margin.
The following chart is not included in the Equity Risk Monitors but is available on request:
The following chart is not included in the Equity Risk Monitors but is available on request:
In our World Wide model, we see similarly strong positive returns for Medium Term Momentum and Market Sensitivity.
The following chart is not included in the Equity Risk Monitors but is available on request:
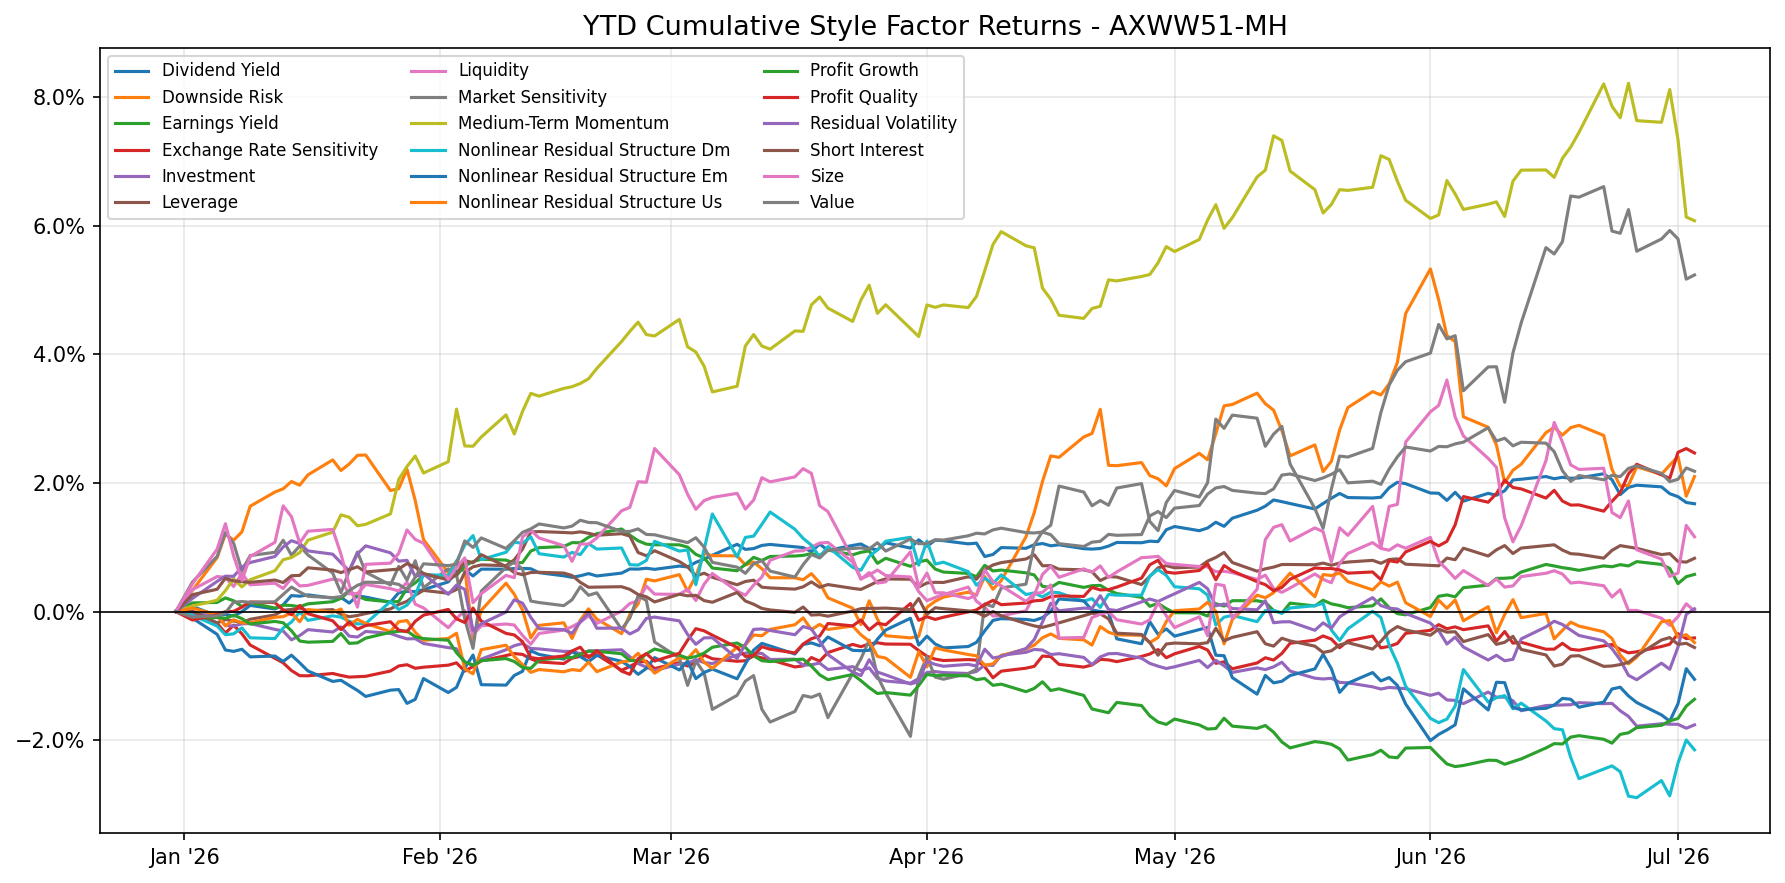
The following chart is not included in the Equity Risk Monitors but is available on request:
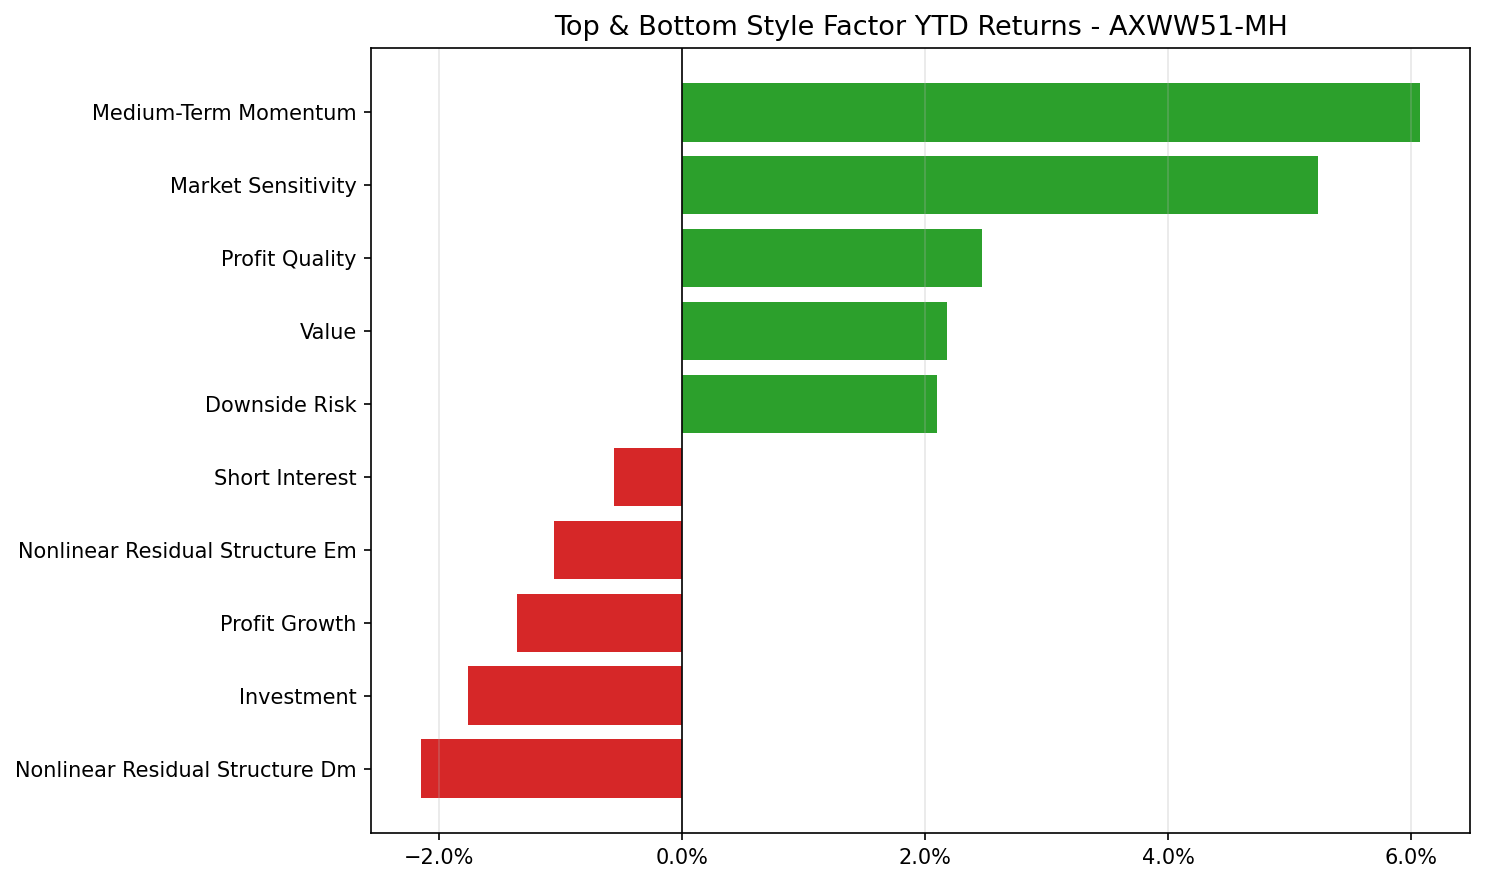
However, we have to remember that the World Wide model includes the US returns. In order to get a sense for the non-US factor returns, we need to look at the region specific models for United States, Developed Markets ex. US, and Emerging Markets. We will be using the v4 models here since not all the regions have been upgraded for v5 yet.
The following chart is not included in the Equity Risk Monitors but is available on request:
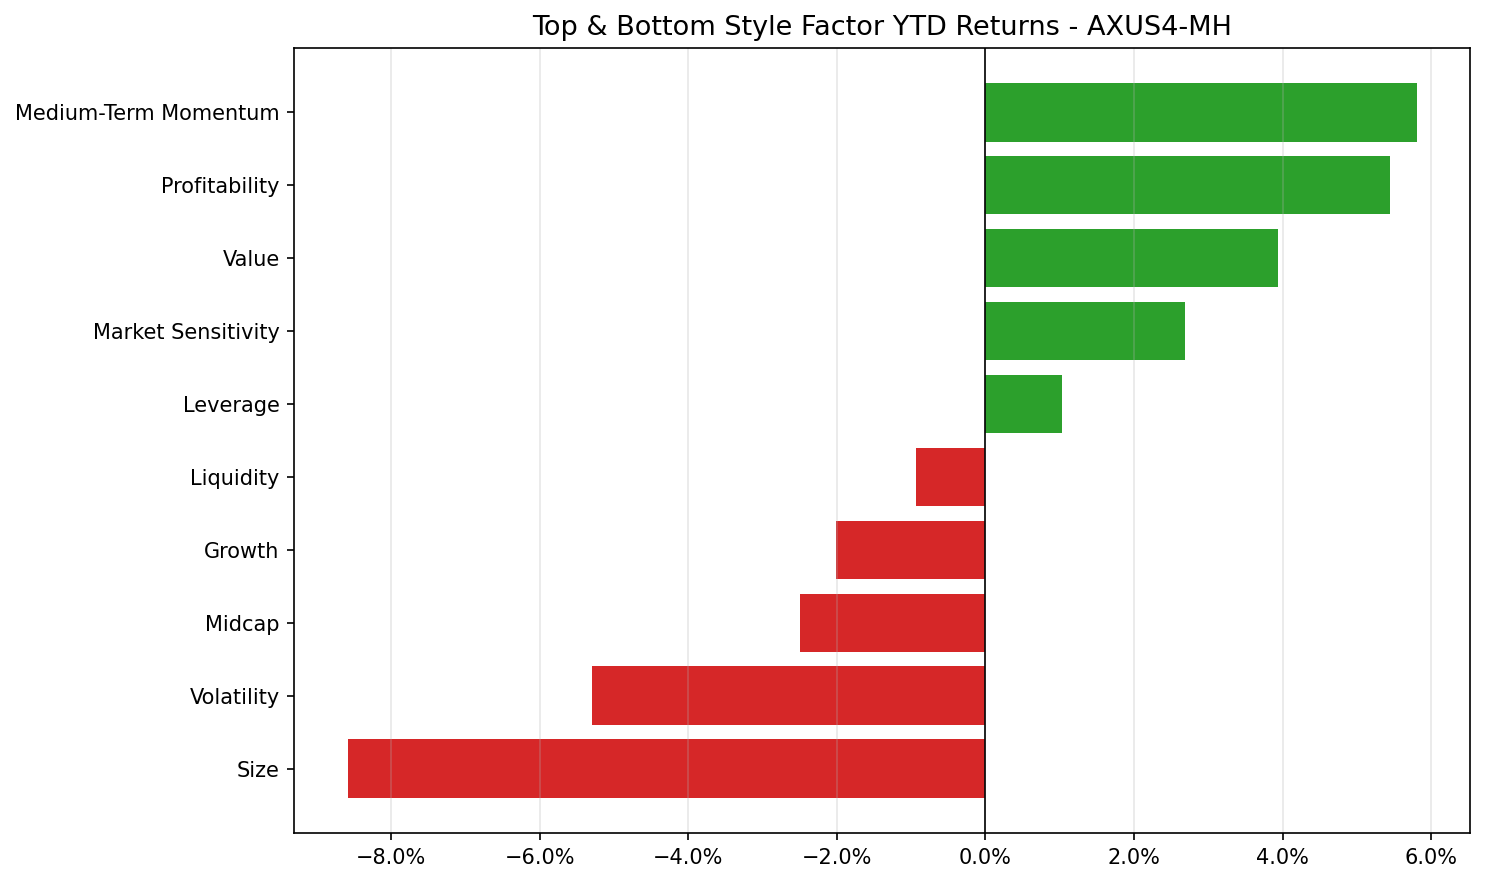
The following chart is not included in the Equity Risk Monitors but is available on request:
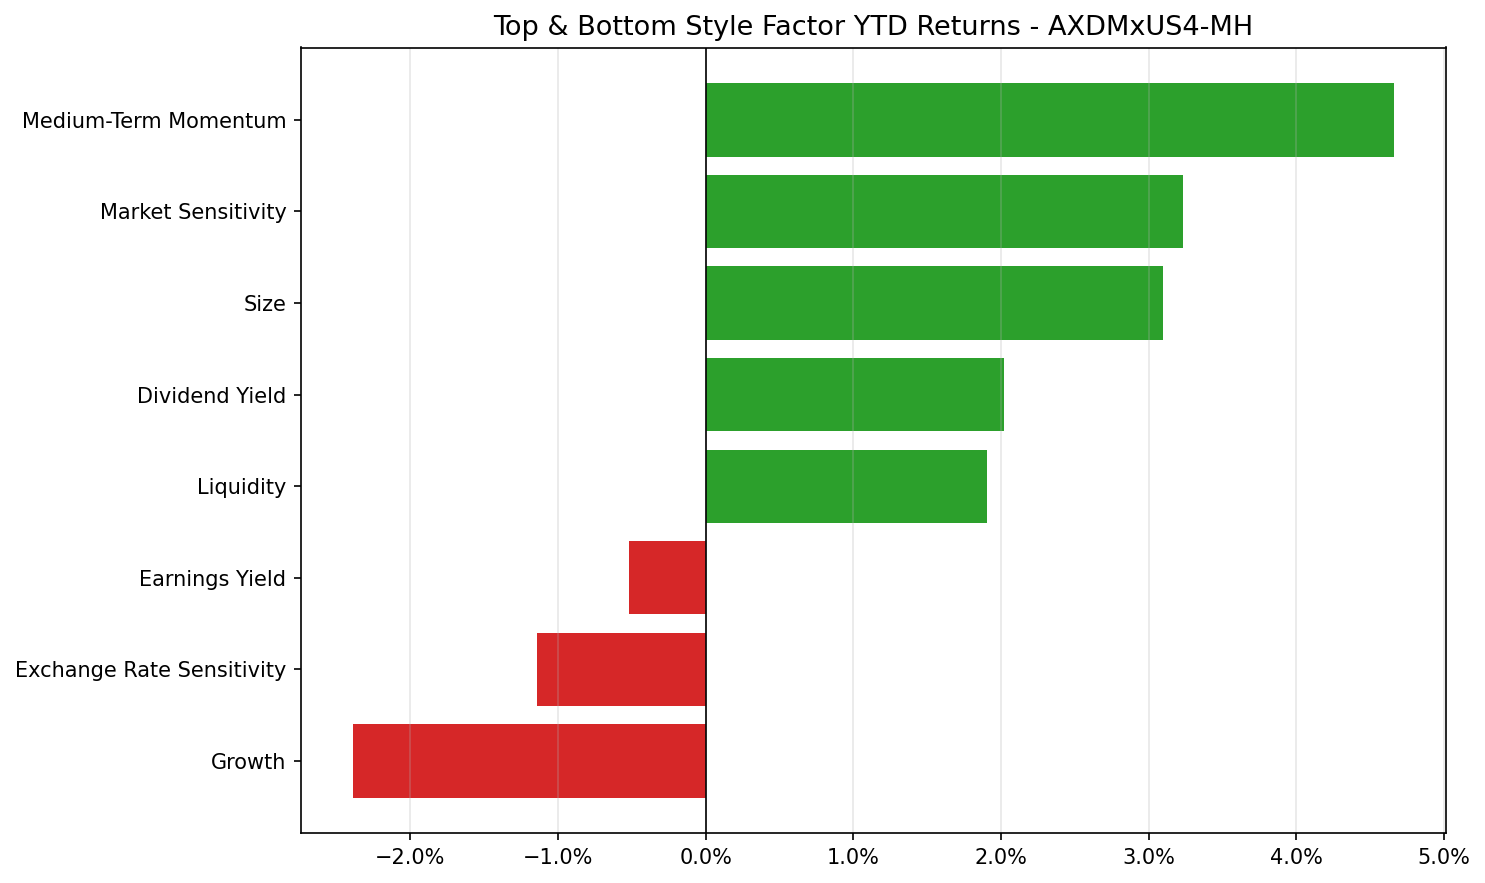
The following chart is not included in the Equity Risk Monitors but is available on request:
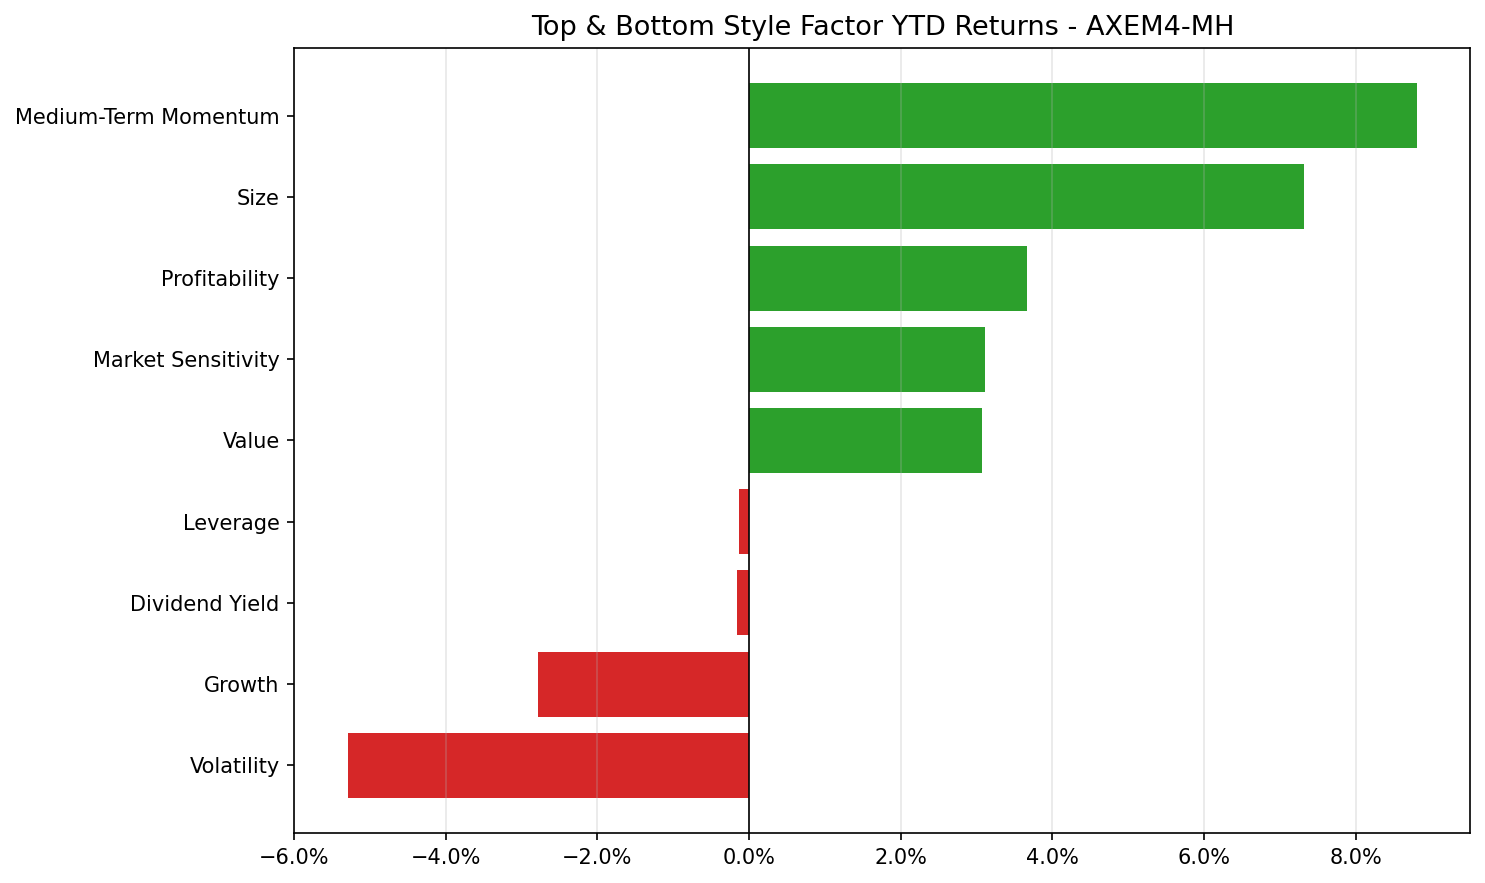
We see some consistency across regions, but the most striking result here is that Medium Term Momentum is the top performer across all three models. In fact, if we look over a much longer period, we see that the most recent 6 months has experienced the best Medium Term Momentum performance since the Dot-Com Bubble for both the US and Emerging Markets models. The Developed Markets ex US has not lagged behind too much however with its best performance since late 2013.
The following chart is not included in the Equity Risk Monitors but is available on request:
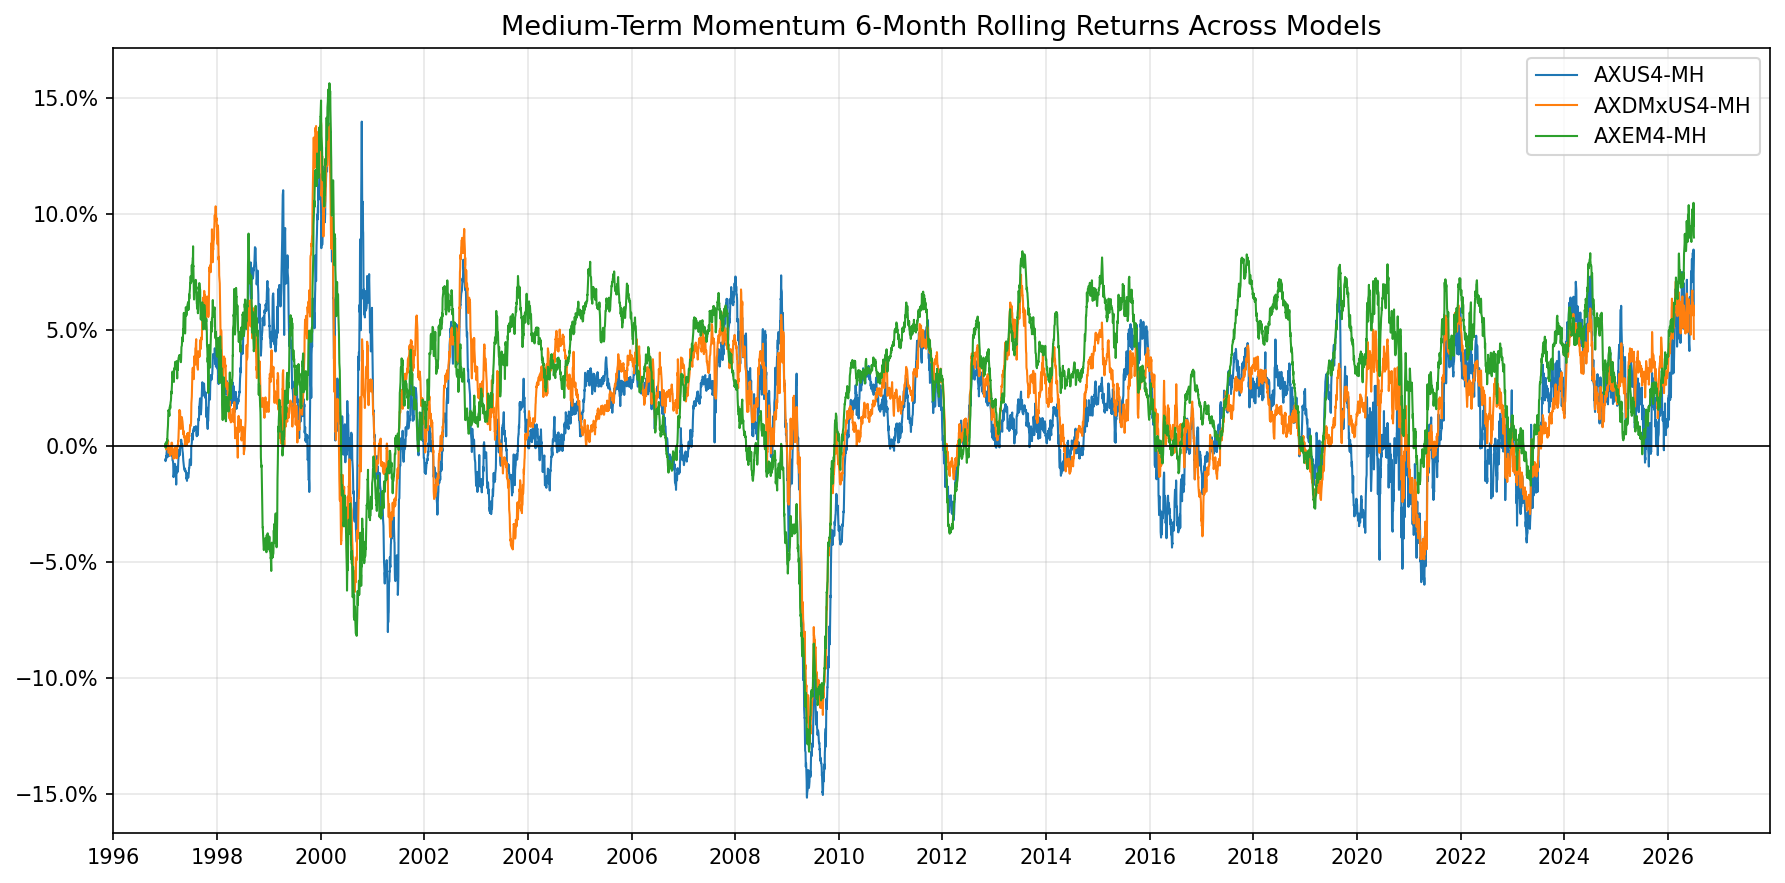
We have recently written on how the Medium Term Momentum factor returns could help identify a market peak here. Still, as long as the music is playing…
…You’ve Got to Get Up and Dance
About a month ago, we wrote about forming and analyzing an AI theme portfolio (link here). One of our main findings is that the AI theme is spread across disparate industries, and as a result, the risk is difficult to capture in a fundamental risk model (though we did find that the statistical model picks it up).
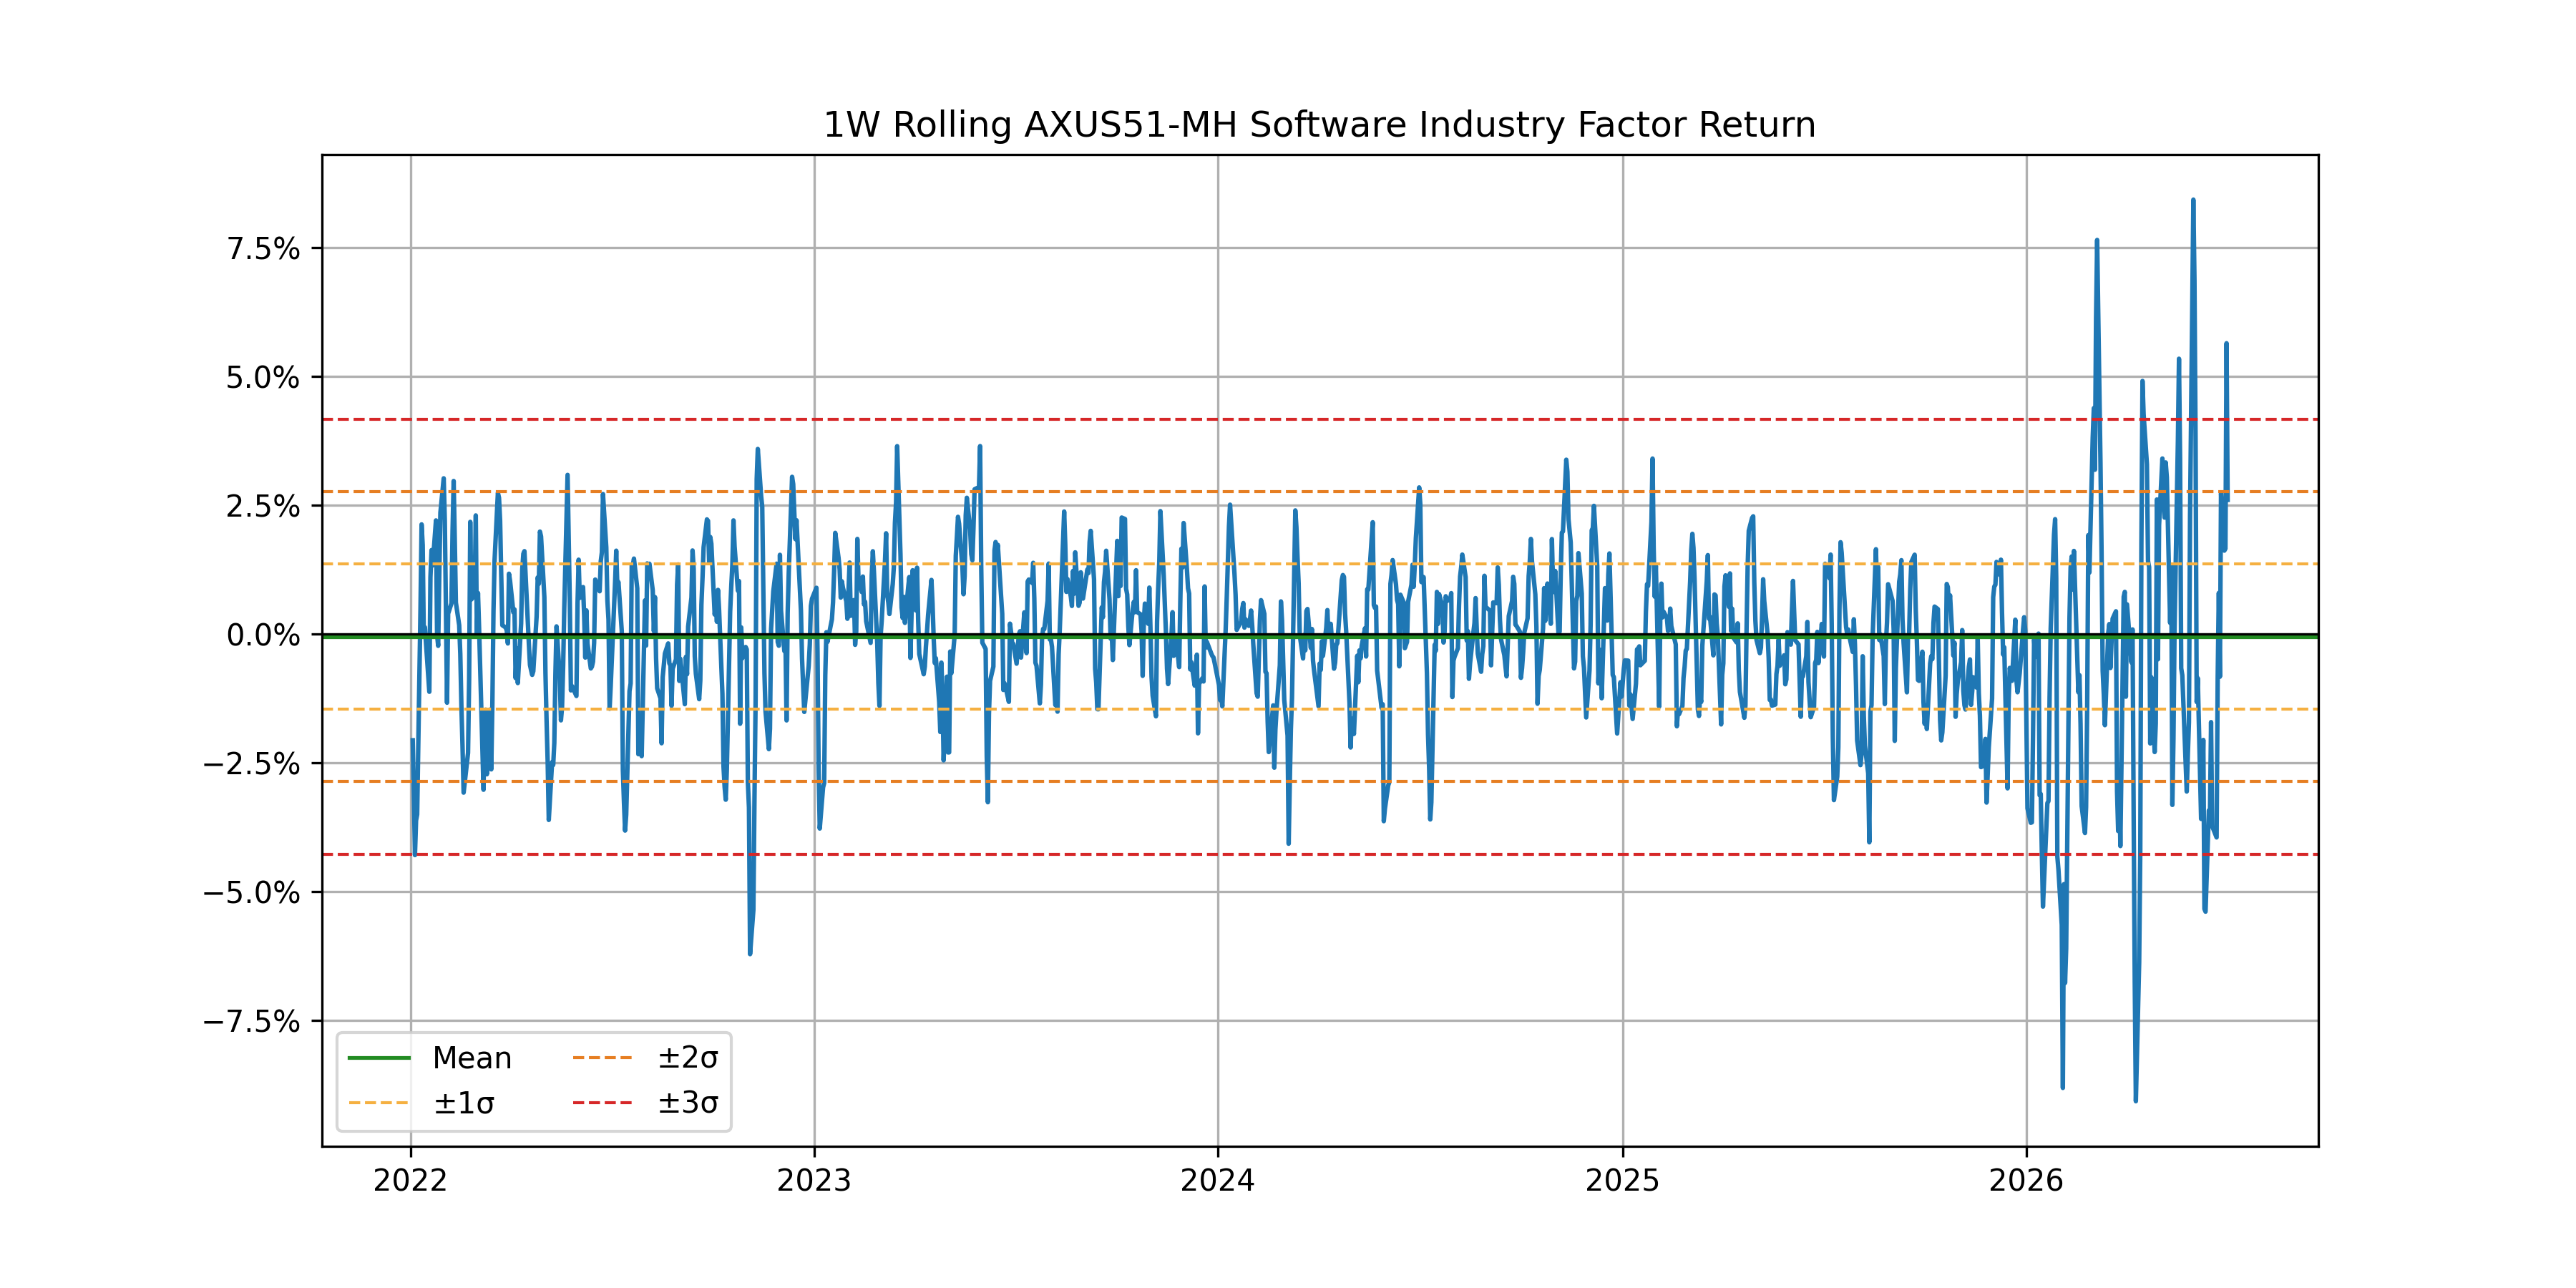
Nonetheless, the market seems to agree that the names most negatively affected from the emergence of AI are concentrated in the Software industry. This is seen by looking at the Software industry factor return:
The following chart is not included in the Equity Risk Monitors but is available on request:
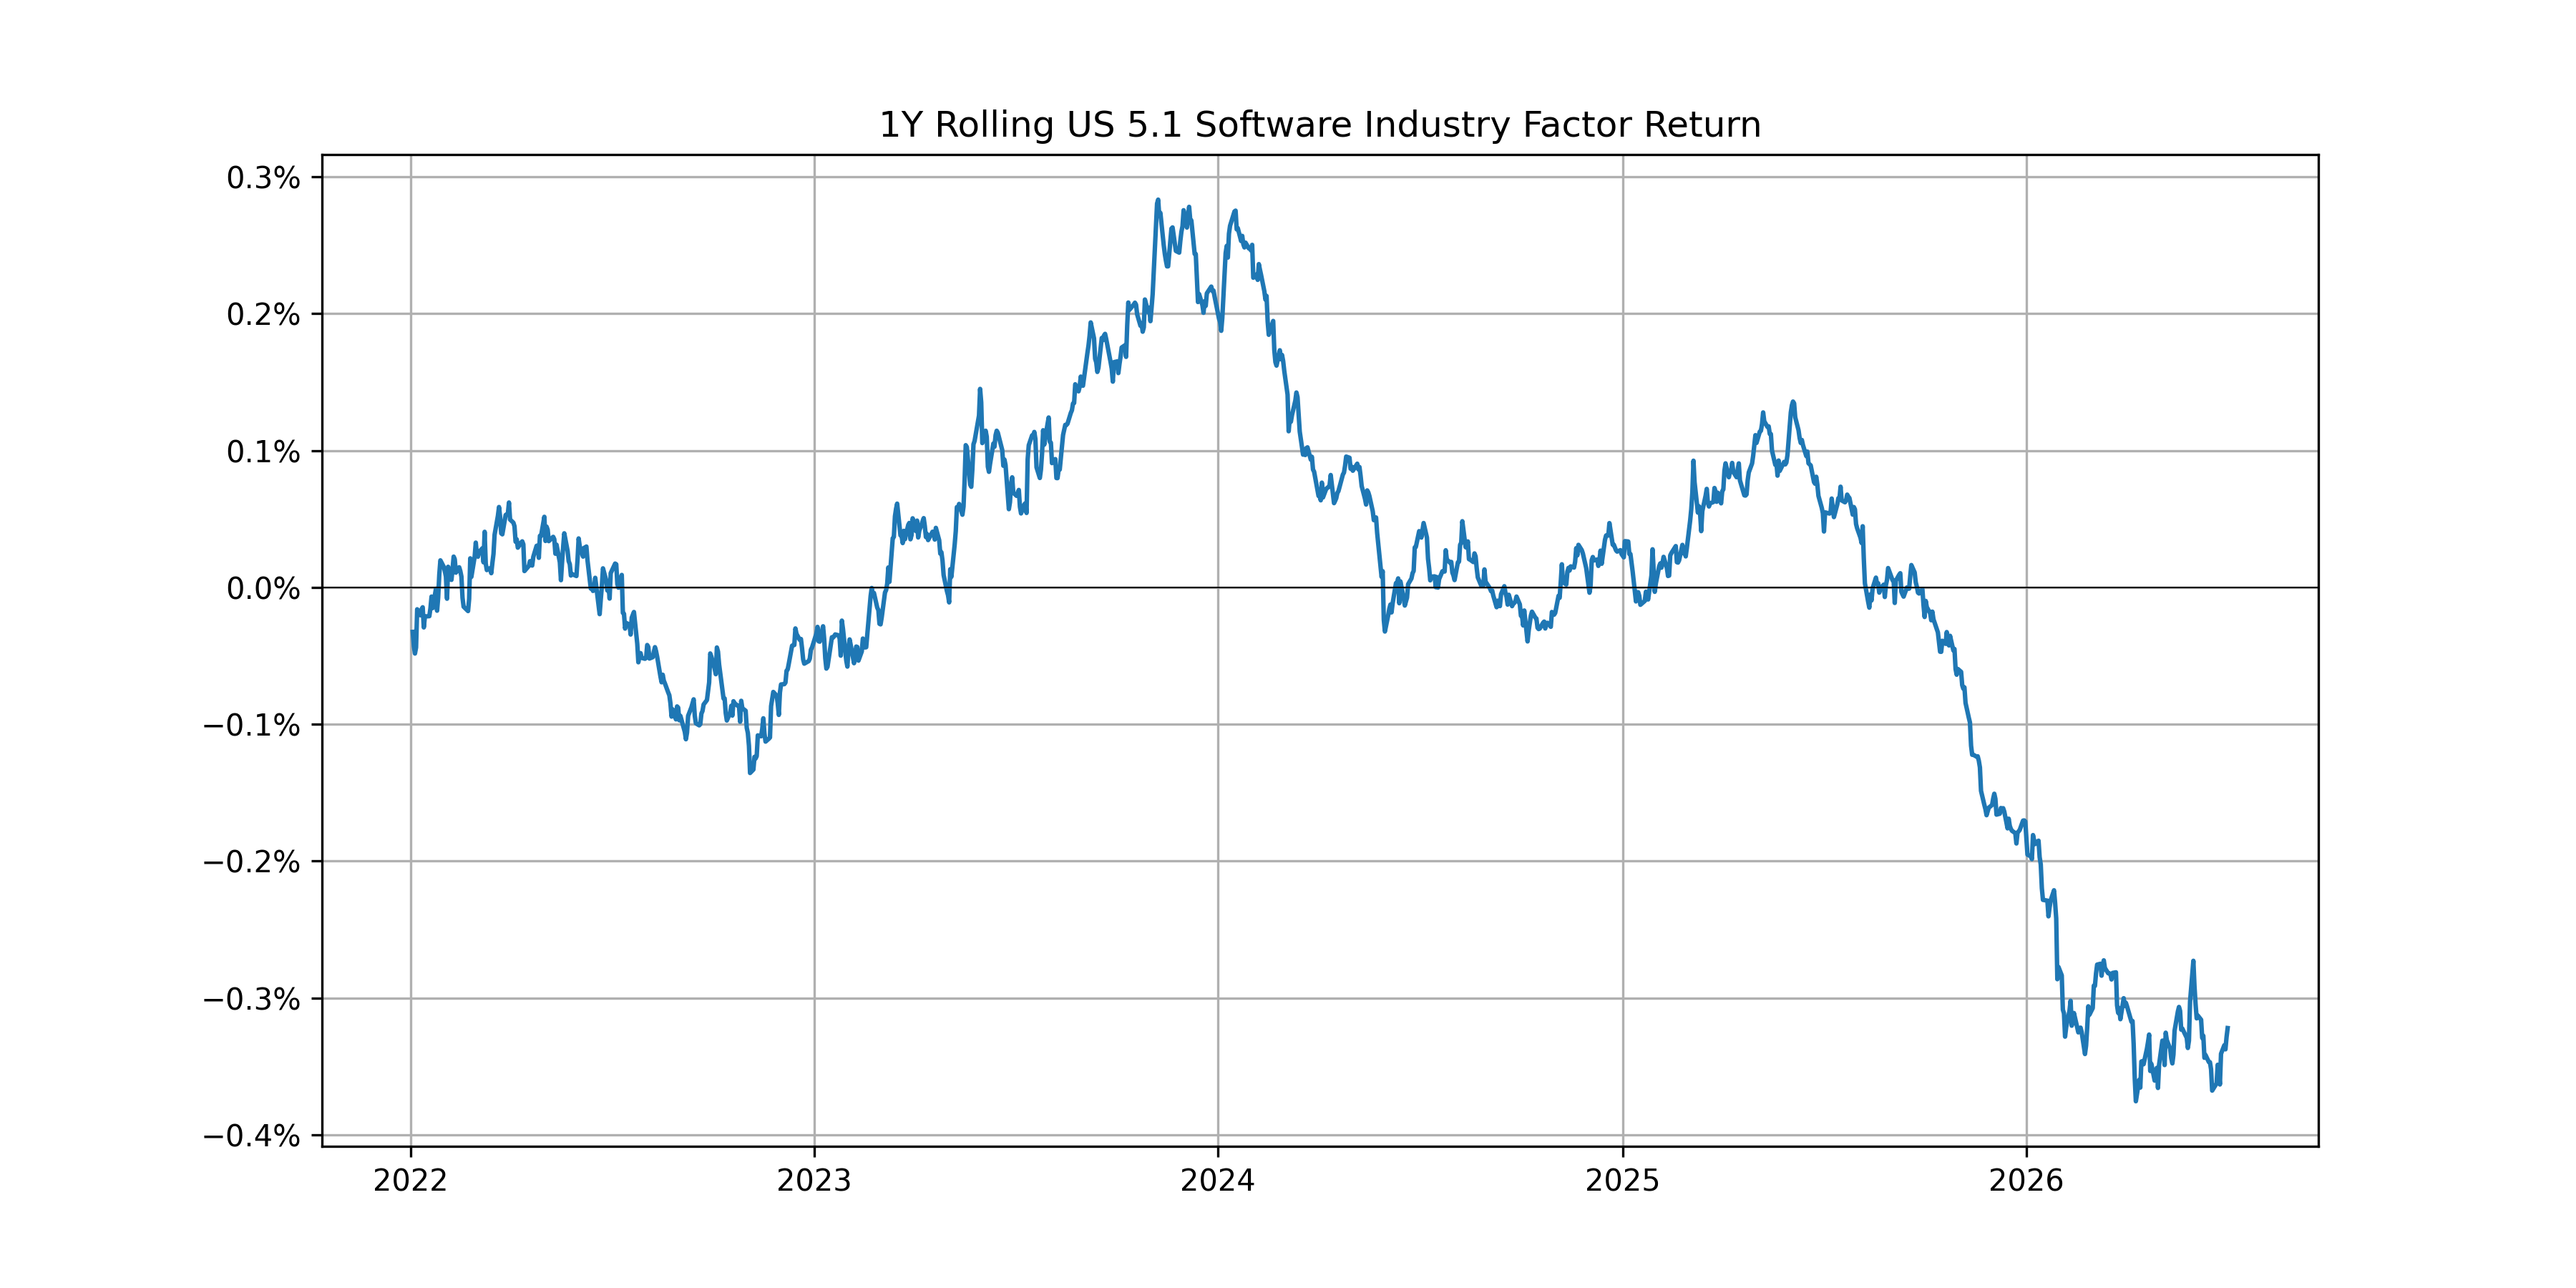
While not quite a mirror image of our AI Theme portfolio return, the 1 year rolling correlation between the AI Theme portfolio and the Software factors returns drifted more negative this year. If we compare this negative correlation to all pairs of industry factor correlations in the AXUS5.1 model, the current level would be at about the 13th percentile. This significant negative correlation suggests that a negative exposure to the Software industry factor contains a positive exposure to the AI Theme.
The following chart is not included in the Equity Risk Monitors but is available on request:
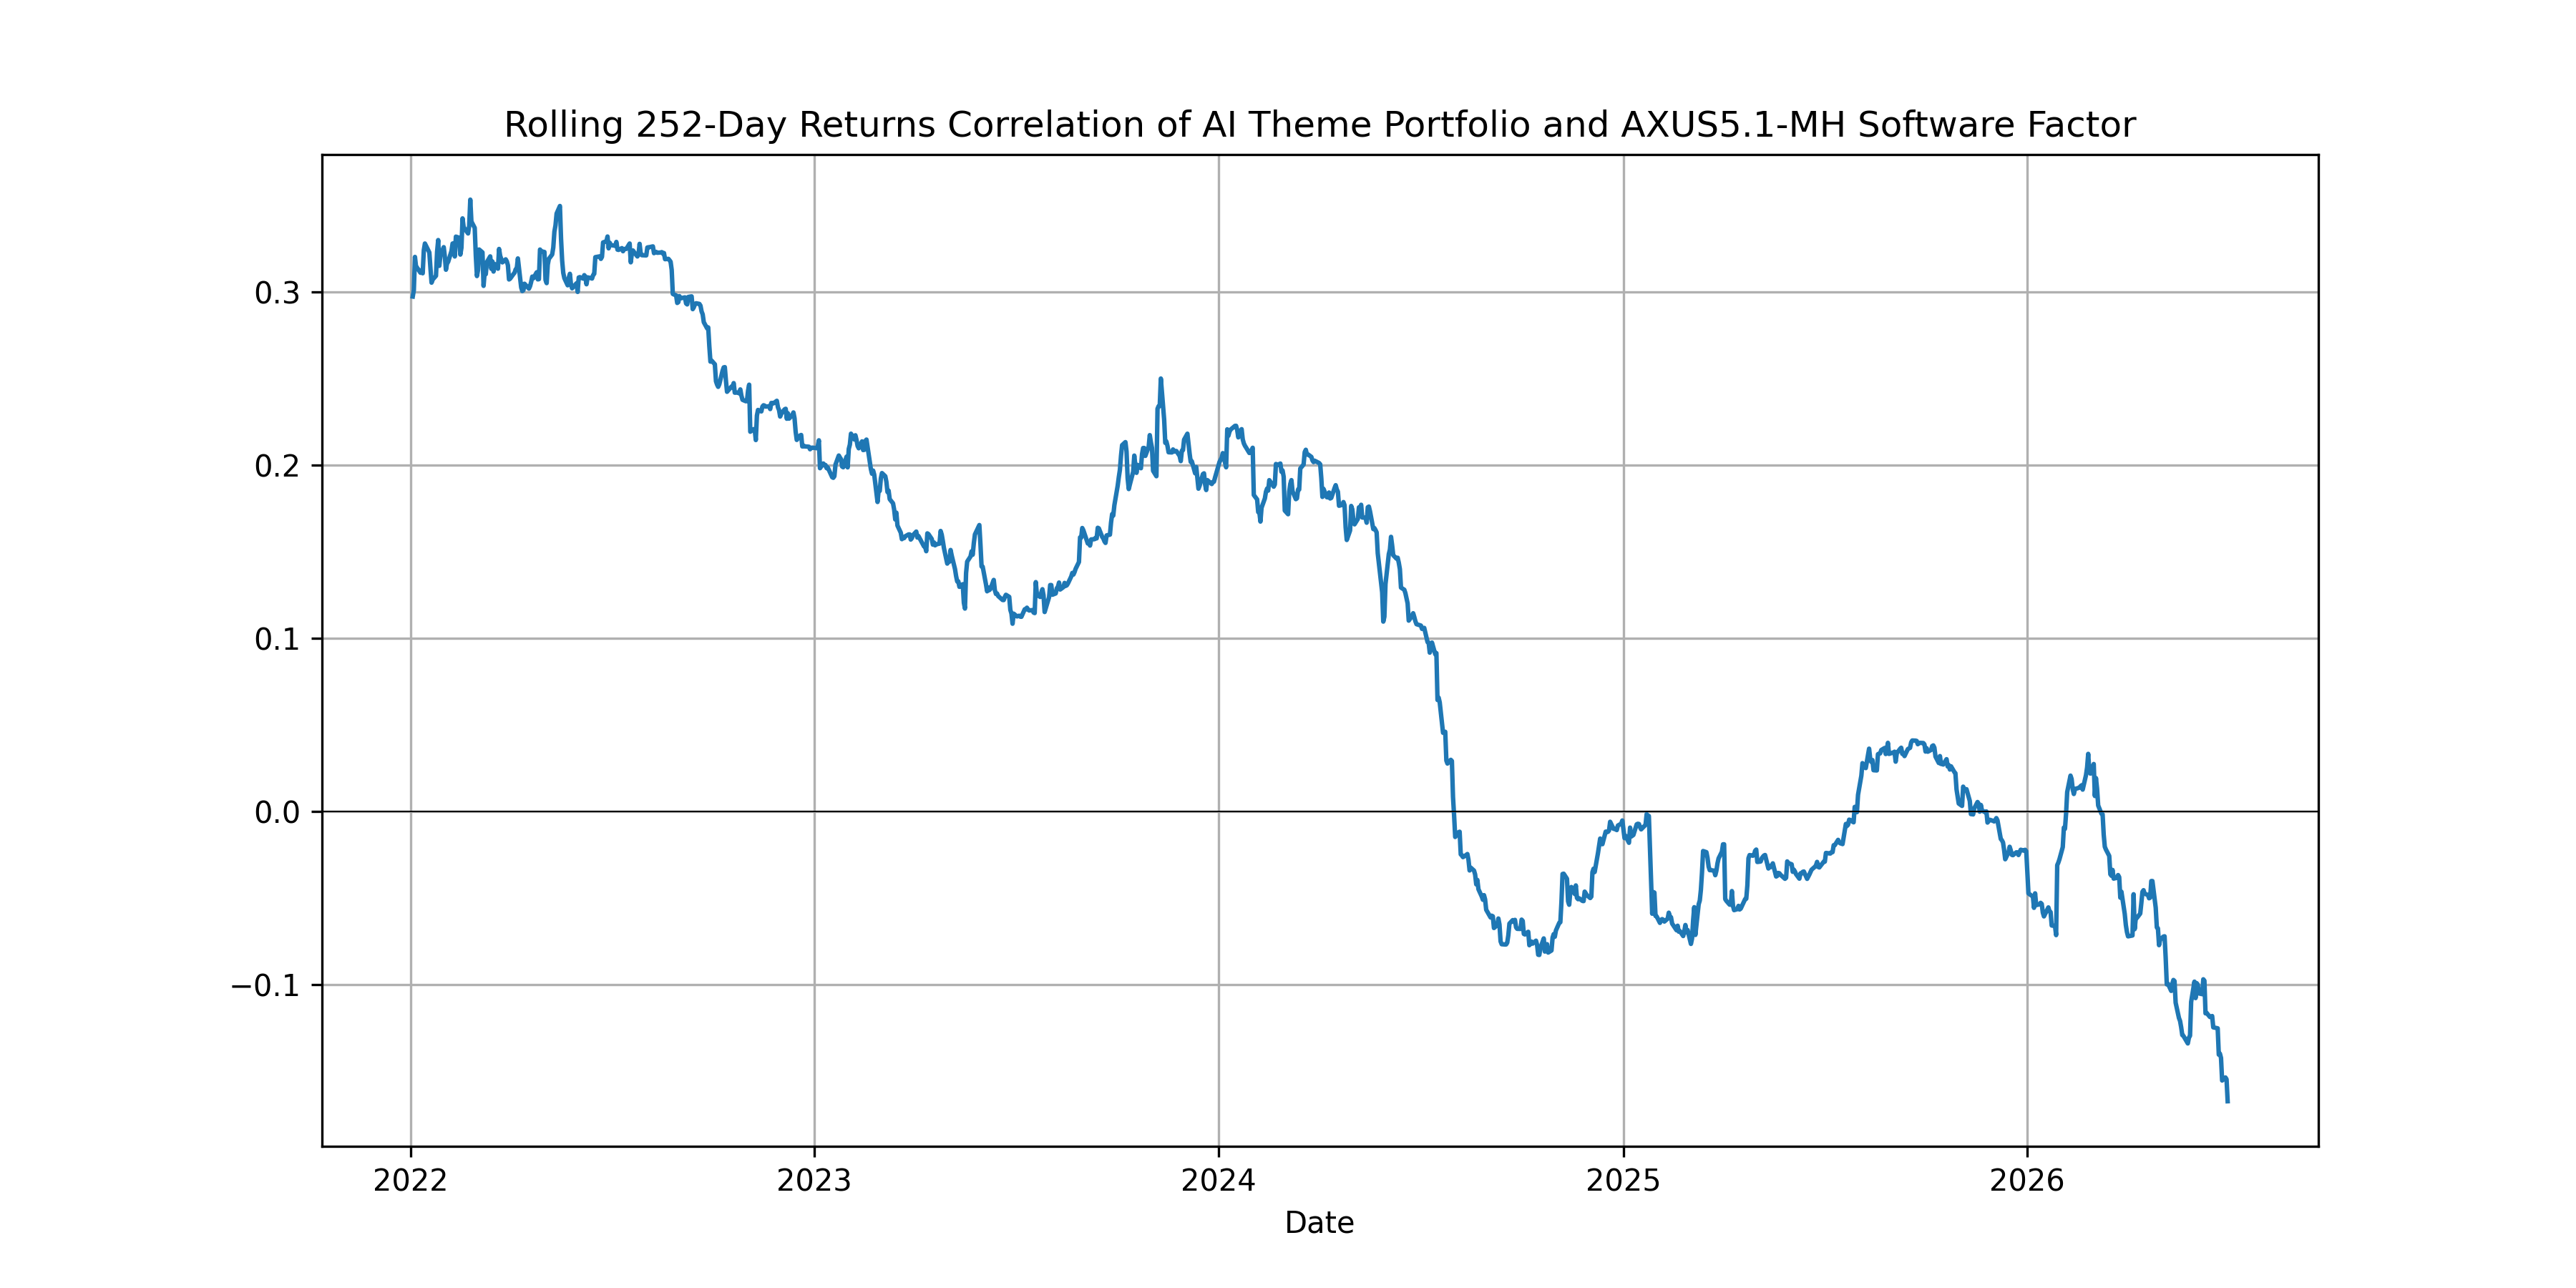
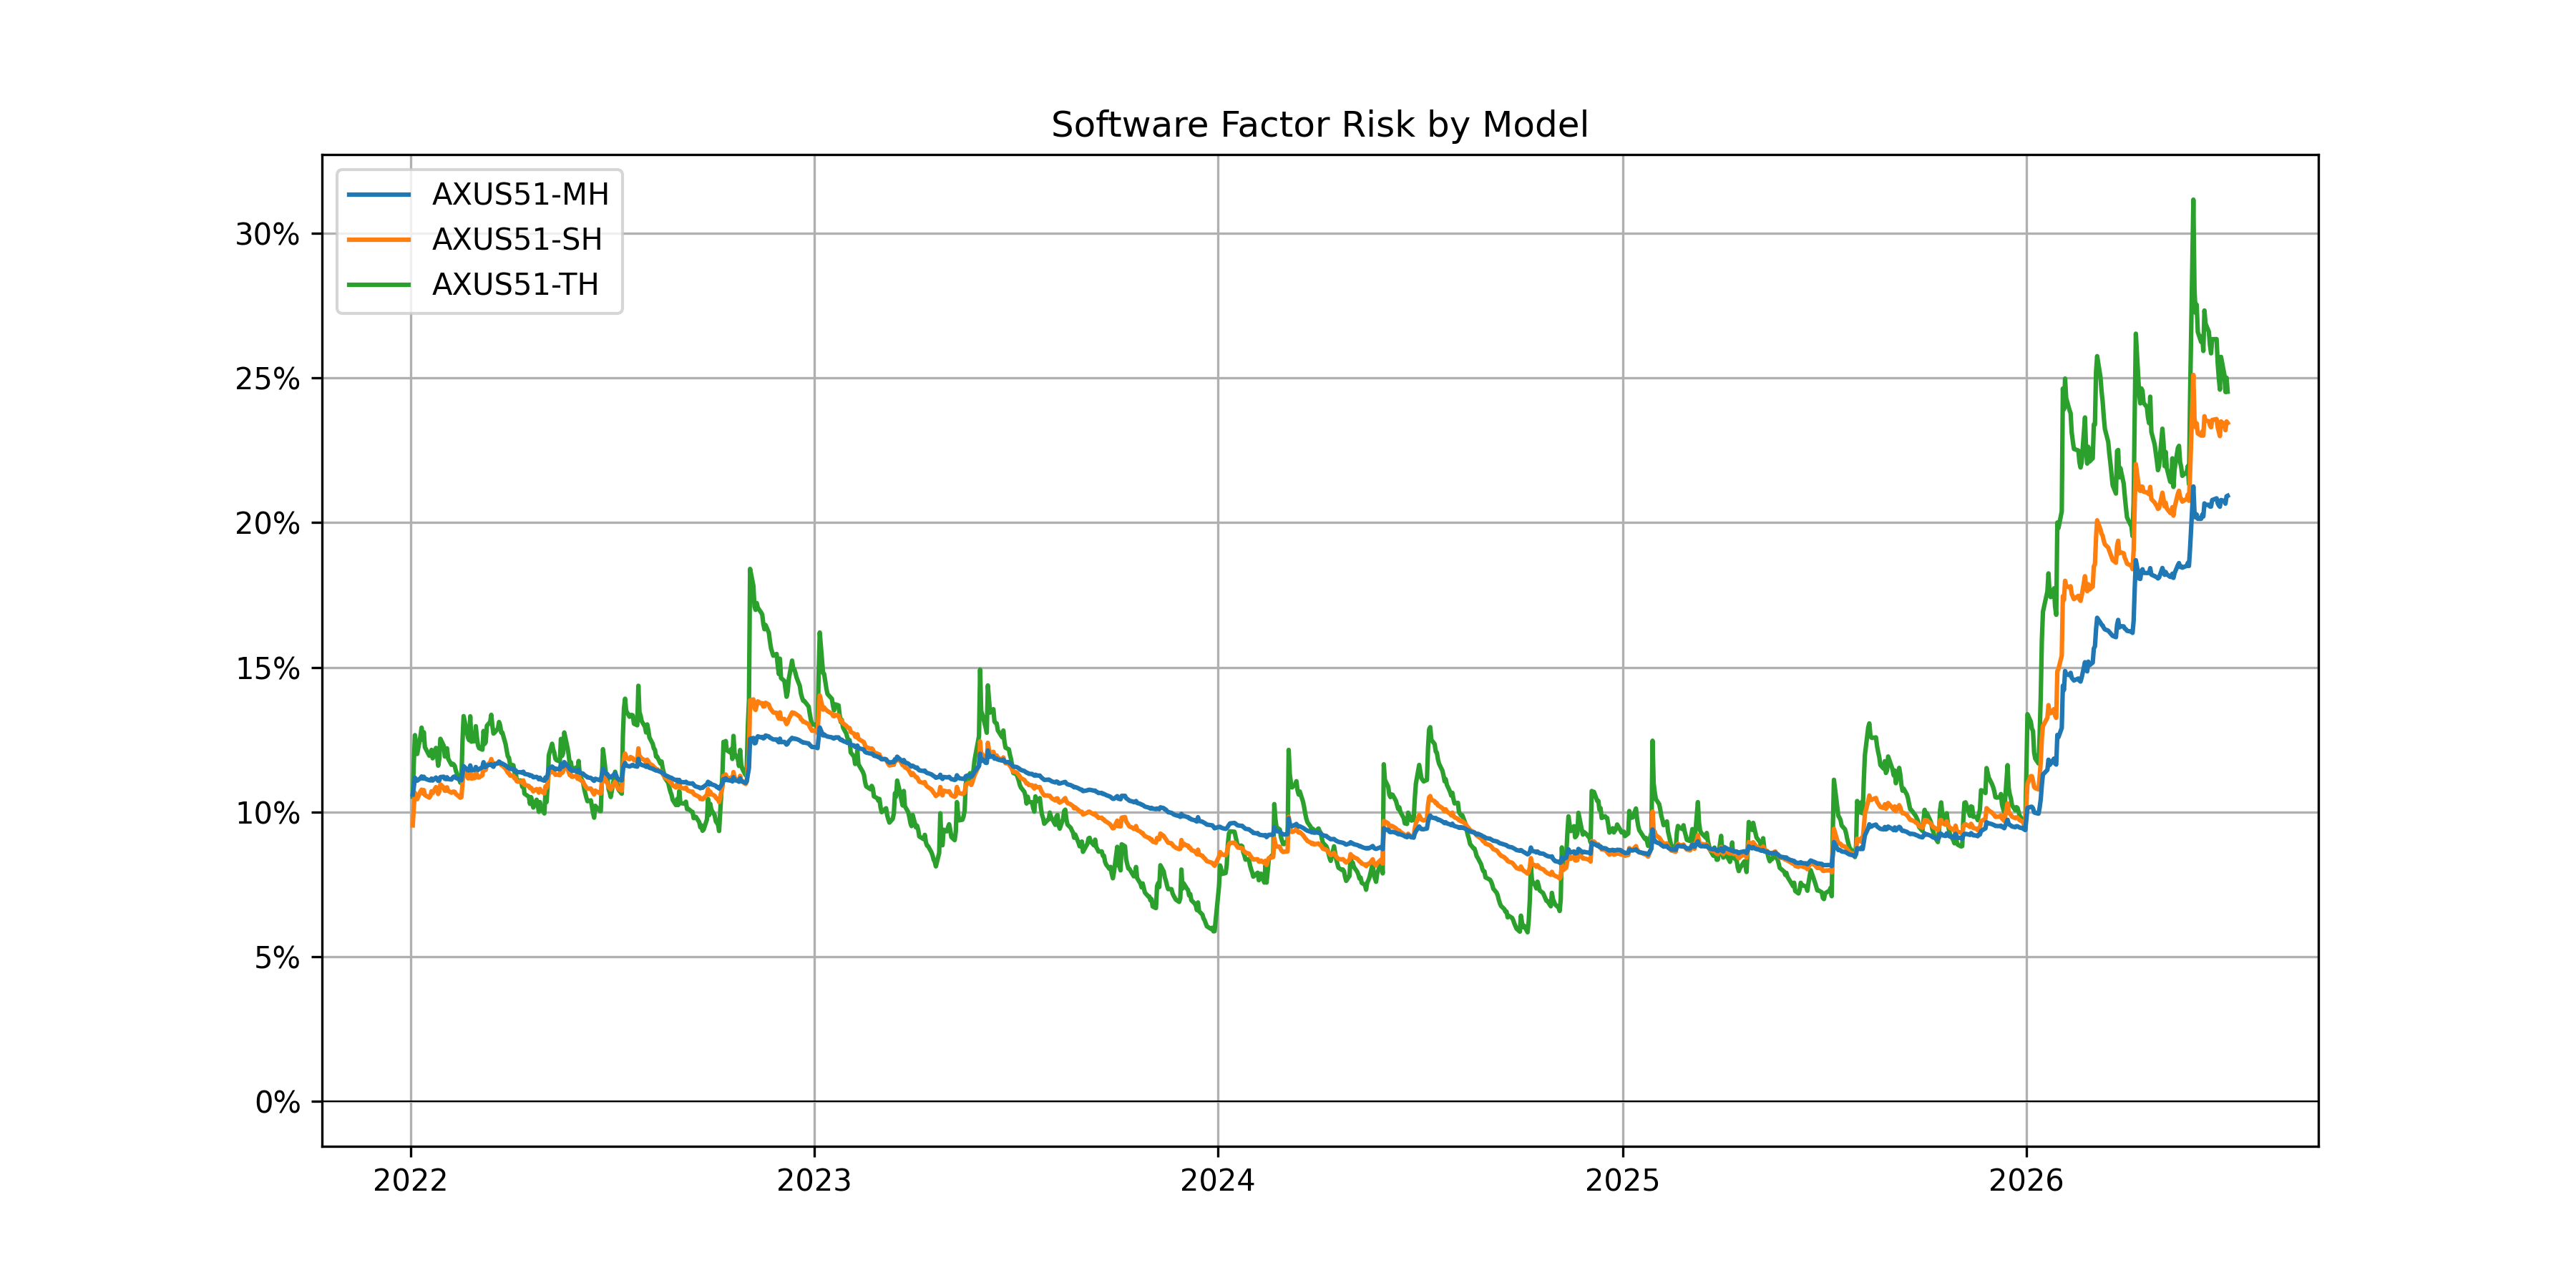
Over the same period, the Software industry factor return has been more volatile than historical norms and the factor’s risk remains elevated, but for those willing to take on the risk, some regression to the mean seems in order.
The following chart is not included in the Equity Risk Monitors but is available on request:
The following chart is not included in the Equity Risk Monitors but is available on request:
You may also like