
EQUITY RISK MONITOR HIGHLIGHTS
WEEK ENDED SEPTEMBER 25, 2026
- Weak Trading Volume Indicates Weak Index Level Support
- Are Emerging Market Index Returns Two Countries in a Trench Coat?
- Get In Loser, Were Going Hedging
Early in the week, the equity market shook off rising bond yields, with the Nasdaq setting back-to-back records on Monday and Tuesday, helped by falling oil prices. AI-linked names saw a boost on Monday when Meta jumped 11% after the launch of its consumer facing AI agent, Muse. However, equity sentiment soured on Wednesday, due to consternation over the 10-year Treasury yield reaching its highest level since July 2007 and rumblings that the Fed will need to further raise interest rates.
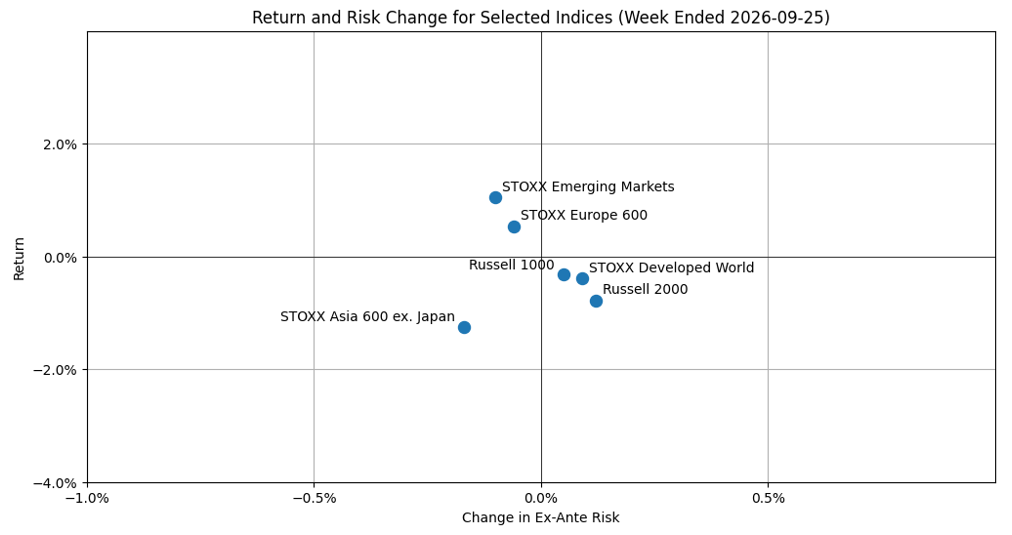
Nonetheless, risk across the indices we track stayed fairly level with no major index’s predicted risk moving by more than 20bps positively or negatively. The Russell 2000 had the largest increase of 12bps while the STOXX Asia 600 ex-Japan the largest decline of -17bps.
The following chart is not included in the Equity Risk Monitors but is available on request:
That Summer Feeling
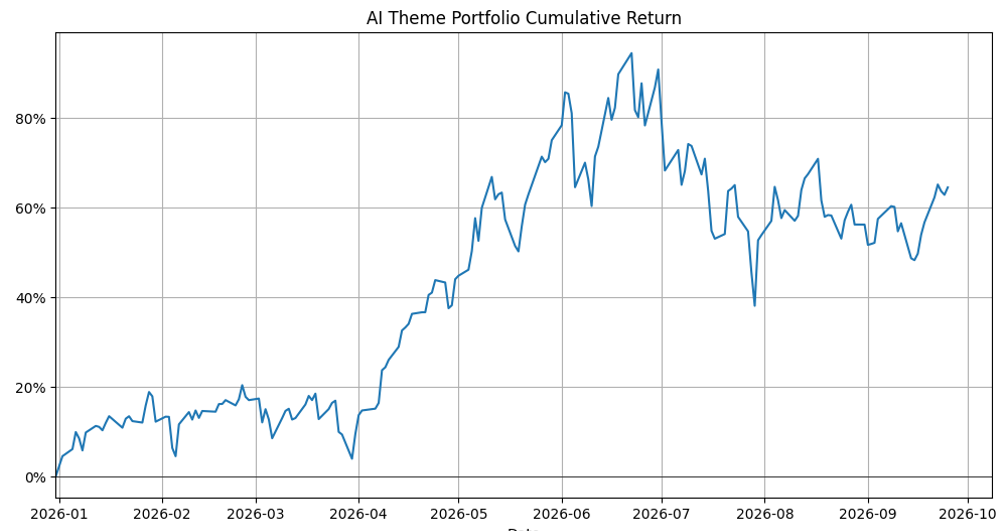
As excitement over the AI build out crested over the summer, global markets rallied but have since traded sidewise.
The following chart is not included in the Equity Risk Monitors but is available on request:
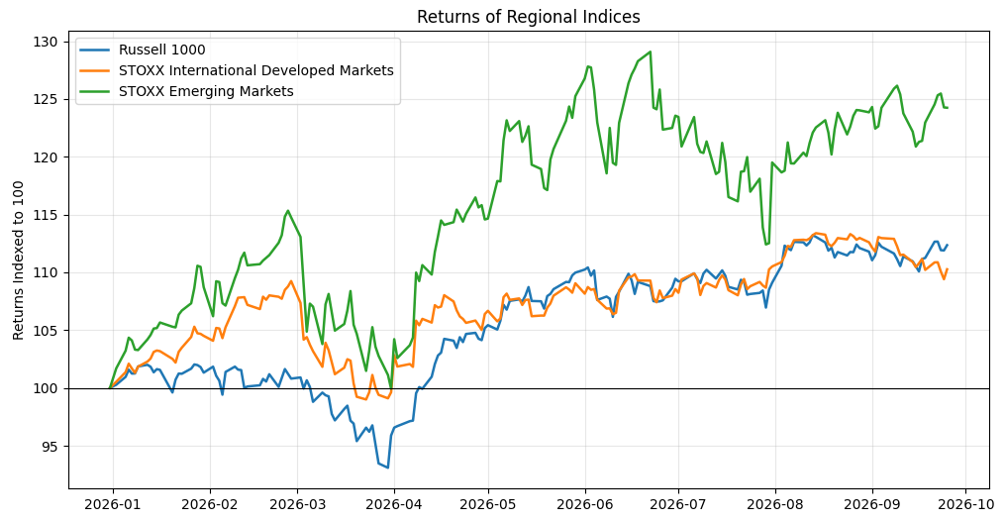
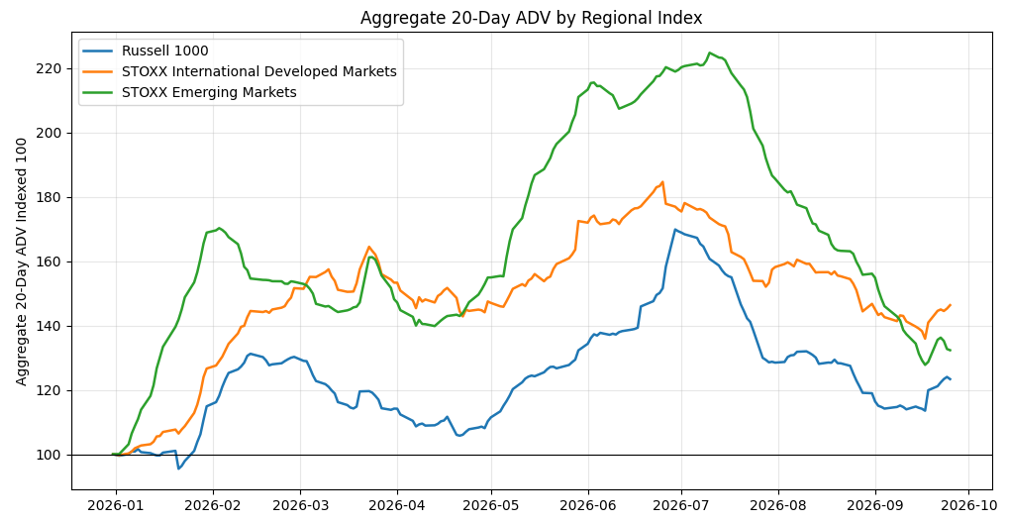
While these three indices have maintained relatively high levels, trading volume has decreased dramatically, indicating potentially weak support. This is especially true in the STOXX Emerging Markets Index, which had seen a much larger growth in volume at peak compared to the Russell 1000 and STOXX International Developed Markets.
The following chart is not included in the Equity Risk Monitors but is available on request:
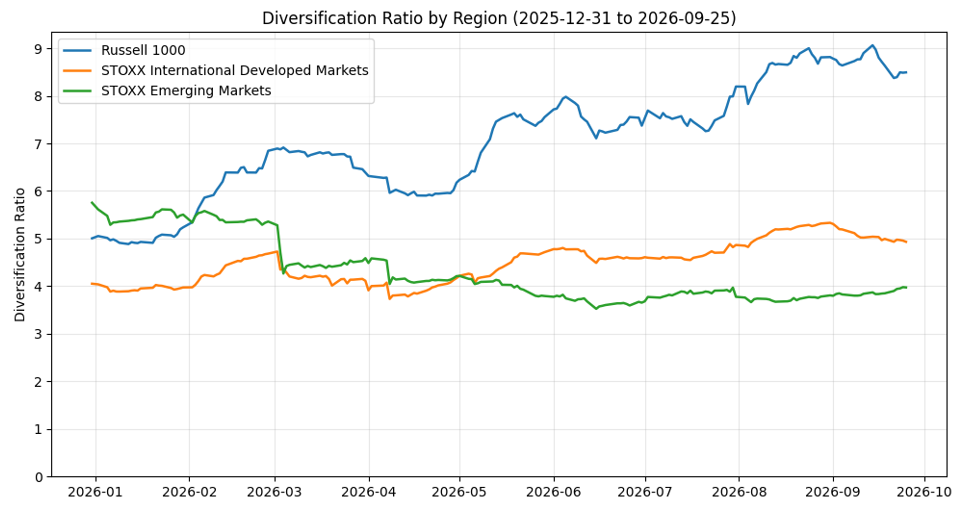
Using each benchmark’s appropriate risk model, we see that predicted risk in the US and in Developed Markets has remained mostly flat this year, while risk in Emerging Markets has increased.
The following chart is not included in the Equity Risk Monitors but is available on request:
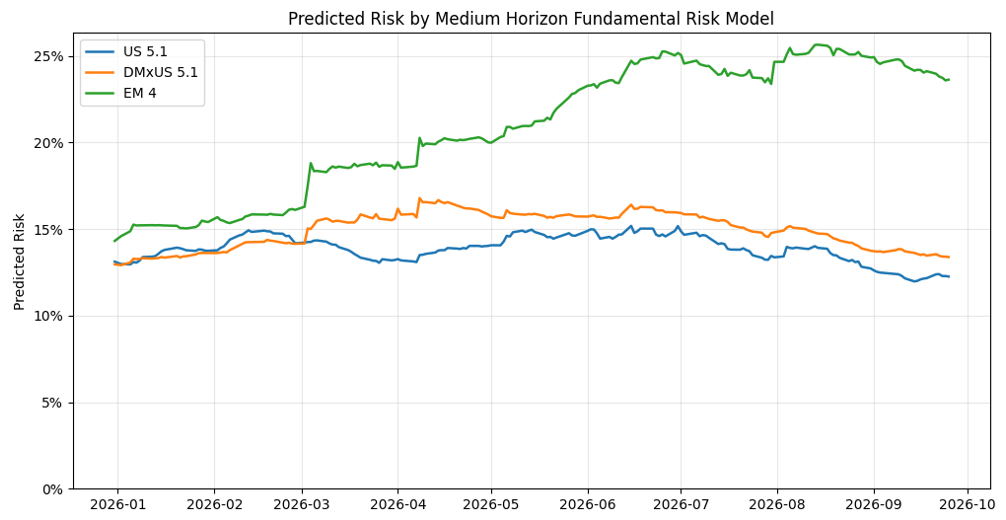
One potential reason for the divergence amongst these regions is that diversification in the Russell 1000 and STOXX Developed Markets has been increasing over the calendar year while the STOXX Emerging Markets index has become more concentrated.
The following chart is not included in the Equity Risk Monitors but is available on request:
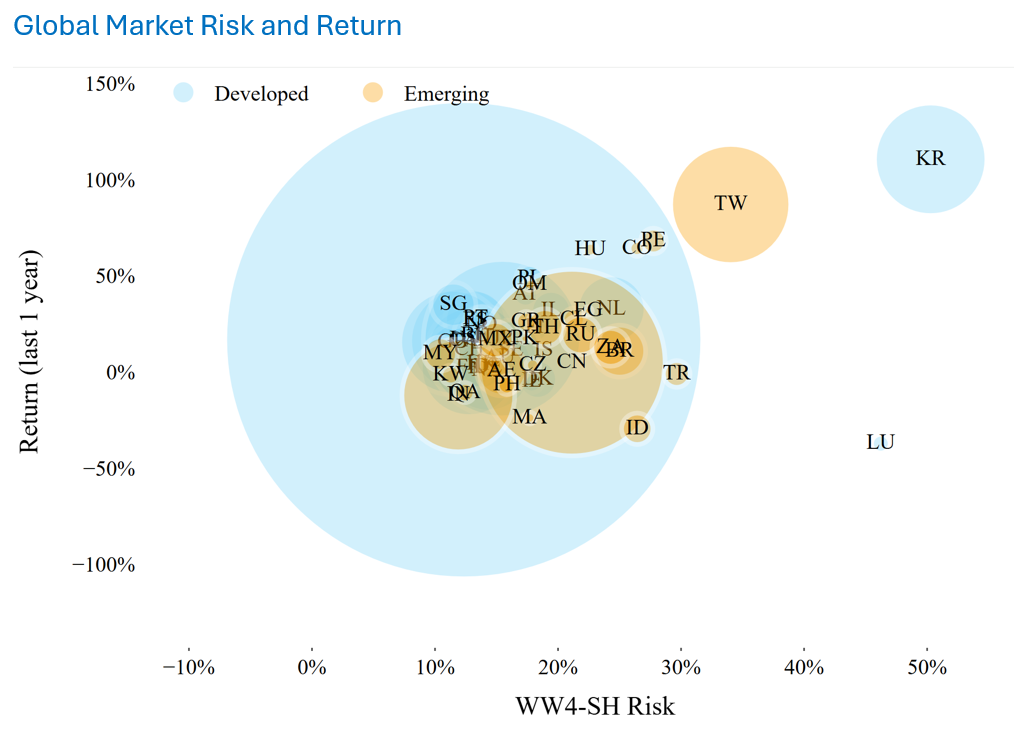
As we originally wrote back in May, Korea and Taiwan have seen uniquely strong returns (and risk) globally, and these countries’ influence on index stock returns seems to have only increased, even as returns overall have fallen.
See chart included in all equity risk monitors dated September 25, 2025
I’m a Loser Babyyy
In the July 3, we observed that the Software factor return was negatively correlated with the AI theme dominating the market. Earlier in the AI build out, these names might have been dubbed “AI Losers”, but since the summer peak, AI sentiment has since turned negative:
The following chart is not included in the Equity Risk Monitors but is available on request:
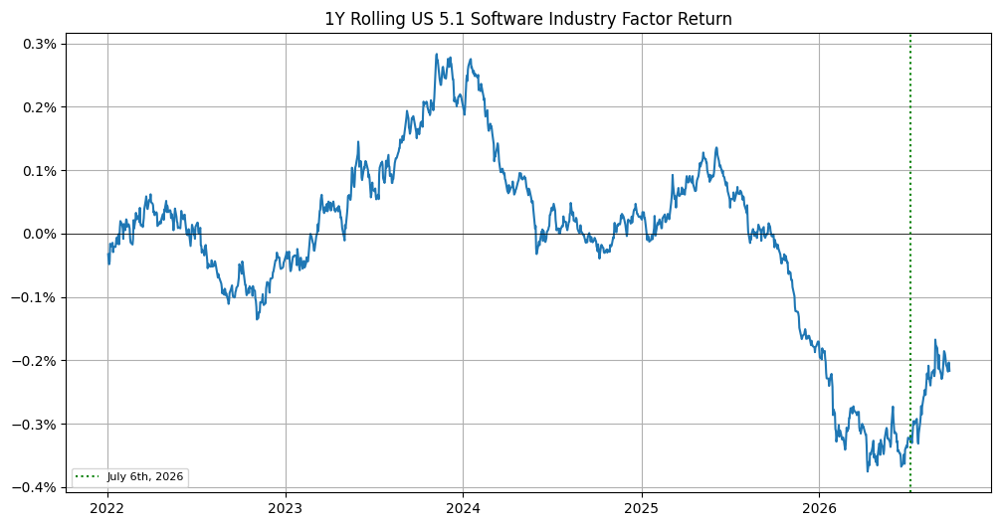
In that post, we remarked:
[T]he Software industry factor return has been more volatile than historical norms and the factor’s risk remains elevated, but for those willing to take on the risk, some regression to the mean seems in order.
Well, we have indeed experienced some regression to the mean since then...
The following chart is not included in the Equity Risk Monitors but is available on request:
…and the ride up has been fairly bumpy with 3 weekly return readings posting 3 standard deviations above the long-term mean:
The following chart is not included in the Equity Risk Monitors but is available on request:
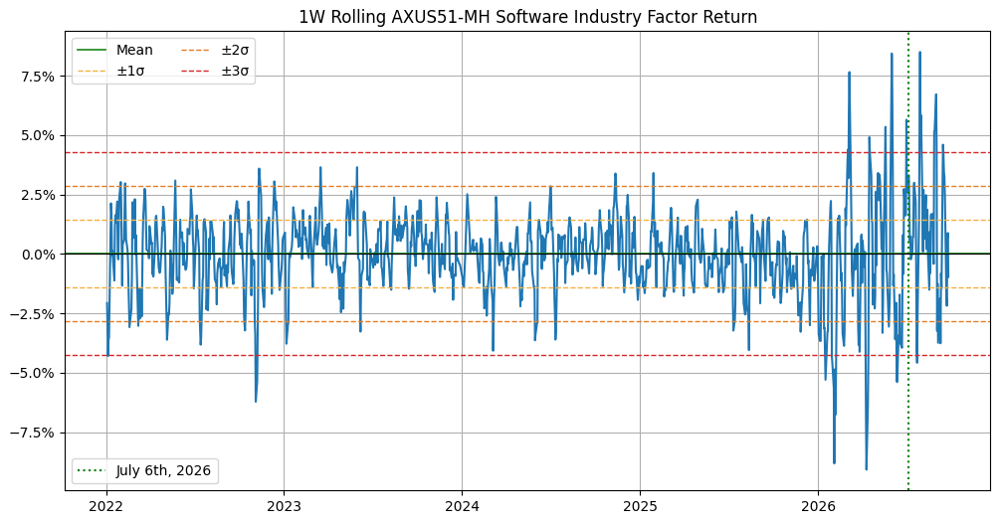
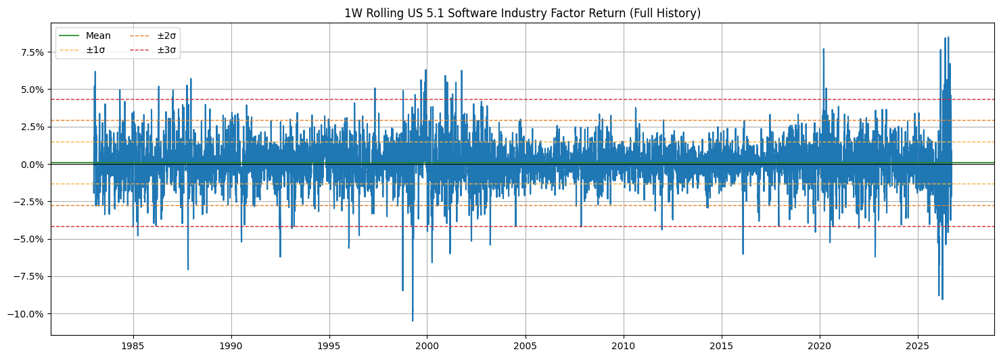
The Software factor has never “melted up” so drastically—3 of the 5 highest weekly returns in the history of the US 5.1 Medium Horizon model have occurred during 2026:
The following chart is not included in the Equity Risk Monitors but is available on request:
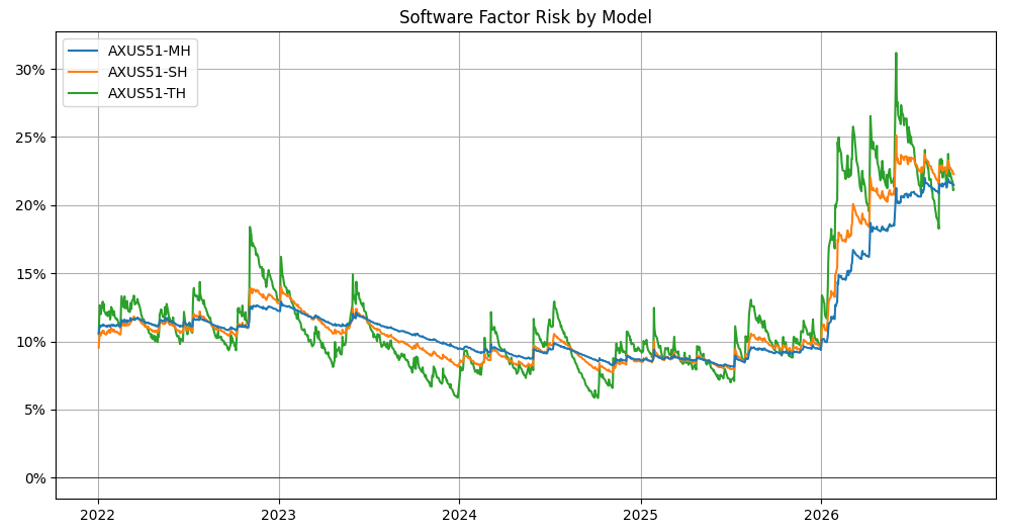
Still, predicted volatility as measured by our Short and Trading risk models show that the factor’s risk has come down from peak but remains elevated:
The following chart is not included in the Equity Risk Monitors but is available on request:
Taken together, the Software industry is looking like a pretty good AI Theme hedge for those who feel the need, and can be implemented with positive exposure to names within the industry or even a cheap industry ETF. Investors who are nervous about the AI bet may choose to overweight the AI losers.
You may also like


