

EQUITY RISK MONITOR HIGHLIGHTS
WEEK ENDED MAY 22, 2026
- Axioma Risk Monitor: US Small Cap outperformance persists without industry support; AI boost lifts South Korea and Taiwan but raises Emerging Markets concentration; Financials and Materials drag China lower despite tech strength
US Small Cap outperformance persists without industry support
US indices reached new records after an eighth consecutive week of gains, supported by optimism around a potential Middle East peace deal, a strong earnings season, and sustained enthusiasm surrounding AI. Small caps continued to outperform large caps last week, despite the boost large caps have received from mega-cap technology stocks. Year to date, small caps are now ahead of their larger counterparts by nearly 7.5%.
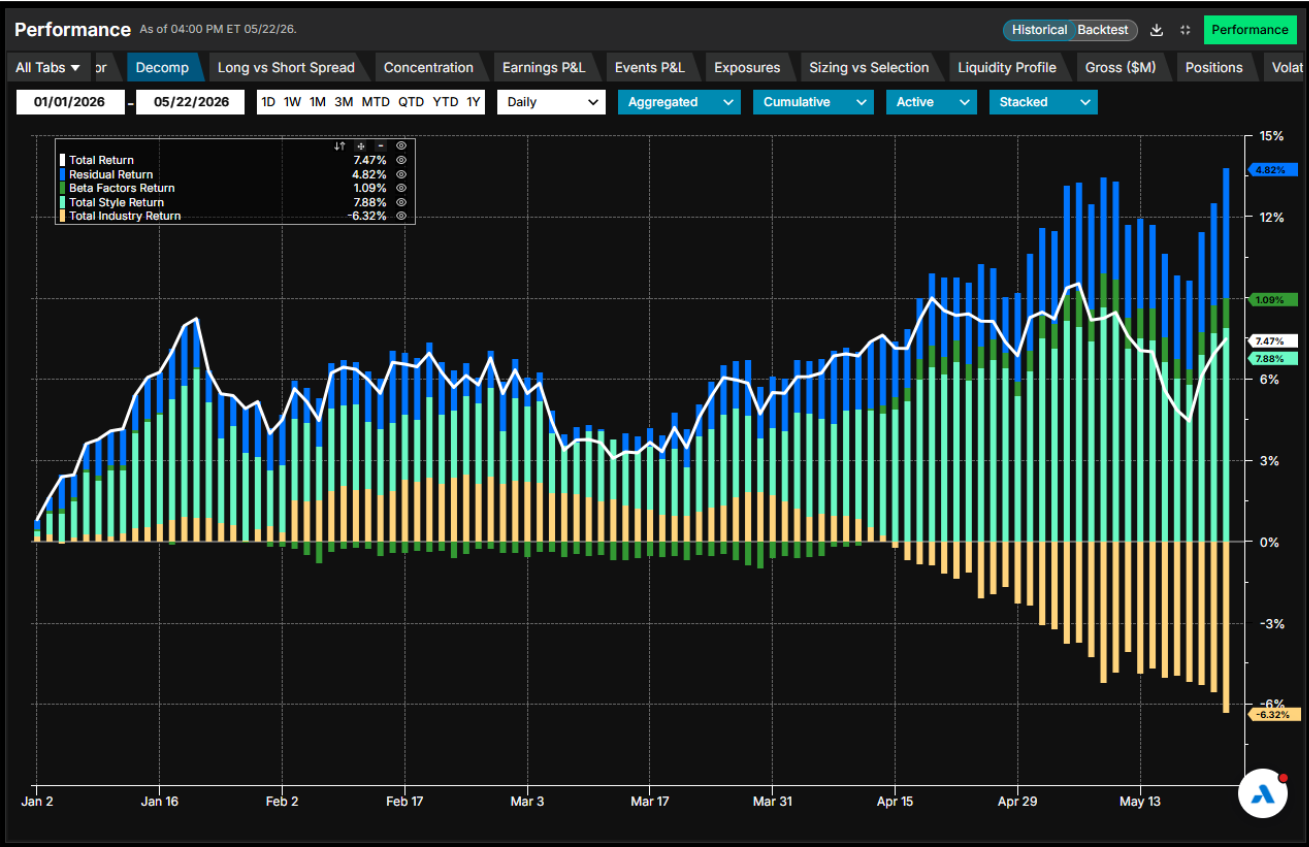
Interestingly, industry factors in aggregate, have not contributed to this outperformance. Differences in industry allocation between the Russell 2000 and the Russell 1000 supported a positive Industry factor contribution to the Russell 2000’s active return in the first quarter, but this effect turned negative in mid-April and has since become strongly negative. Not surprisingly, the largest detractors have been Semiconductors and Technology Hardware—precisely the industries that delivered the strongest positive contributions within large caps.
Instead, style factors have been the primary driver of small-cap outperformance. The Russell 2000 exhibits sizable positive active exposures to Momentum, Value, and Downside Risk, alongside a negative exposure to Size, based on Axioma’s US5.1 Fundamental Medium-Horizon Model. This suggests a clear investor preference for smaller companies with strong momentum, a value tilt, and higher downside risk profiles. For more details, see our article The factors fueling small cap strength.
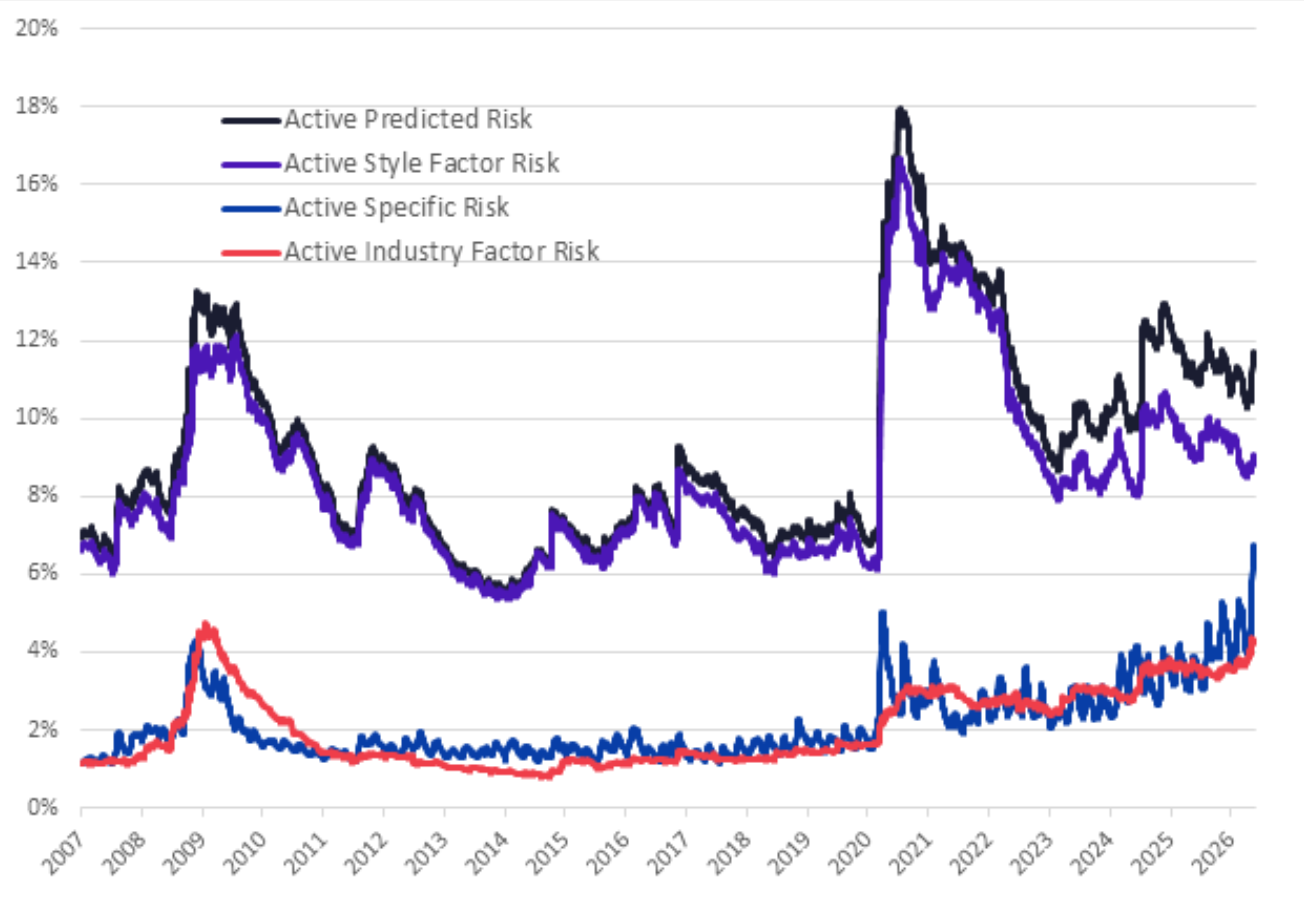
Russell 2000’s style factor active risk closely mirrors the index’s total active risk, underscoring its role as the primary driver of total risk. Although style factor risk has increased over the past month, it remains moderate relative to historical peaks. In contrast, industry active risk has surged to levels last seen during the Global Financial Crisis, while specific risk has risen to highs not observed in at least two decades.
The chart below is not included in the Equity Risk Monitors but is available upon request:
Russell 2000® Decomposition of Year-to-Date Active Return vs. Russell 1000®
Source: Arcana
Russell 2000® Active Risk Components
Source: FTSE Russell, Axioma
AI boost lifts South Korea and Taiwan but raises Emerging Markets concentration
The AI boom has particularly benefited Taiwan and South Korea, driven by strong demand for AI-related products produced in these markets. The STOXX Emerging Markets index has not only recovered the sharp losses following the Middle East conflict but, with a 21% year-to-date return, has emerged as the top performer among the major indices tracked by the Equity Risk Monitors. Notably, this strong performance has been entirely driven by South Korea and Taiwan.
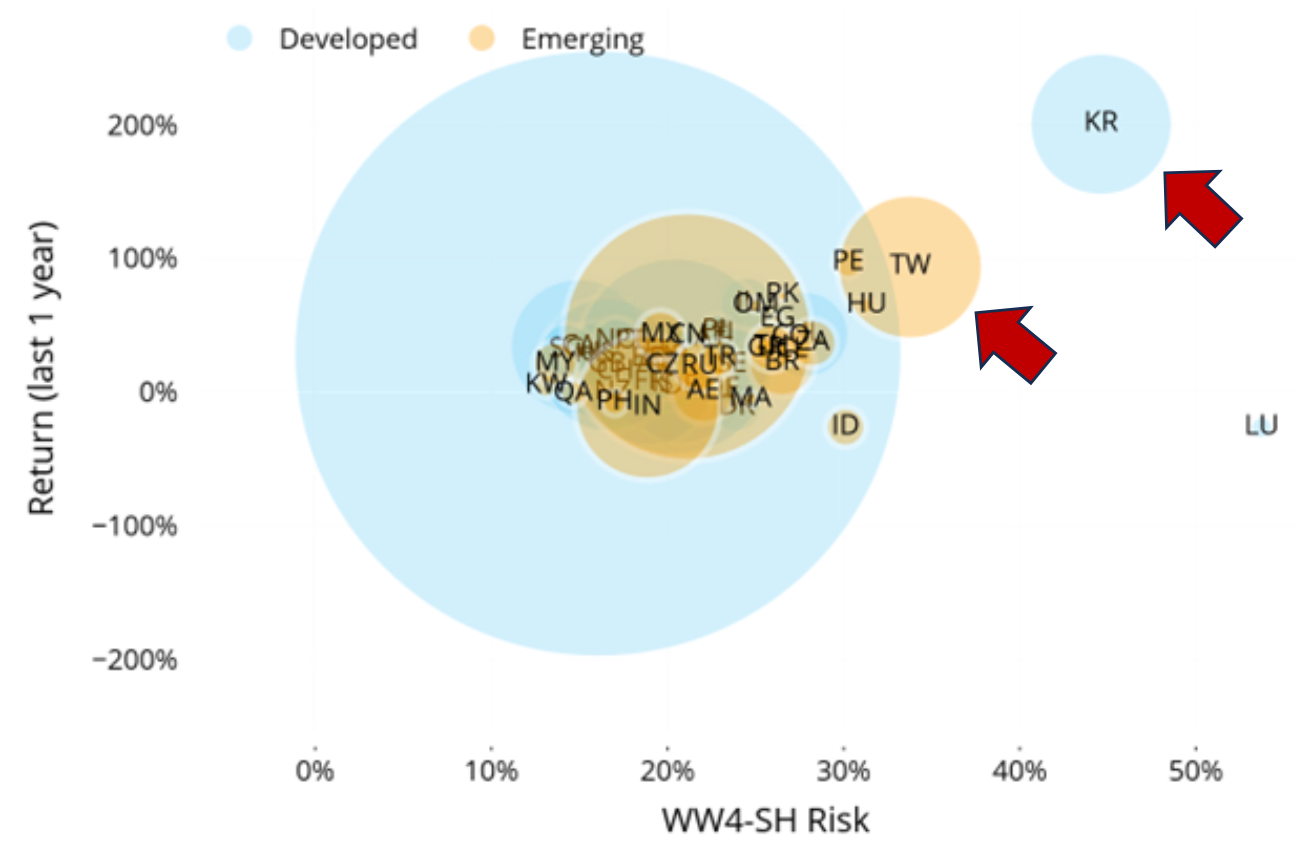
Year to date, South Korea (up 90%) and Taiwan (up 50%) have recorded substantial gains, but their 12-month performance is even more striking, with Taiwan’s market doubling and South Korea’s roughly tripling. According to the Worldwide Fundamental Short-Horizon Model, both markets have consequently become the riskiest across developed and emerging market countries.
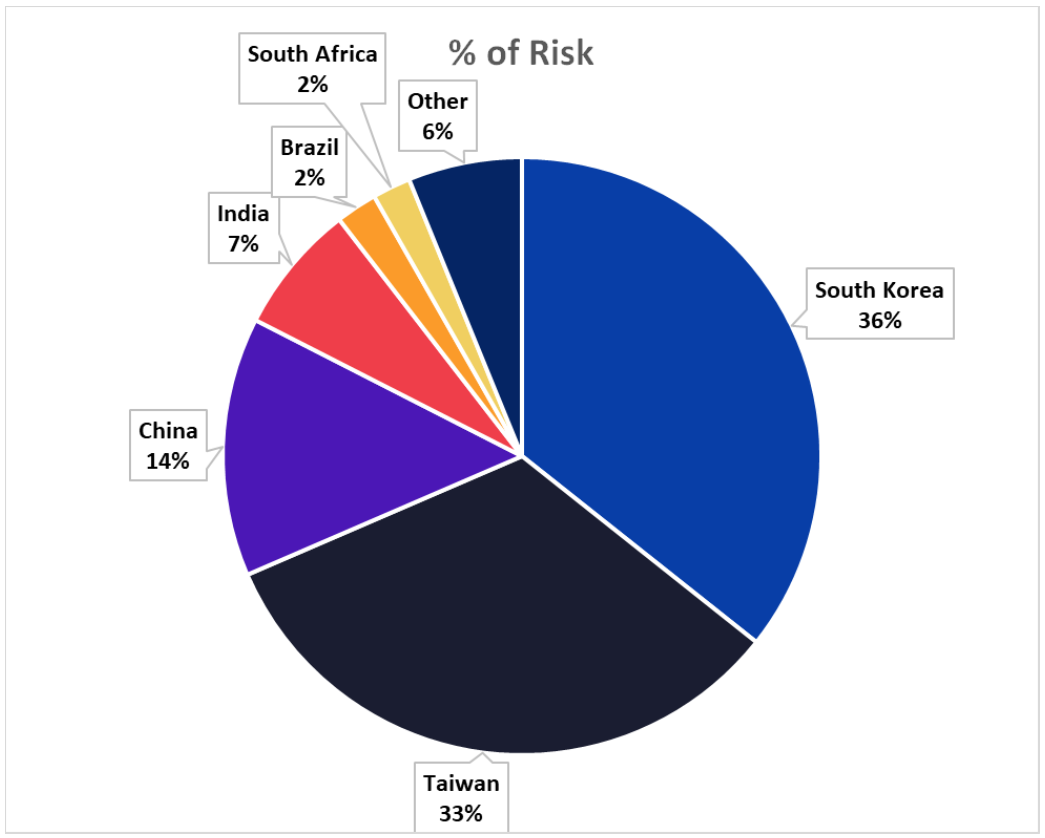
South Korea and Taiwan each account for at least one-third of the total risk of the STOXX Emerging Markets index, contributing significantly more than their index weights (just above 20%) would suggest. By contrast, China’s contribution to index risk is notably lower than its 22% weight. Despite having a similar weight to South Korea, China contributes only around 14% to total index risk.
See chart from the Equity Risk Monitors as of 22 May 2026:
Global Market Risk and Return
The chart below is not included in the Equity Risk Monitors but is available upon request:
Country Contribution to STOXX Emerging Markets’ Risk
Source: STOXX, Axioma
Financials and Materials drag China lower despite tech strength
Chinese equities appeared broadly stable week over week, but this masked notable moves driven by technology optimism, shifting energy dynamics, and policy intervention. Early in the week, the market was lifted by technology stocks, propelled by enthusiasm around artificial intelligence. Those gains reversed quickly after a major coal mine explosion disrupted energy markets and commodity prices. By week’s end, a government crackdown on illegal cross-border trading applications triggered a selloff in Chinese technology stocks, erasing earlier advances.
These developments unfolded against a challenging structural backdrop. Strong exports continued to be offset by weak domestic demand, subdued consumption, declining investments, and a persistent downturn in the property sector.
Overall, the STOXX China A 900 Index declined by roughly 50 basis points for the week, though it is important to remember that the Chinese stock market is heavily regulated. Year to date, China has been among the weakest performers across the geographies tracked by the Equity Risk Monitors.
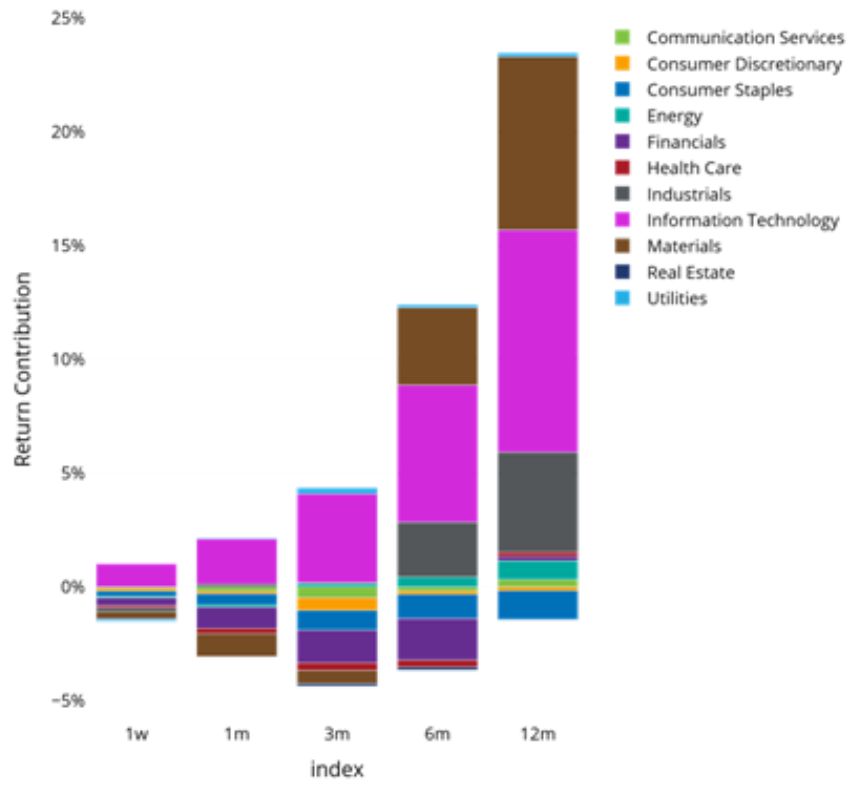
At the sector level, Information Technology was the only segment to retain weekly gains, extending its monthly increase to 23%. In contrast, Real Estate, Communication Services, and Consumer Staples posted the largest declines both over the past week and the past month, with four-week losses ranging from 10% to 20%.
Yet, it was Financials and Materials that exerted the greatest downward pressure on the STOXX China A 900 index over the past week and month due to their heavier weights. While Information Technology contributed positively to the index’s return, this was more than offset by negative contributions from the rest of the sectors, pushing the index into negative territory for the week and month.
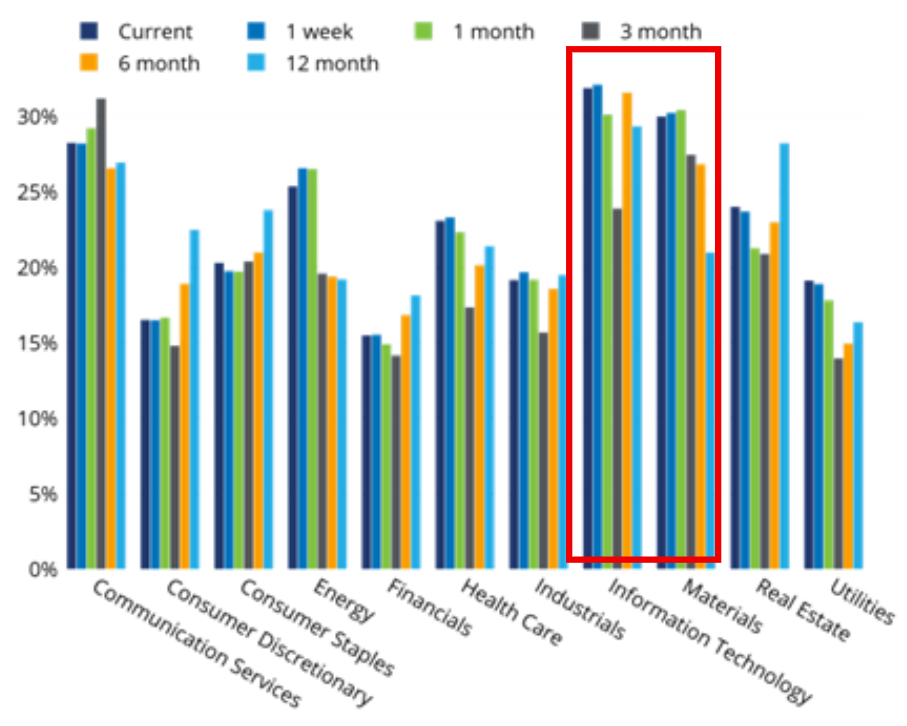
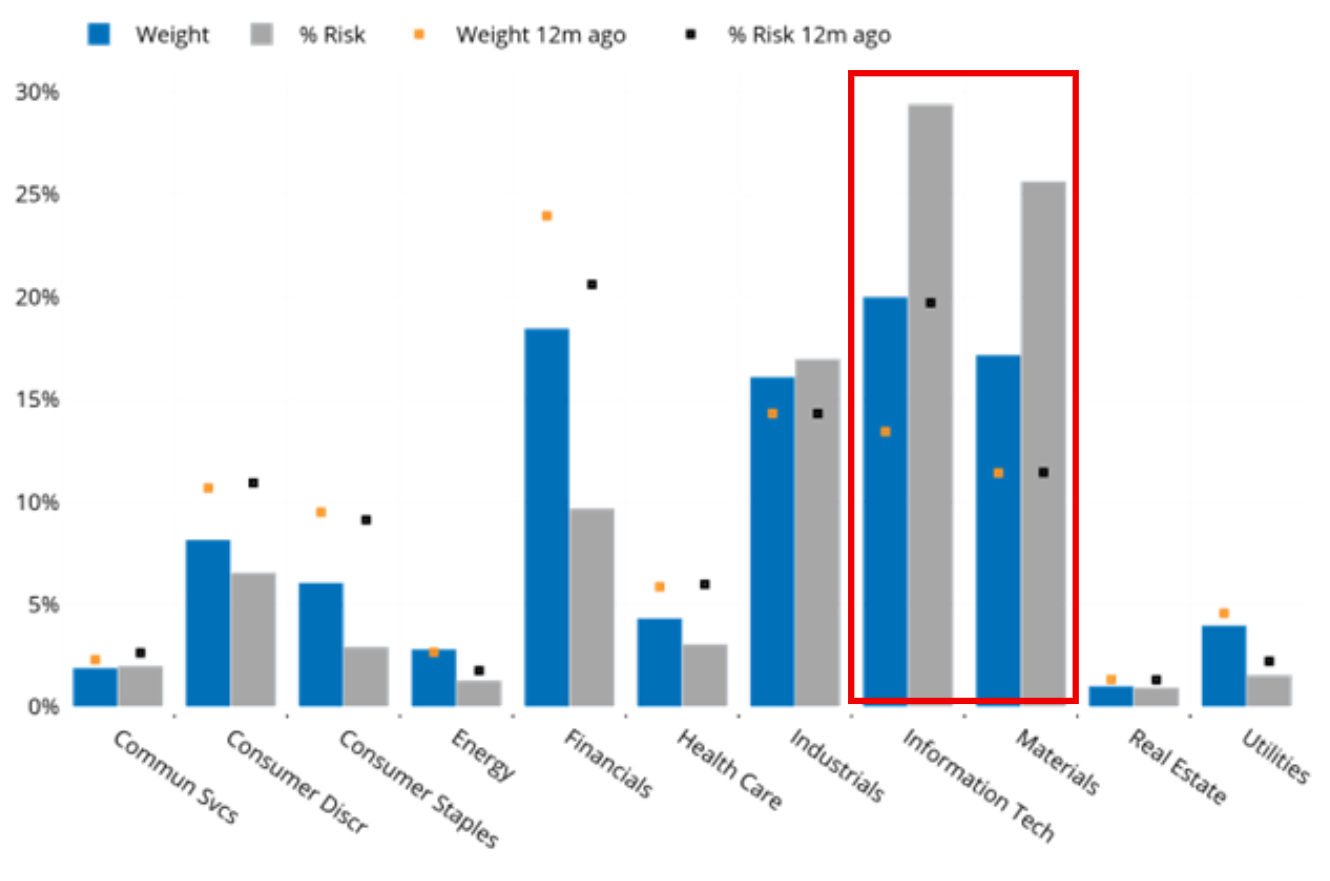
From a risk perspective, Information Technology and Materials now stand out as the riskiest Chinese sectors and have the highest contributions to benchmark risk. Their risk contributions significantly exceed their respective weights, and together account for more than half of overall benchmark risk.
See charts from the STOXX China A 900 Equity Risk Monitor as of 22 May 2026:
STOXX® China A 900 - Sector Return Contribution
STOXX® China A 900 - Sector Risk
STOXX® China A 900 - Sector Weights and % of Risk
You may also like

.png%3Fh%3D810%26iar%3D0%26w%3D1080&w=3840&q=75)
