

EQUITY RISK MONITOR HIGHLIGHTS
WEEK ENDED OCTOBER 16, 2026
Axioma Risk Monitor: The US tech selloff moves down the AI supply chain; Emerging Markets’ AI concentration shifts from Korea to Taiwan; European low-volatility stocks have their best month since 2008
The US tech selloff moves down the AI supply chain
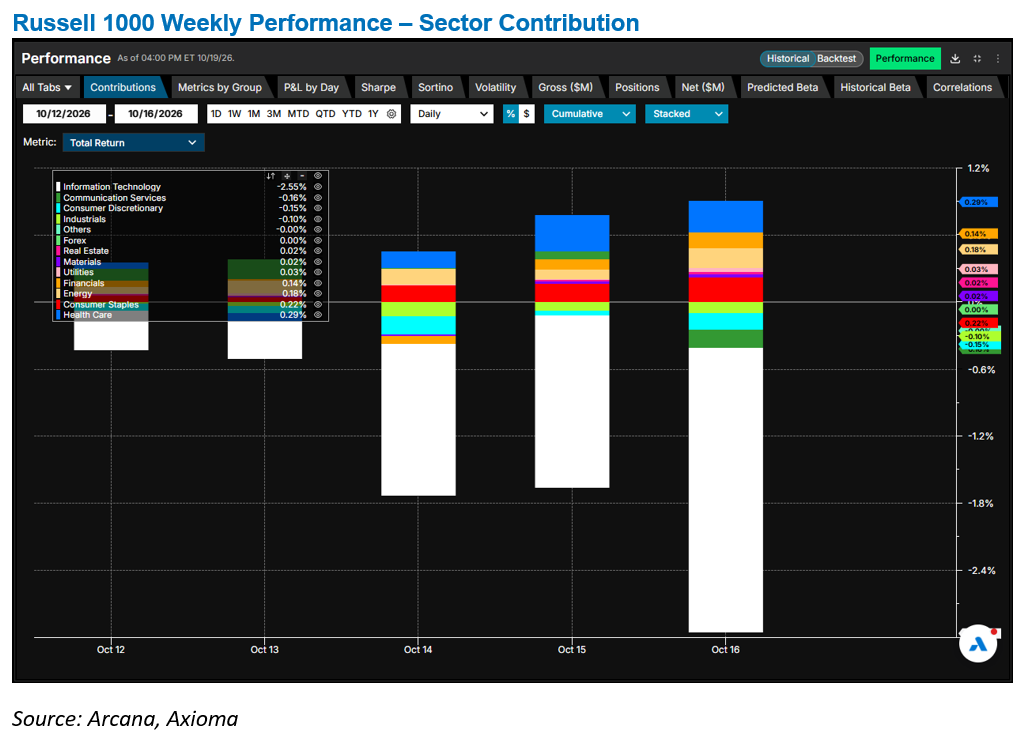
A global selloff in AI-related stocks pulled the Russell 1000 down 2% last week after hotter-than-expected inflation data strengthened expectations of a rate hike in the coming months, a development that could place significant pressure on highly leveraged growth stocks, particularly within technology.
Unlike June’s mega-cap meltdown, this time the losses spread throughout the AI hardware supply chain. The eight mega-caps that drove June’s decline—Nvidia, Broadcom, Apple, Alphabet, Amazon, Oracle, Meta and Tesla—accounted for half of last week’s loss. Apple was the only one of the eight to post a gain.
The Semiconductors & Semiconductor Equipment industry fell nearly 10% and was responsible for most (83%) of the US index decline, with 23 of its 37 stocks down more than 10%. Even excluding Nvidia and Broadcom, the remaining semiconductor stocks shaved almost a full percentage point off the Russell 1000’s weekly return despite a combined index weight of less than 7%. Memory and chip-equipment manufacturers posted the steepest declines.
The selling pressure also spread to companies involved in building and connecting AI data centers: Communications Equipment (-13%) and Electronic Equipment (-13%), both within Information Technology, as well as Construction & Engineering (-11%) and Electrical Equipment (-9%), which fall within the Industrials sector.
The tech selloff was relatively orderly, with trading volumes in Information Technology shares only modestly above their one-year average, compared with roughly double their one-year average levels during June’s downturn.
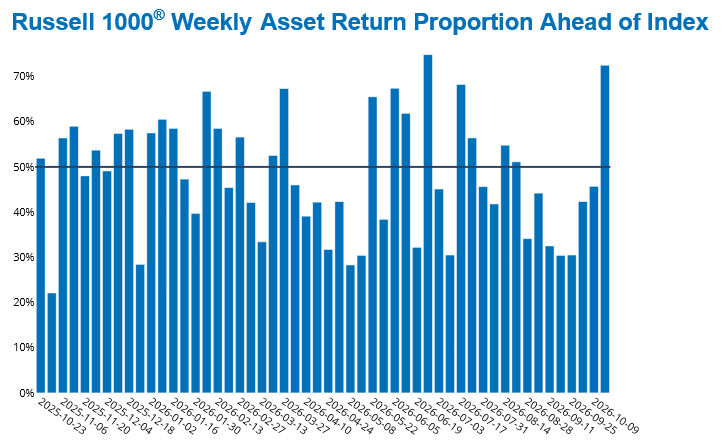
Beyond Information Technology, most of the US market proved remarkably resilient. Seven of the eleven GICS sectors advanced, led by Consumer Staples (+5%), Energy (+5%) and Health Care (+3%), suggesting a rotation away from technology and toward more defensive areas of the market. More strikingly, 72.5% of Russell 1000 stocks outperformed the index.
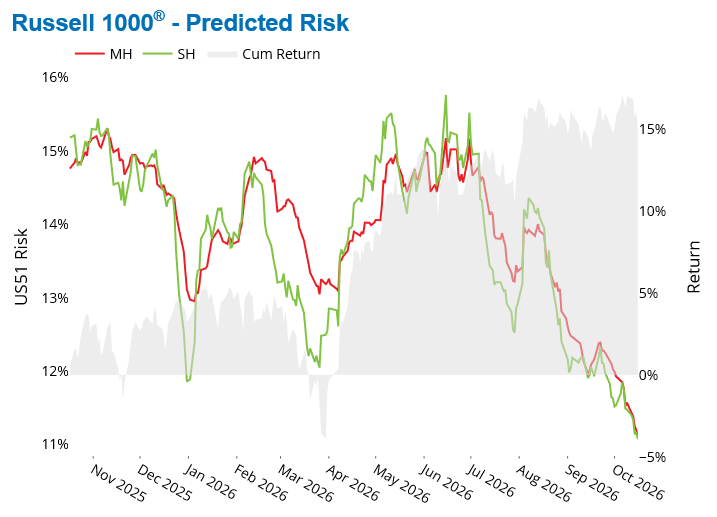
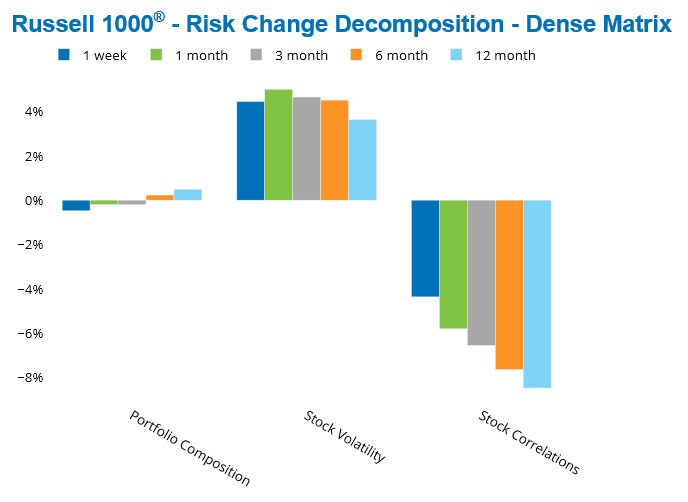
At the market level, however, risk appeared subdued. Predicted risk for the Russell 1000 edged down slightly last week and now stands at roughly 11%—its lowest level in more than two years according to the Axioma US51 fundamental short-horizon model. Although stock volatility increased last week, lower correlations and small changes in index composition more than offset that rise.
The mega-caps’ influence on risk has barely diminished, with the eight stocks accounting for 47% of the Russell 1000’s risk despite representing 29% of its weight, extending the concentration we highlighted in June, when they accounted for 44%. For investors, the low headline risk number understates how heavily a cap-weighted US portfolio still depends on the AI trade.
The chart below is not included in the Equity Risk Monitors but is available upon request:
See charts from the Russell 1000 Equity Risk Monitor as of October 16, 2026:
Emerging Markets’ AI concentration shifts from Korea to Taiwan
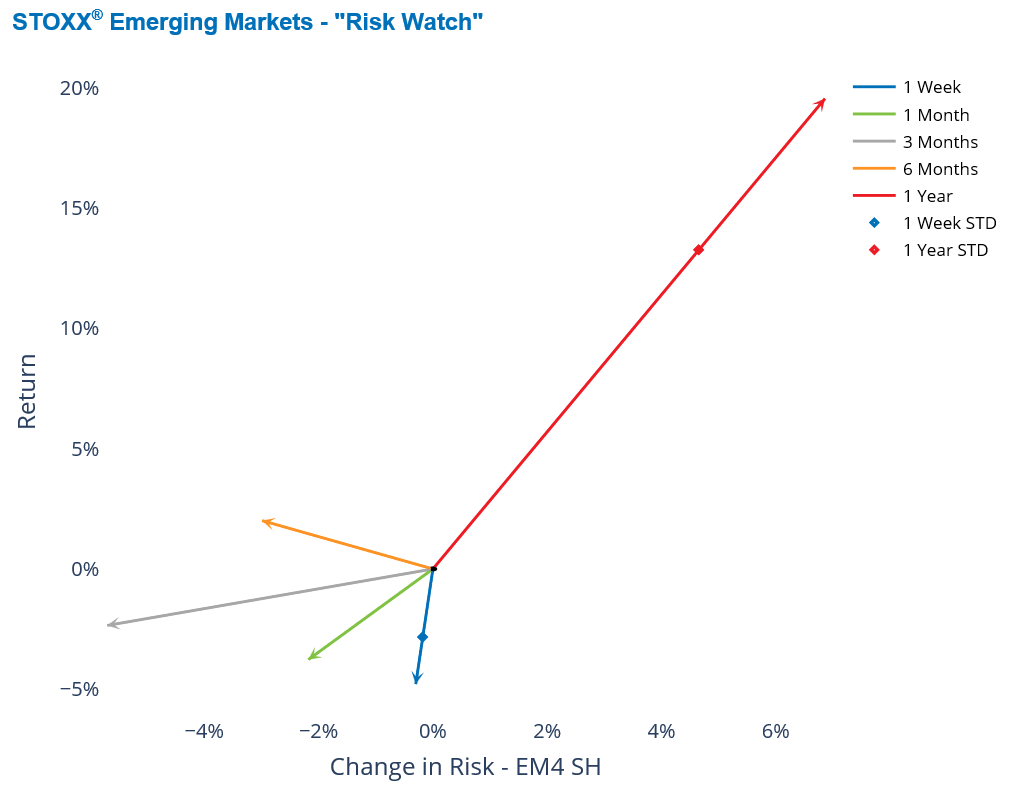
The chip-stock selloff hit Emerging Markets much as it did in June. The STOXX Emerging Markets Index fell nearly 5% last week, more than double the decline in the US, with Information Technology (-11%) accounting for roughly 97% of the index loss. Emerging Markets’ weekly decline was nearly two standard deviations lower than the expectation at the beginning of the week, as predicted by the Axioma EM4 fundamental short-horizon model.
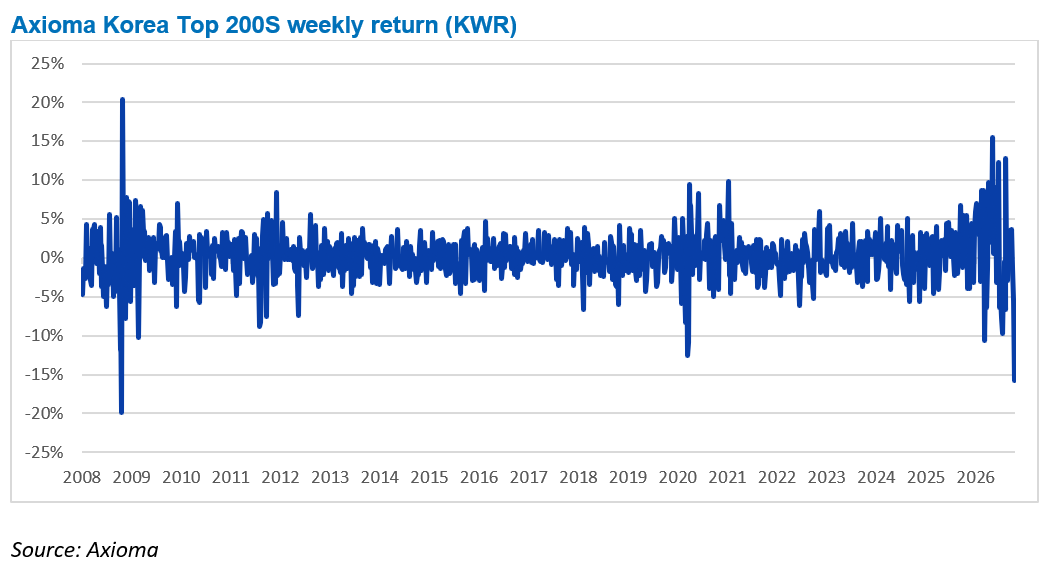
South Korean equities dropped 16%, subtracting 3 percentage points from the STOXX Emerging Markets Index. Samsung Electronics (-17%) and SK Hynix (-24%) alone explained about half of the decline while representing a combined weight of 11%. Taiwan fell 6.5% and removed a further 2 percentage points. India (+4%) was the only major emerging market country to contribute positively (albeit only slightly). Indonesia declined 17% after an index provider signaled it could lose its emerging-market classification, though its relatively small weight reduced the overall impact to barely a tenth of a percentage point.
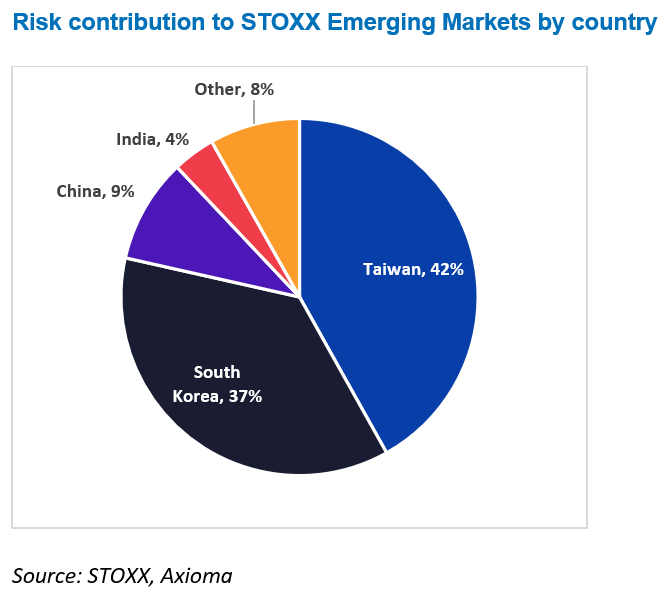
The recent tech rout has also altered the distribution of risk across Emerging Markets. Following its largest weekly decline since 2008, South Korea’s weight in the index dropped to 16.5% from 23.5% at the end of June, while its contribution to benchmark risk fell to 37% from 44%, according to the Axioma EM4 fundamental short-horizon model. Taiwan has effectively taken its place, accounting for 42% of benchmark risk while having a 28% index weight. TSMC alone contributes 22.5% to STOXX Emerging Markets risk.
Importantly, the concentration in AI hardware has moved without easing. Information Technology’s share of STOXX Emerging Markets risk rose to 72% from 69% at the end of June, even as its weight declined to 39% from 43%.
For investors, the decline in South Korea’s index weight after the selloff does not eliminate the AI-hardware bet within an Emerging Markets portfolio. Increasingly, that exposure is concentrated in Taiwan and, to a large degree, in a single company.
See charts from the STOXX Emerging Markets Equity Risk Monitor as of October 16, 2026:
The charts below are not included in the Equity Risk Monitors but are available upon request:
European low-volatility stocks have their best month since 2008
In a more positive development, European equities advanced last week, with the STOXX Europe 600 gaining 2%. Beneath the surface, however, investors have spent more than a month rotating away from higher-volatility stocks and into steadier names at a pace rarely observed.
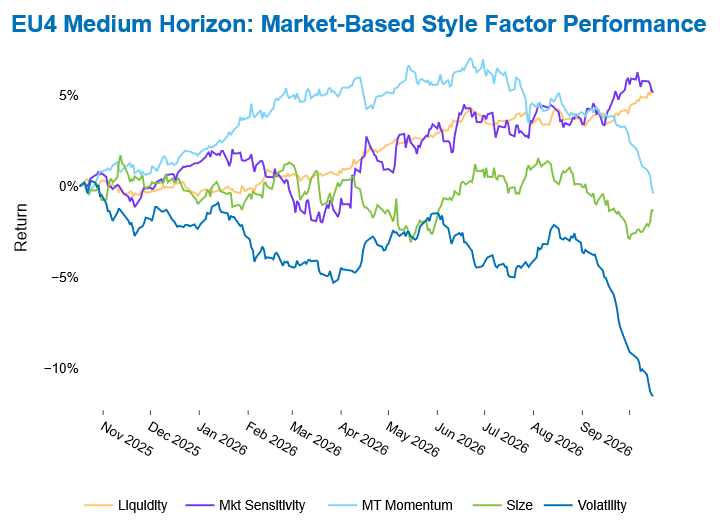
In the Axioma EU4 fundamental medium-horizon model, the Volatility style factor returned -6.8% over the past month, declining on 21 of 22 trading days. This factor decline is a five standard deviation move relative to the expectation at the beginning of the one-month period.
Looking at rolling monthly returns dating back to 1997, only one episode during the Global Financial Crisis produced a steeper decline over a comparable period: October 2008 (-7%). The next-largest four-week loss, approximately -5%, occurred during the dot-com downturn in March 2000.
The Medium-Term Momentum factor also recorded its worst month since December 2020 (-4%) as recent winners surrendered gains. This move is nearly four standard deviations over the expectation at the beginning of the period.
The Volatility factor’s risk climbed to 5%, its highest level since April 2024 and above 85% of all observations since 1997. As a result, European portfolios tilted toward high-volatility and momentum stocks carried a larger and, thus far, more painful active bet.
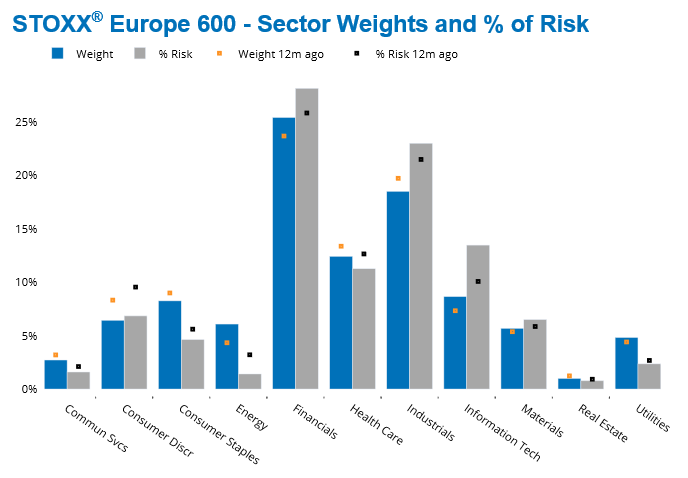
Europe’s gains owe much to its limited exposure to technology. Information Technology represents only about 9% of the STOXX Europe 600, while semiconductors account for less than 6%. Information Technology fell 5% and semiconductors 9% last week, with ASML (-8%) emerging as the largest detractor among all 600 constituents. Defensive sectors more than compensated for those losses: Consumer Staples gained 7% and Health Care rose 5%, with Nestlé, Roche and Novartis serving as the three largest contributors.
Interestingly, while European equities moved higher, risk also increased after reaching a 19-month low on 9 October, according to the Axioma EU4 fundamental short-horizon model. Both risk-change decompositions, viewed from factor and dense-matrix perspectives, attribute the increase to rising volatility and correlations at both the stock and factor levels.
Although Information Technology contributes considerably more to risk than it did a year ago, Europe's risk profile continues to be driven primarily by its largest sectors: Financials and Industrials.
See charts from the STOXX Europe 600 Equity Risk Monitor as of October 16, 2026:
You may also like


