

MULTI-ASSET CLASS MONITOR HIGHLIGHTS
WEEK ENDED OCTOBER 30, 2026
Bond yields keep falling as AI fears outweigh macro data and policy decisions
US Treasury yields continued to fall for a fourth consecutive week in the week ending October 30, 2026, as fears over AI financing once again overshadowed a flurry of macroeconomic data, monetary policy decisions, and fiscal events. Combined with the equity selloff of the past three weeks, this marks the longest period of sustained flight to quality since the trade war-induced episodes of market turmoil during the first Trump presidency in 2019.
The Federal Reserve’s 10-2 vote to hold its policy rate target at 3.75%–4.00% on Wednesday in line with market expectations, while noting that “economic activity is expanding at a strong pace,” did little to prop up rates, even as the notion of resilient investment and spending was underpinned by Thursday’s Q3 GDP estimate of 3.4% per annum. The fact that the Fed’s preferred price gauge, core personal consumption expenditures, accelerated from 3% in August to 3.1% in September had no major impact on bond yields either.
European investors similarly shrugged off British Chancellor John Healey’s inaugural budget on Wednesday and the European Central Bank’s decision to leave policy rates unchanged on Thursday. Neither of these contained major surprises or upsets, leaving Gilt and Bund yields free to follow their American counterparts lower over the last two days of the week.
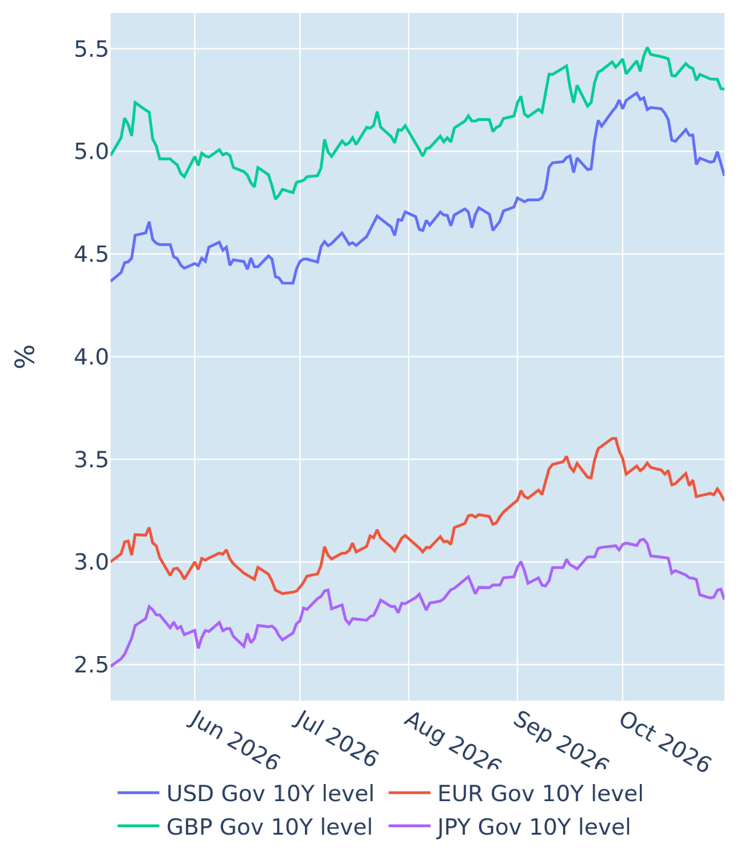
Please refer to Figure 4 of the current Multi-Asset Class Risk Monitor (dated October 30, 2026) for further details.
Equity rout spills into credit market
Last week’s continued stock market rout also spilled over into the credit market, pushing the risk premium on USD-denominated high yield debt to its highest level since the initial shock of the Middle East conflict in early April. The widening was concentrated in the lowest-rated tier of the market, with CCC and below spreads rising far more sharply than the broader high yield average. Leveraged borrowers in AI infrastructure and data centers, many of which carry ratings of single-B or lower, accounted for much of the deterioration, reflecting the same concerns over artificial intelligence spending that weighed on equities.
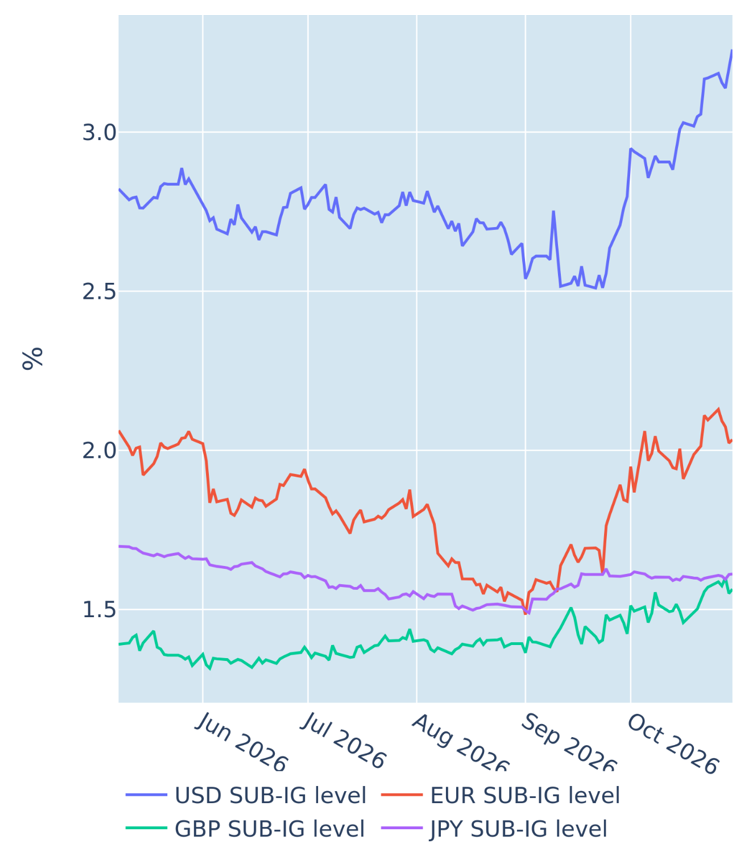
Please refer to Figure 5 of the current Multi-Asset Class Risk Monitor (dated October 30, 2026) for further details.
Lower correlation with FX rates offsets higher equity volatility
Predicted short-term risk for the Axioma global multi-asset class model portfolio remained stable at 4.4% as of Friday, October 30, 2026, as higher equity volatility was offset by a more inverse relationship between share prices and exchange rates against the dollar. The ongoing selloff in US equities expanded their share of total portfolio risk from 51.7% to 57.4%, which marked the biggest increase in percentage risk contribution. Their peers from other parts of the developed world also saw their contribution increase, though to a much smaller extent of 1.9 percentage points, as their higher standalone volatility only marginally outweighed the diversification benefit from a stronger negative correlation with FX rates. It was emerging market equities that derived the greatest benefit from that dynamic, with their share of total risk falling from 6.5% to 3.8%, followed by non-USD sovereign bonds, down from 8.1% to 5.8%. Oil continued to actively reduce overall risk, though to a much lesser extent than in prior weeks, as its relationship with US equities became less inverse.
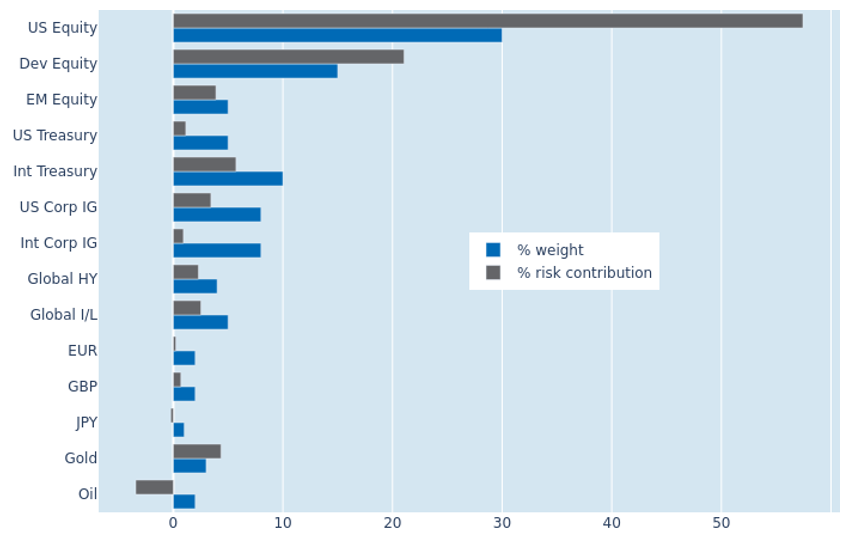
Please refer to Figures 7-10 of the current Multi-Asset Class Risk Monitor (dated October 30, 2026) for further details.
You may also like


