
EQUITY RISK MONITOR HIGHLIGHTS
WEEK ENDED MAY 15, 2026
- A Tale of Two Indices—Looking at the Russell 1000 and 2000
- I’m Sensing a Theme (in Japan)
On May 11th, strength in semiconductor and mega-cap names pushed the S&P 500 to new closing highs, but inflation concerns quickly reasserted themselves as CPI came in above expectation. Geopolitical tension around Iran and the Strait of Hormuz kept oil prices elevated, and by Friday, the rise in Treasury yields tightened financial conditions and weighed on broad risk appetite. In short, the week’s narrative shifted abruptly from growth enthusiasm to concern over inflation and interest rates.
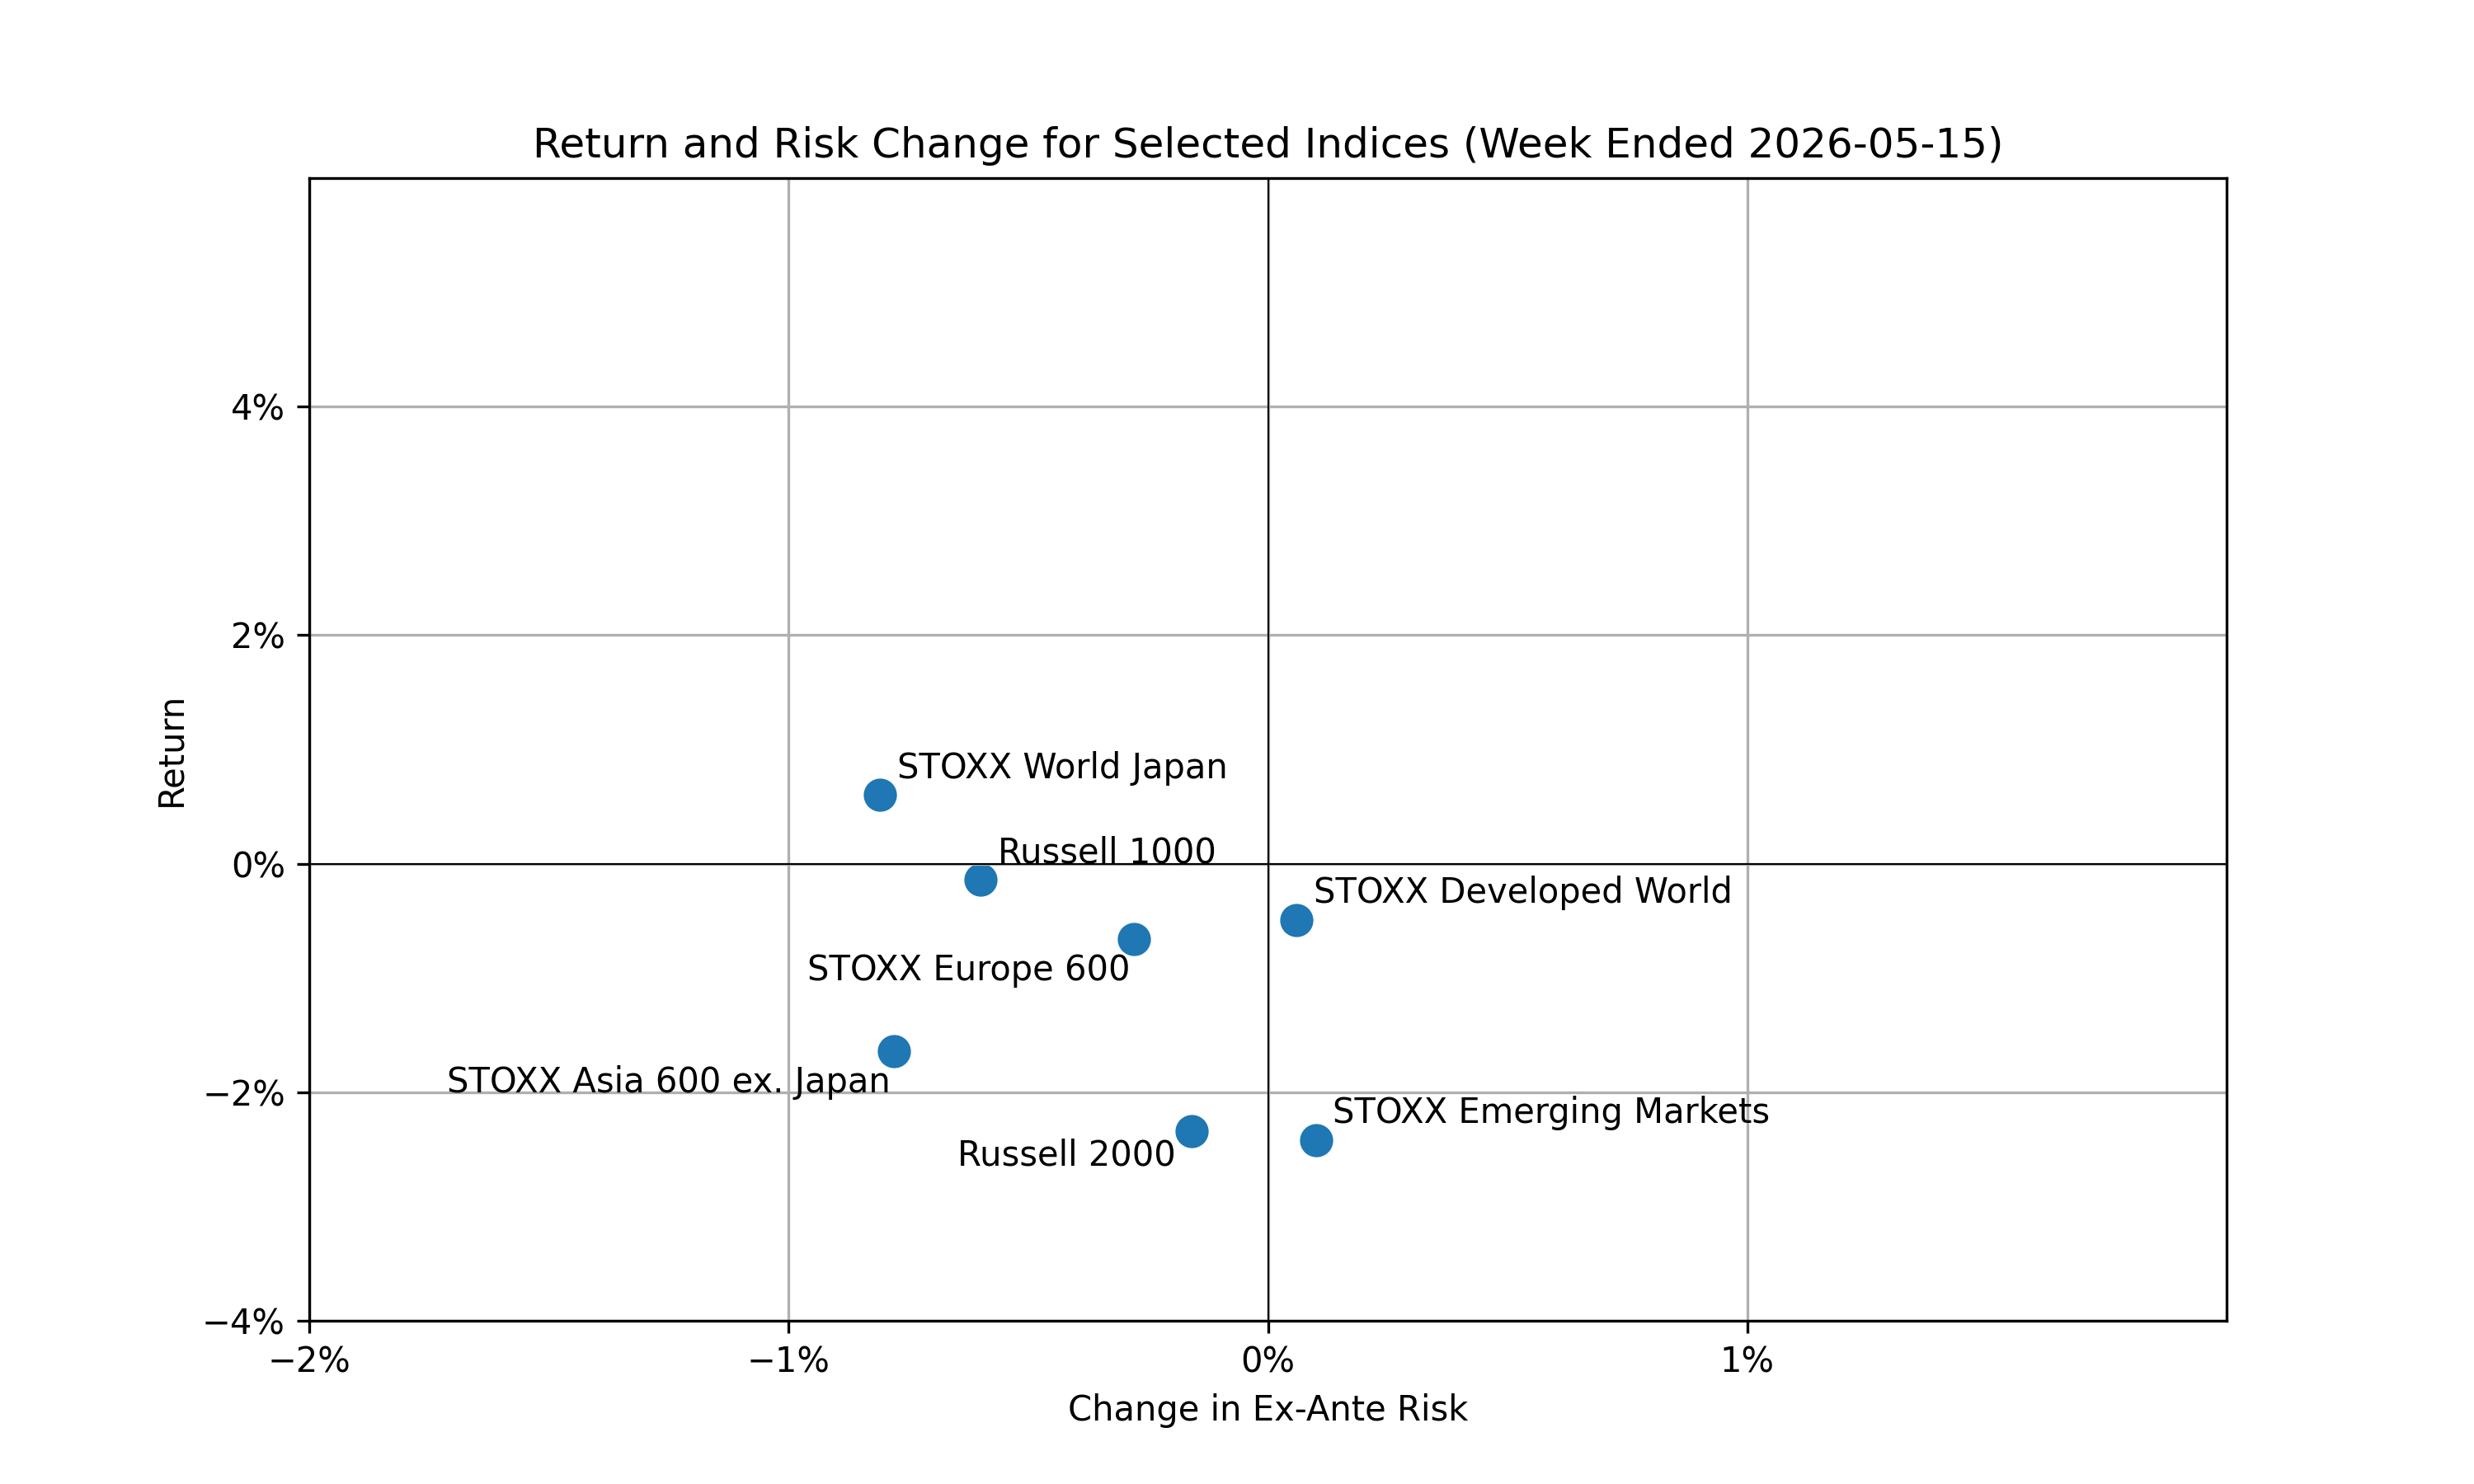
Among the indices we monitor, the divergence of the Russell 1000 and Russell 2000 caught our eye—the Russell 1000 returned -14bps while the Russell 2000 fell -2.34%. Outside the U.S., STOXX Japan was the best performer of the indices we track closely at +60bps. Performance elsewhere was weaker with the STOXX Asia ex. Japan 600 and STOXX Emerging Markets returning -1.64% and -2.42% respectively. Overall, 1-week returns point to a risk-off tilt despite decreasing to flat ex-ante risk as measured by our risk models.
The following chart is not included in the Equity Risk Monitors but is available on request:
A Tale of Two Indices
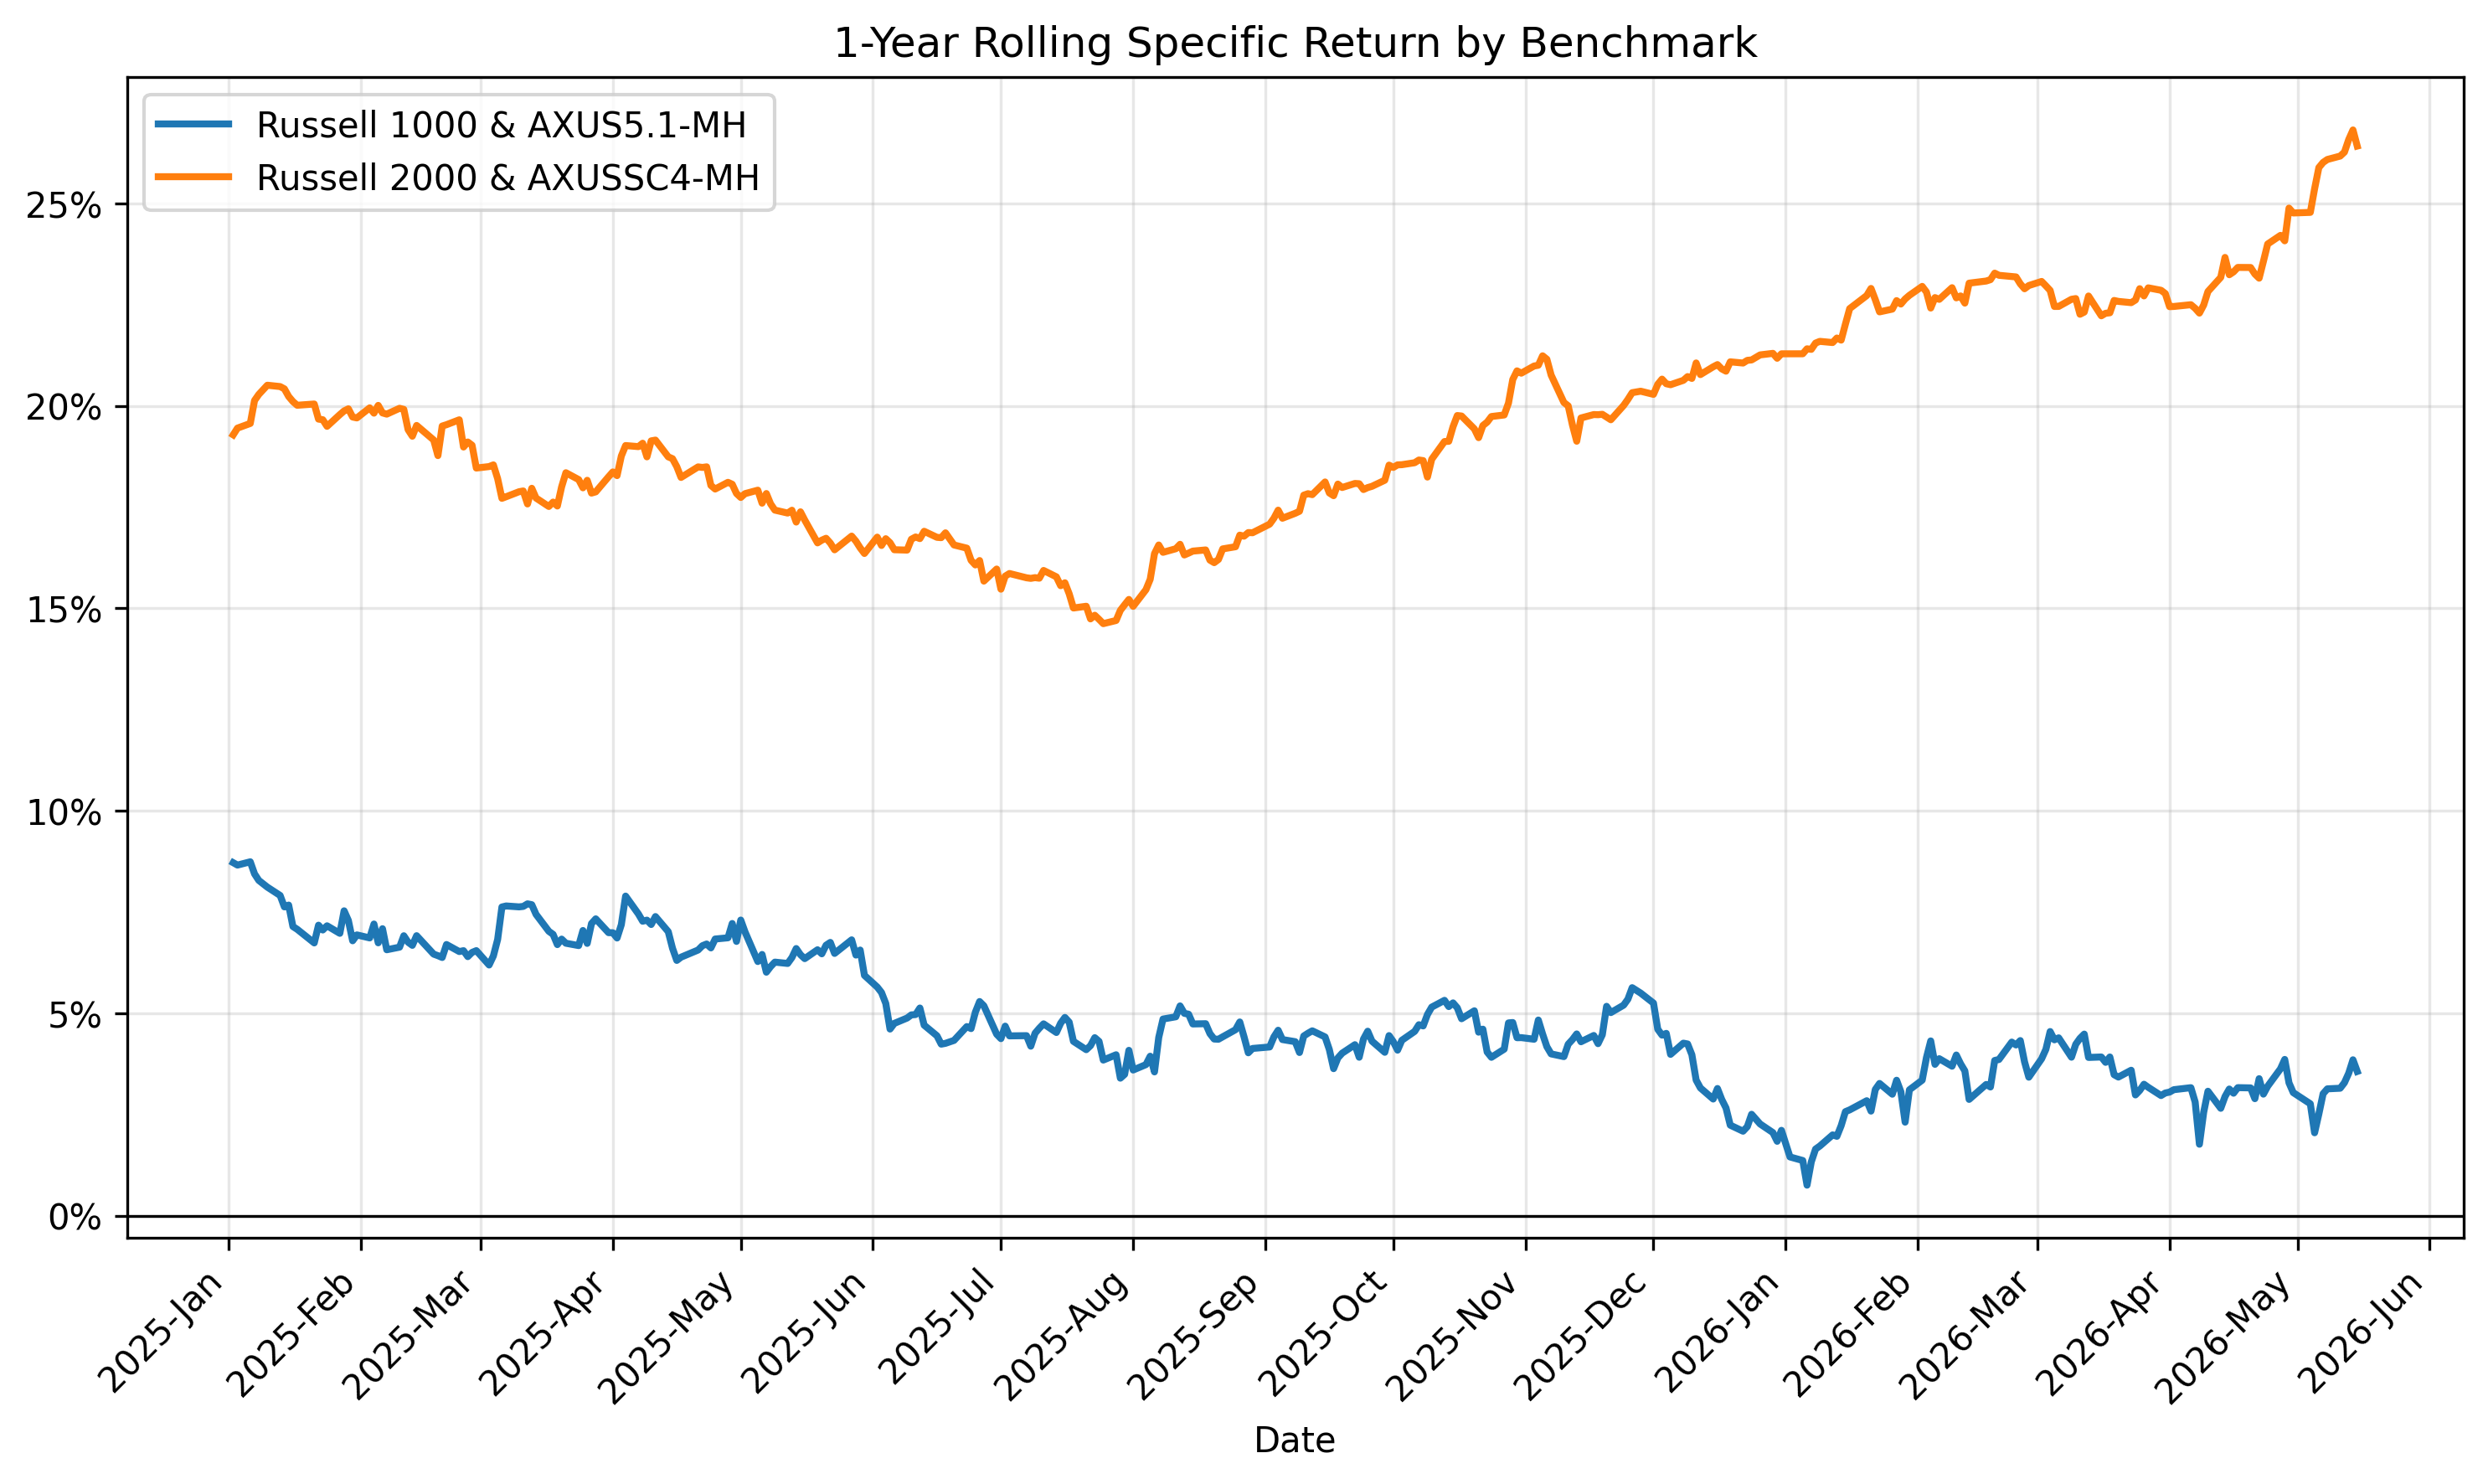
About a month ago, we wrote about style factors driving the Russell 2000’s returns. Since then, the trend has begun to reverse—the specific return of the Russell 2000 has increased while the Russell 1000’s specific return has decreased as measured by the AXUSSC4-MH and AXUS5.1-MH models respectively:
The following chart is not included in the Equity Risk Monitors but is available on request:
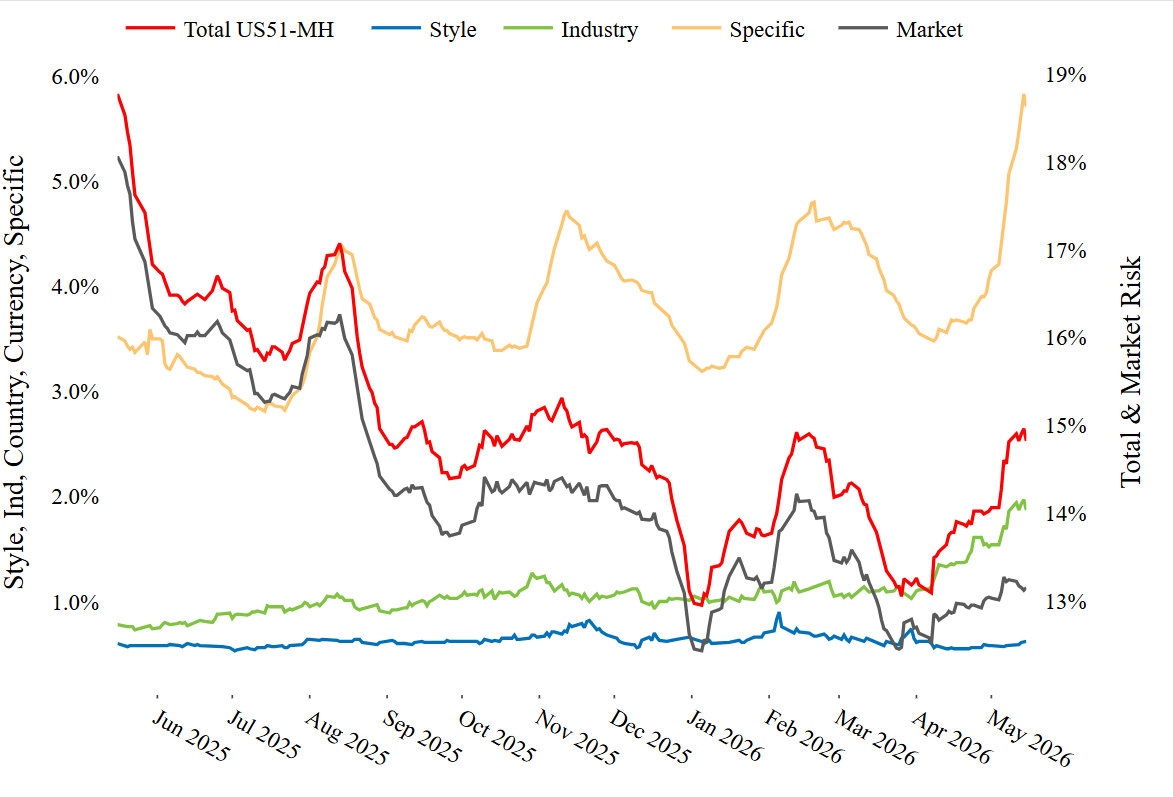
If we look at the ex-ante risk of these two benchmarks however, we see that the Russell 1000’s specific risk is dramatically increasing while the Russell 2000’s rise is much less steep. Additionally, the style risk of the Russell 1000 is nearly flat while the Russell 2000’s style risk is strongly increasing.
See chart from Russell 1000 – Axioma United States (AXUS5.1) Equity Risk Monitor as of May 15th, 2026
Russell 1000 - Components of Risk
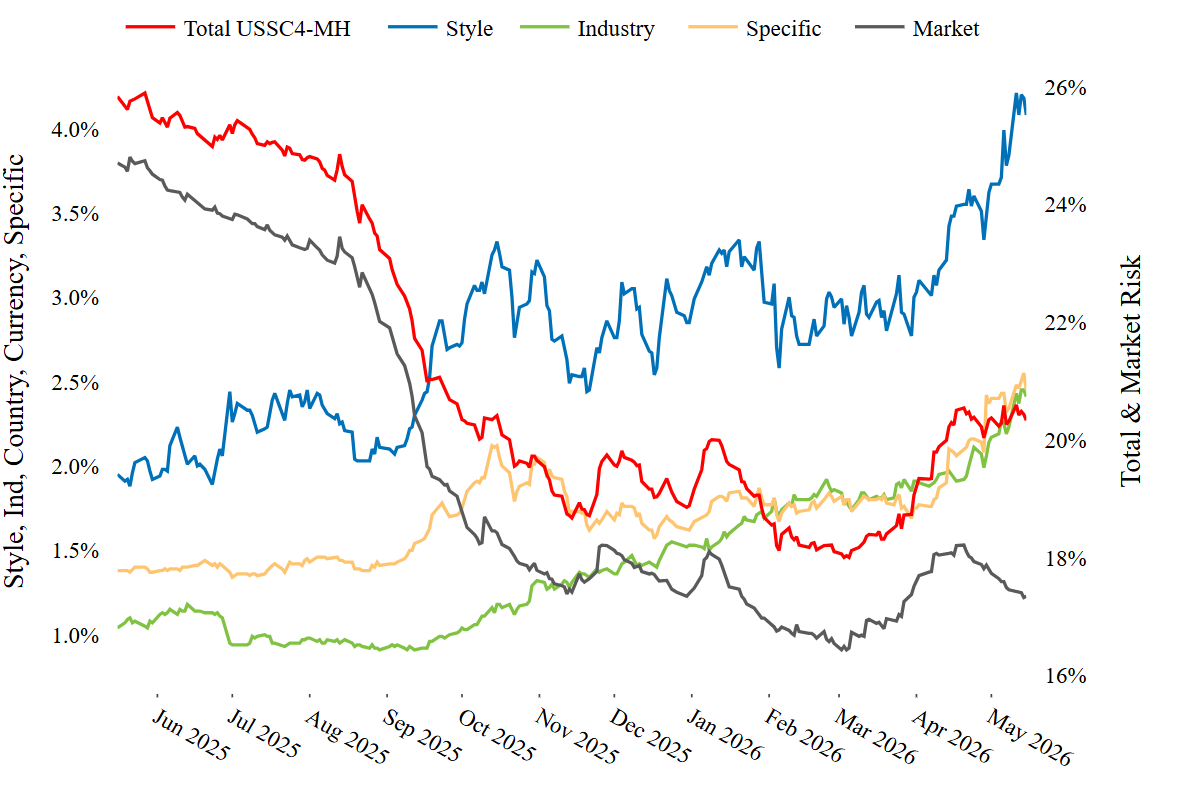
See chart from Russell 2000 – Axioma United States Small Cap (AXUSSC4) Equity Risk Monitor as of May 15th, 2026
Russell 2000 - Components of Risk
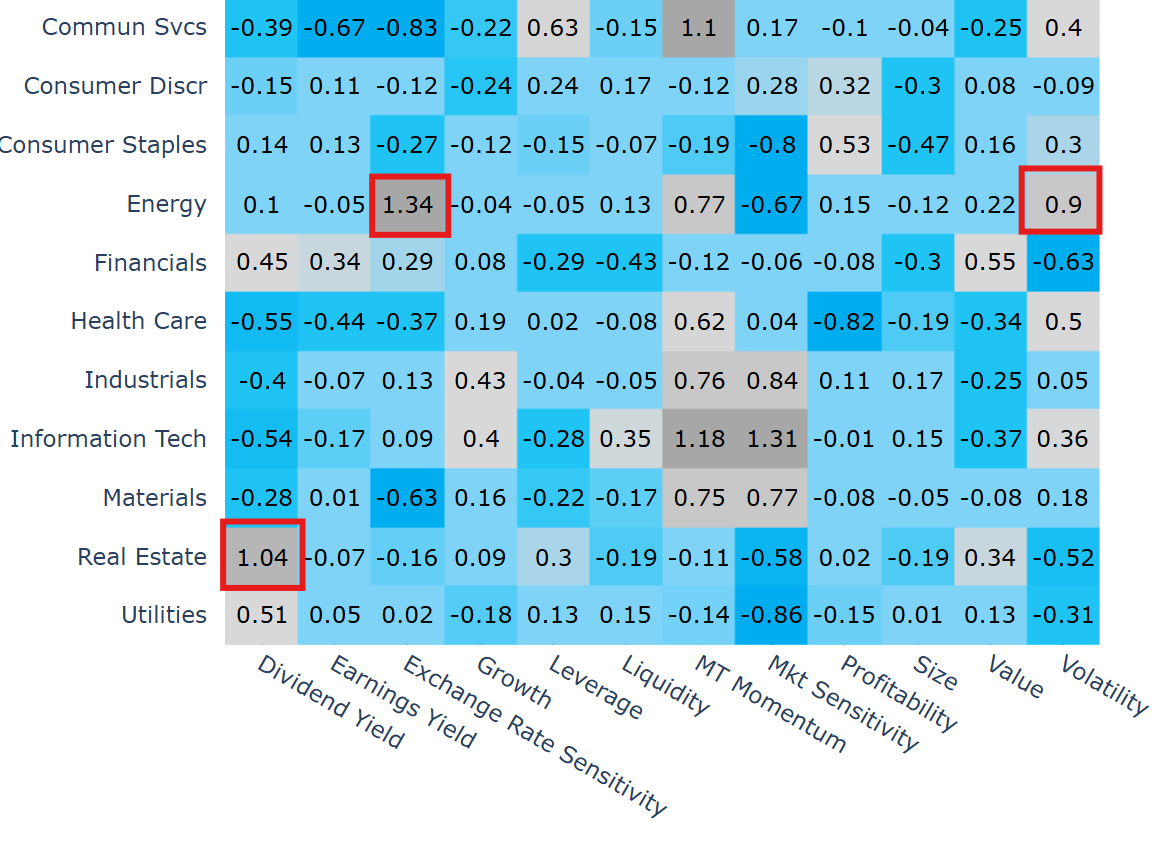
Why is this the case? Well, over the past month or so the Russell 2000 seems to be trading on oil prices, future inflation, and interest rate expectations, while the Russell 1000’s return is driven by excitement over massive technology firms’ AI initiatives. In the Russell 2000, the largest style factor exposures are in sectors sensitive to oil and interest rates, while in the Russell 1000, the largest exposures can be found in the Market Sensitivity factor.
See chart from Russell 2000 – Axioma United States Small Cap (AXUSSC4) Equity Risk Monitor as of May 15th, 2026
Russell 2000 - Sector Style Exposures
See chart from Russell 1000 – Axioma United States (AXUS5.1) Equity Risk Monitor as of May 15th, 2026
Russell 1000 Sector Style Exposures
Taken all together, the divergence between large cap and small cap due to themes not completely captured by the factors makes a good case for the use of multiple models—especially the fundamental and statistical risk models in tandem. We’ve written on the subject before here, and more recently, here for those interested in diving deeper.
I’m Sensing a Theme (in Japan)
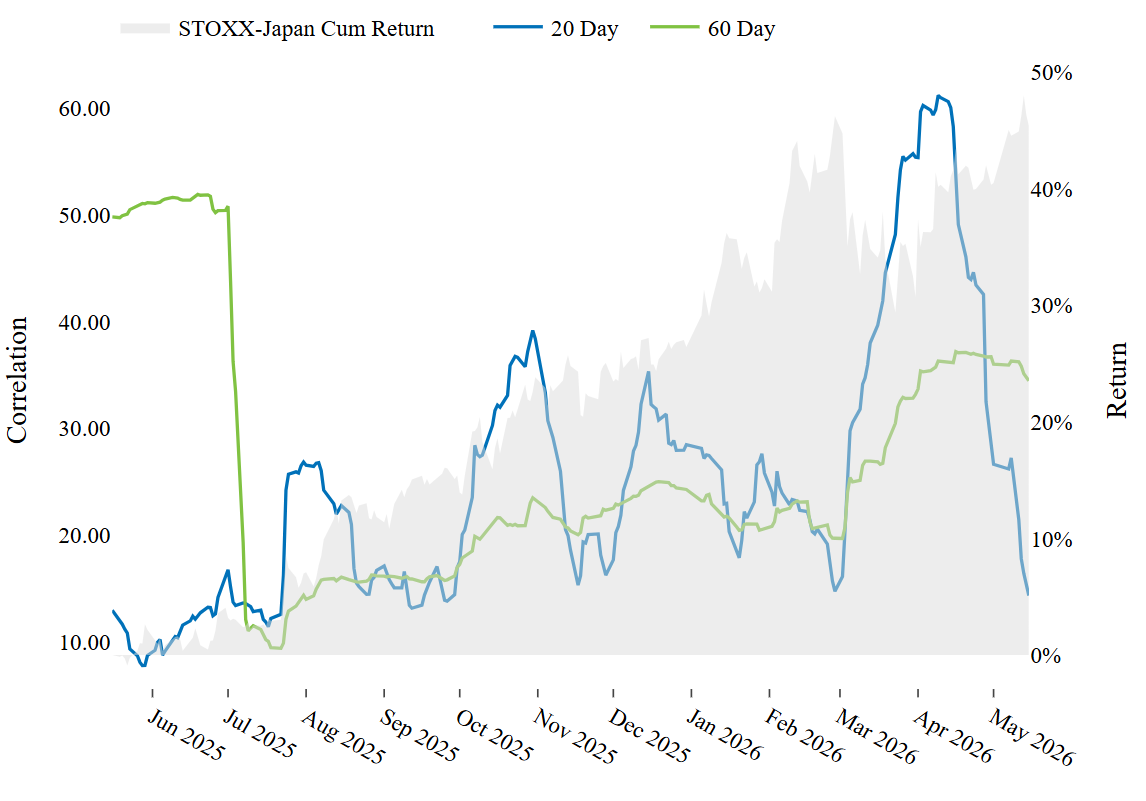
The best performing index among the indices we track was the STOXX Japan, which might seem curious given that we had previously written on how oil prices had added substantial risk to the country. The geopolitical shock had driven asset correlations up steeply, but over the last few weeks, the correlations have settled back to pre-shock levels:
See chart from STOXX Japan – Axioma Japan (AXJP4) Equity Risk Monitor as of May 15th, 2026
STOXX Japan – Rolling Average Asset Correlations
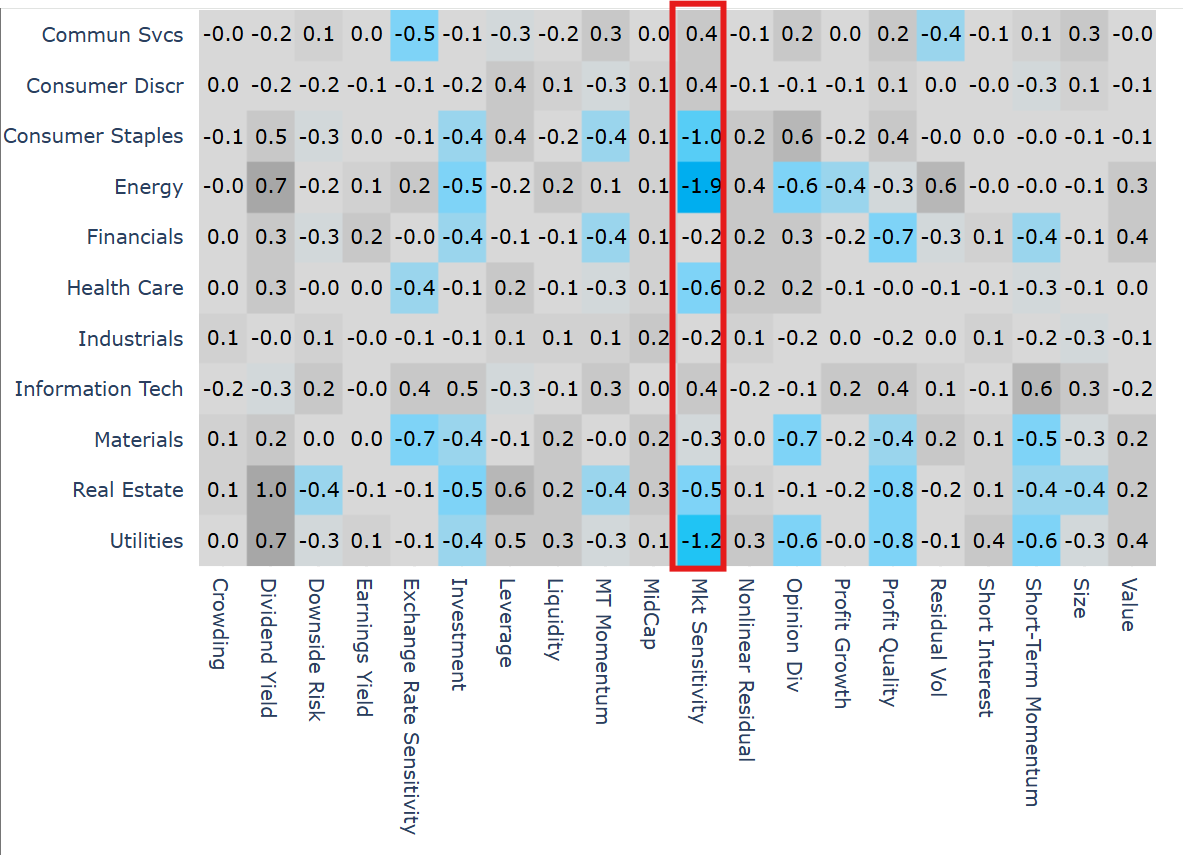
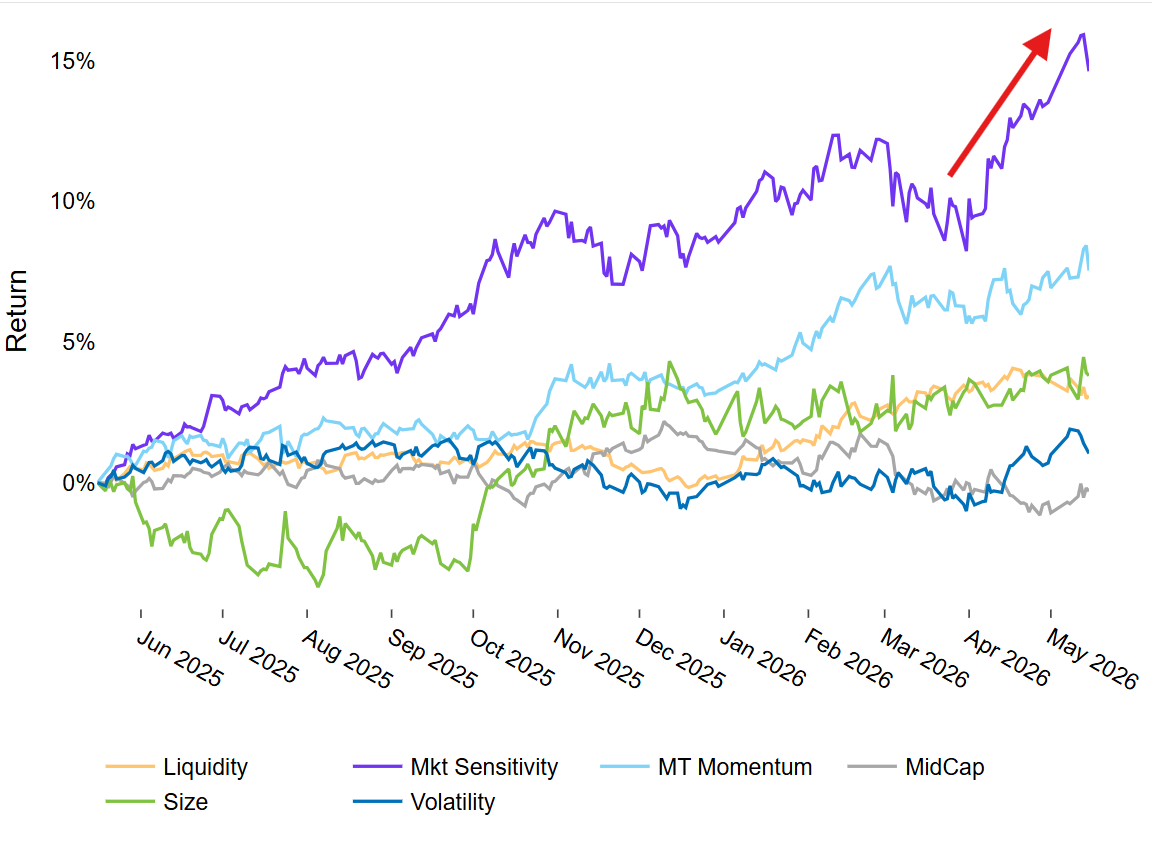
Interestingly, we see some similarities to the Russell 1000—increasing ex-ante residual risk and strong performance from Market Sensitivity.
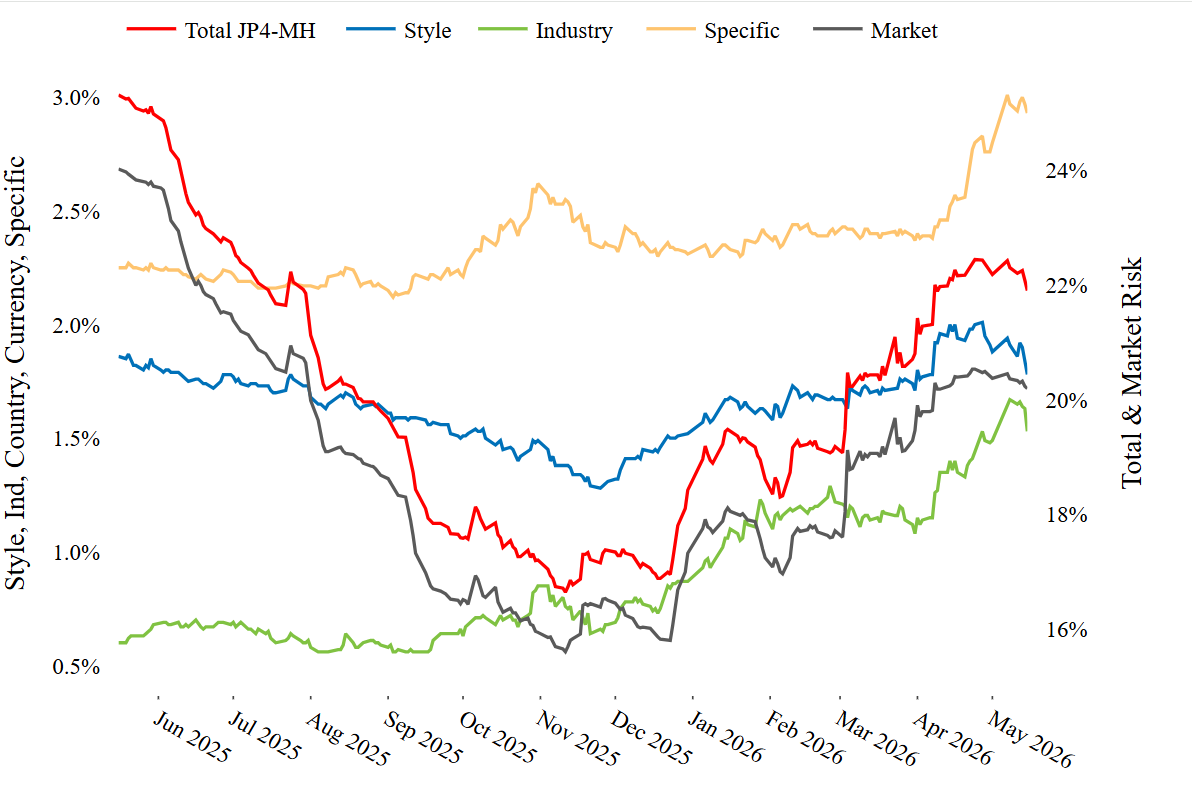
See chart from STOXX Japan – Axioma Japan (AXJP4) Equity Risk Monitor as of May 15th, 2026
STOXX Japan – Components of Risk
See chart from STOXX Japan – Axioma Japan (AXJP4) Equity Risk Monitor as of May 15th, 2026
STOXX Japan – Market-Based Style Factor Performance
See chart from STOXX Japan – Axioma Japan (AXJP4) Equity Risk Monitor as of May 15th, 2026
STOXX Japan – Industry Factor Volatility Range
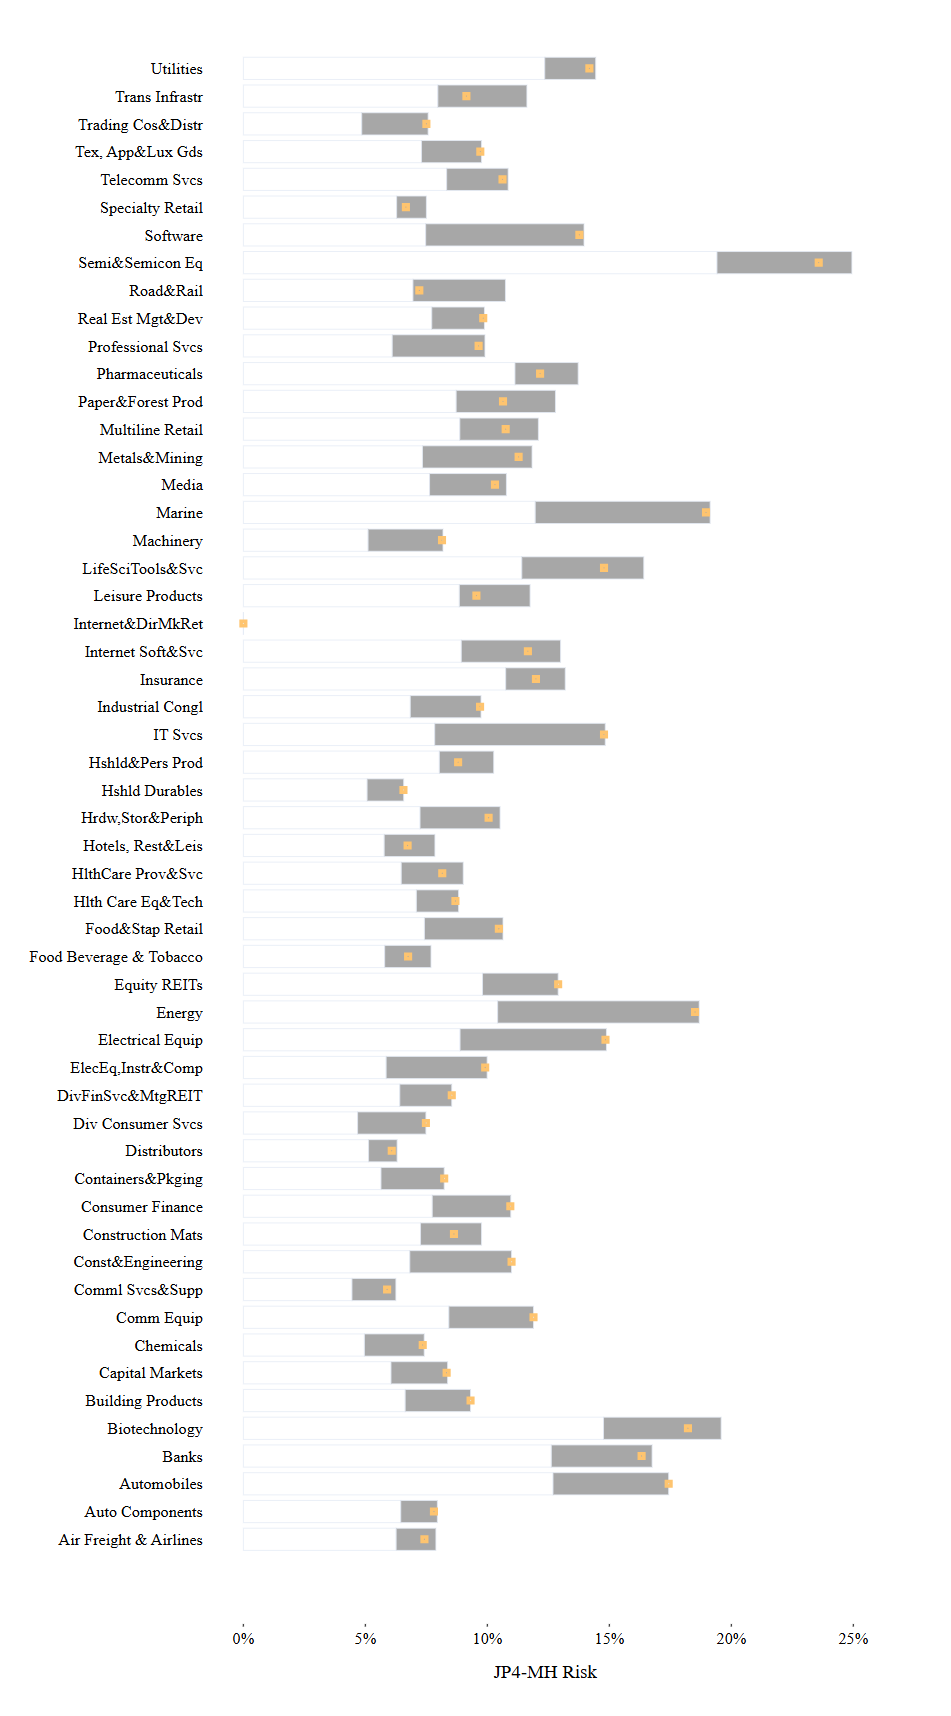
In the components of risk chart, industry risk has been steadily increasing as well since the end of last year. The industries with the highest overall risk are Semiconductors & Semiconductor Equipment, Marine, and Energy. Many industries are near their all-time high including Software and IT Services.
See chart from STOXX Japan – Axioma Japan (AXJP4) Equity Risk Monitor as of May 15th, 2026
STOXX Japan – Predicted Risk
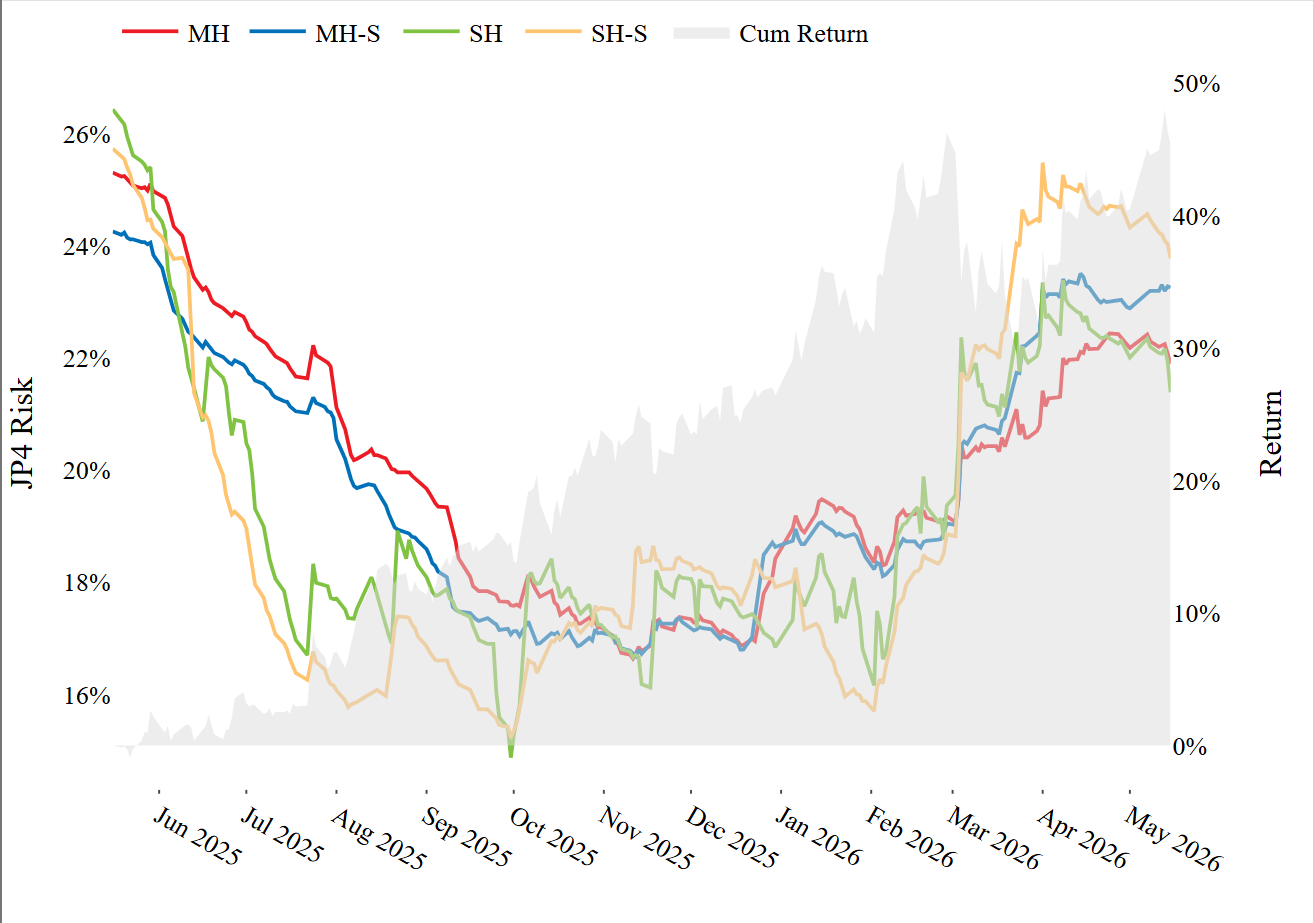
Last week we published an article showing an AI Theme portfolio that exhibited higher risk from the statistical model than the fundamental one, and that the delta between the two supported that existence of an AI theme orthogonal to the fundamental risk model factors. STOXX Japan as a whole has higher risk as measured by the Statistical model as well, implying that the drivers of volatility are not captured by stationary fundamental factors. At least at a high level, the Japanese market is starting to look more like the United States.
You may also like
.png%3Fh%3D810%26iar%3D0%26w%3D1080&w=3840&q=75)
.png%3Fh%3D810%26iar%3D0%26w%3D1080&w=3840&q=75)
