Portfolio Analytics & Reporting
Release 26.07

Investment Forecasting & Solvency – customer-focused enhancements
This enhancement area brings together several improvements that make Investment forecasting and Solvency II workflows more transparent, easier to validate, and better aligned with customer business processes.
First, improve transparency and simplify downstream calculations: Clean Value RC and Dirty Value RC are now available directly in Position Results, helping users avoid manual derivation from QC values and FX rates. In addition, the Yield Curve field shows which curve was used in the calculation, making results easier to understand and validate.
Secondly, build more realistic reinvestment target allocations: Business Classifications can be used directly in Middle Office Position Selection, enabling users to define target allocations based on business-relevant criteria that are commonly used when designing future portfolio structures.
In addition, review classifications earlier in the process: Business Classifications are also displayed in Position Results, so users can verify how classifications have been applied before using the results in further analysis or reporting.
Furthermore, assess instruments priced with a Yield Book under stressed market conditions: Users can apply yield curve shocks in Market Data Stress Tests and review the resulting shocked values, profit and loss, and sensitivities in Position Calculation and Asset Manager.
Finally, prepare for Solvency II 2027 requirements: The Concentration Risk formula supports the expected requirement to exclude selected securities with negative values from the Assets calculation, helping users align concentration calculations with upcoming regulatory expectations. To support this, a new Middle Office Position Selection field in the Middle Office Analytics Settings window enables users to specify the relevant portfolios and securities where negative dirty values should be excluded.
Subscription based licensing
Strategy Manager & various add-ons
Sales module dependency
Strategy Manager – Calculations, Strategy Manager - Market Data Stress Test, Strategy Manager - What-if and Horizon Analysis, Strategy Manager - Position Calculation API, Strategy Manager - Reinvestment component
![]()
Pre-trade compliance check on FX Forwards templates in the Asset Manager
Now you can enable currency risk to be calculated in the Asset Manager for FX forward templates. You can also perform pre-trade compliance checks based on risk analytics.
The calculation of sensitivities and risk positions for currency risk factors is the same as FX forward positions. For each leg of an FX forward template, SimCorp Dimension calculates QC (quotation currency), PC (portfolio currency) and RC (reporting currency) risk factor sensitivities and risk positions. Sensitivities are set to 1, and risk positions are based on the Dirty Value Total.
This functionality allows users to include simulated FX Forward template positions in pre-trade compliance checks, ensuring that currency risk is reflected correctly before trades are executed. This improves risk visibility, supports better investment decisions, and reduces the chance of breaching compliance limits.
Removed obsolete APT fields from the Risk Analysis Manager
Now the APT functionality is sunset and obsolete APT fields have been removed from Risk Analysis Manager. This functionality enables you to work with a cleaner Risk Analysis Manager setup and focus on relevant risk fields.
Interim cash positions included in the standard modelling Risk Measurements in MSCI RiskMetrics Interface
You can now configure Risk Measurement for the MSCI RiskMetrics interface to include interim cash positions, those without a model portfolio stamp, in standard modelling risk measurements.
Previously, cash held in interim cash buckets (for example, due to reconciliation or transaction corrections) was always excluded from risk calculations, these that are built on investment structure (node) reporting.
A new configuration setting allows you to assign a default model portfolio to cash positions. You can choose to either ignore the cash position (existing behaviour) or assign the default MP to the bank account or cash bucket. Cash positions are included at the total portfolio level rather than being distributed across the nodes of the investment structure.
The new configuration applies to modelling trees and all reporting settings in MSCI RiskMetrics tab. Internal Risk Measurement calculations are not affected. In the MSCI RiskMetrics calculation mode Risk Measurement holdings and generated position file include the cash position in the positions holding group, and the benchmark holding group includes recalculated amounts.
This enhancement improves the accuracy of risk measurements by ensuring interim cash is fully reflected, reducing unexplained discrepancies and providing a more complete view of portfolio risk.
Extended Instrument Coverage in MSCI RiskMetrics Interface
The General Sensitivity model can now also be applied to Alternative Investments and Fund Certificates as a secondary model. This extension broadens the scope of risk factor sensitivity calculations available for these instrument types within the standard RiskMetrics interface.
Subscription-based licensing
Corporate Actions Manager, TM Total Return Swap
Sales module dependency
Corporate Actions Manager, TM Total Return Swap
Browse the Release Portal
Release 26.01
Investment Forecasting & Solvency – various enhancements
We are excited to announce the release of two enhancements in version 26.01 aimed at improving your user forecasting experience:
- Flexible annual frequency
- You can now set up flexible end-of-year dates to calculate investment forecasting analytics using yearly frequency. This enhancement benefits investors or funds that do not follow a calendar year reporting period.
- When you set up Frequency as Yearly and specify dates in the From date and To date fields for a position calculation, then the investment forecasting analytics is calculated for each year for an analysis period of 12 months from the From date until the specified To date.
- This functionality enables you to prepare annual reports aligned with fiscal year to ensure consistency between portfolio performance and financial statements, and regulatory compliance for audits or investors disclosures.
- OAuth 2.0 authentication support for the Reinvestment service
- The Reinvestment service can now use the OAuth2.0 authentication when using the SimCorp Dimension Web APIs.
- This enhancement enables secure service-to-service communication without relying on an external authentication service. It leverages internal components such as Authentication service, API gateway service, and Application service API.
Please note: The migration to the new version of the Reinvestment service must be done in 26.01. Previous version is no longer supported.
Additionally, all our APIs (e.g., DatePositions, Simulations, etc.) are now available on the Web API 3.0. You can use these APIs to extract or import information from or into SimCorp Dimension, offering a modern alternative to traditional extract methods based on database tables.
All Strategy Manager users (e.g. Solvency II, Forecasting, ESG,etc.) can benefit from the enhanced transparency. Security Group codes are available in the Position Results. This allow you, for example, identify which credit adjustments are applied to a security, or group by security group codes during aggregation outside of position calculation.
Subscription based licensing
Strategy Manager & various add-ons
Sales module dependency
Strategy Manager – Calculations, Strategy Manager - Market Data Stress Test, Strategy Manager - What-if and Horizon Analysis, Strategy Manager - Position Calculation API, Strategy Manager - Reinvestment component
Internal risk module
Clean up risk measurement results for a reporting structure
It is possible to delete all risk measurement results for a specific reporting structure by using the Cleanup Risk Measurement Results window.
Two new fields - Reporting structure ID and Reporting structure name, are added to the Cleanup Risk Measurement Results window for this functionality. Using these fields, you can delete all risk measurement results for a specific reporting structure.
Benefits
- With this enhancement, you can decide what risk measurement calculation results should be deleted and what should be kept for further analysis.
Support for component segment for fund certificate in risk measurement
It is possible to filter the components of a fund certificate by using a segment for decomposition. To do this use the new Component segment field in the Decomposition settings section in the Risk Measurement window. This functionality applies to external and internal funds.
Benefits
- This enables you to have better control of components that you want to include in the risk measurement calculations.
Shocking of repo yield for preemptive using Repo yield + spot yield curve price method in risk calculations
It is possible to shock both the repo yield and spot curve by using the Repo yield + spot yield curve price method in risk measurement for preemptive. Previously, you could only shock spot yield curve. You can view the information about the shocked repo yield in the Explain price search dialog box in the Risk Measurement Results window.
Benefits
- Shocking both yield curves provides a more accurate and realistic measure of price sensitivity of preemtive, capturing interactions, correlations and stress-scenario risk.
Calculate risk analytics for negatively priced instruments
It is possible to calculate risk analytics for instruments that have negative prices, by using the new Allow negative price check box in the Risk Measurement window. Not-activated check box is default.
Benefits
- Using this functionality, you can calculate VaR for all risk models for various instrument types regardless of the price being negative or positive.
Generic Security model in the Axioma model and position integration.
It is possible to model Danish Mortgage Backed Securities and other securities as the LS-OTC-Generic Security Sensitivity model in the Axioma Risk solution as part of Axioma Model and Position integration. The input for this model is maintained in the new Generic Risk Factor Sensitivity window in SimCorp Dimension.
Benefits
- You can now cover the Danish Mortgage Backed Securities and potentially other instruments that are not supported by your preferred risk coverage, using the Generic Security model in the Axioma Risk solution.
- Data input and modelling parameters are configured in SimCorp Dimension, ensuring a simplified and consistent setup experience.
Price calibration in Axioma using SCD prices.
It is possible to send the prices to Axioma for calibration. In the Position integration flow, the new file with prices extracted from the Position Calculation results is added.
Benefits
- You can import prices for instruments from SimCorp Dimension into Axioma via dedicated Market data source, instead of using the Axioma provided prices.
- Data flow is orchestrated by the communication server logic and batch-driven processes, which reduce end-user involvement and operational risk.
Attributes in the Axioma position integration.
It is now possible to transfer SimCorp Dimension IBOR attributes to Axioma. Attributes are integrated via the Attribute Configuration in SCD and are delivered in three additional files at the Security, Portfolio, and Position levels.
Benefits
- Enables flexible grouping and sorting for analysis and reporting. This ensures consistency in risk and other analytics based on the SimCorp Dimension IBOR
- The data flow is fully orchestrated by batch-driven processes, reducing end-user involvement and operational risk.
Subscription based licensing
Risk Analysis Manager
Sales module dependency
Risk Reporting
Various risk model modules
Release 25.10
Axioma Stress test analytics in Compliance Manager
It is possible to run the pre-trade and post-trade compliance validation functionality for Axioma stress test values in the Compliance Manager. The definition of the stress test scenarios and calculation of the original and shocked unit prices and fx rates are performed in the Axioma application, while the scaling to position level is done inside SimCorp Dimension.
The required unitized stress test data from Axioma is stored in the following windows:
- Axioma Stress Test Analytics
- Axioma FX rates
- Axioma Stress Test FX rates
The calculated values for Axioma Stress Test P/L can be seen in the Asset Manager and in the Risk Analysis Manager.
Benefits
As a Portfolio Manager, you can ensure that the investments are made compliant and transparent in accordance with the limits set by you.
Select specific groups to calculate Modified VaR
You can select specific groups of Modified VaR to be calculated by using the new Analytic groups field in the Risk measurement.
- Select All to calculate all groups of Modified VaR.
- Select VaR to calculate only Modified VaR.
- Select Include IVaR to calculate Modified VaR and Incremental VaR.
- Select Include MVaR to calculate Modified VaR and Marginal VaR.
Benefits
With this enhancement, you can decrease the execution time for Modified VaR by selecting only analytic groups you are interested in.
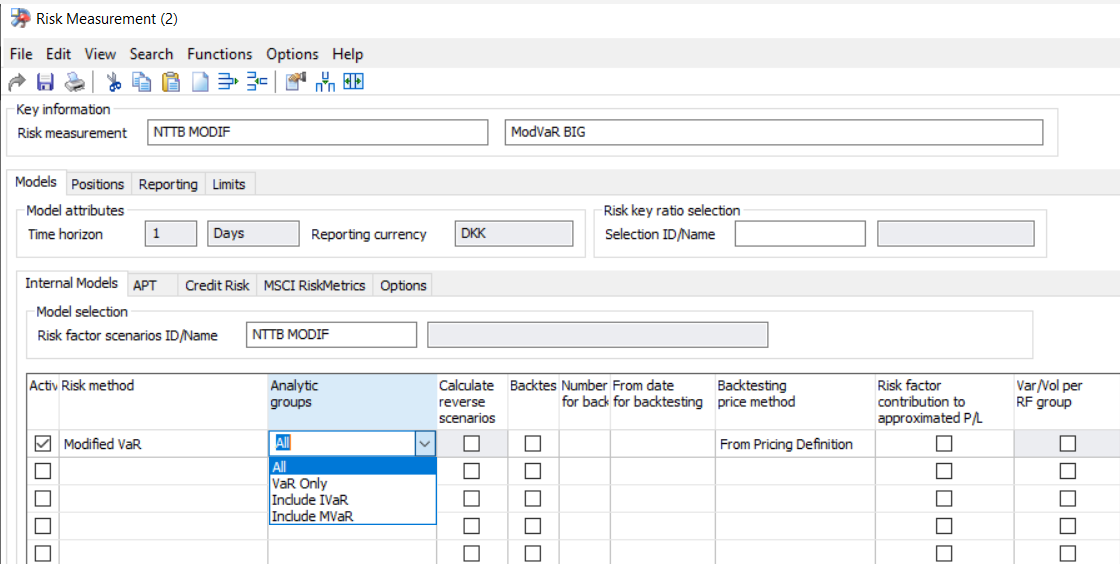
Caption: Analytic groups for Modified VaR
Subscription based licensing
Risk Analysis Manager
Sales module dependency
Risk Reporting
Various risk model modules
Investment Forecasting & Solvency – various enhancements
Pricing of extended fixed bonds by using fixed implied spread in investment forecasting
Now it is possible to use a fixed implied spread for pricing extended fixed bonds in Strategy Manager for Investment Forecasting.
When you select the Use fixed implied spread for extended bonds check box on the Execution label, SimCorp Dimension calculates implied spread for the first what-if transactions with extended bonds, based on the price defined in the what-if and the yield curve shocked by the Market Data Forecasts. This fixed spread is used for all future points in time when price calculations are required, for example, the fixed derived spread from the first transaction date is used to adjust all future prices. This setting is applicable only for extended bonds priced with Quoted price + yield curve price method.
Benefits
This functionality enables you avoid EOP adjustments at the date of simulated transaction and have prices calculated for the Position Calculation that is close to the price defined in the what-if.
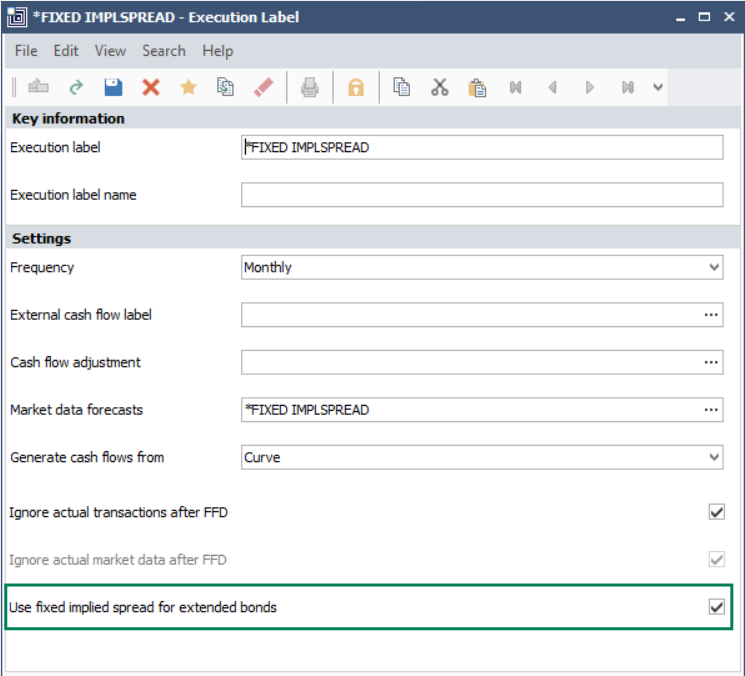
Caption: Use fixed implied spread for extended bonds checkmark
Subscription based licensing
Strategy Manager & various add-ons
Sales module dependency
Strategy Manager – Calculations
Strategy Manager - Market Data Stress Test
Strategy Manager - What-if and Horizon Analysis
Strategy Manager - Position Calculation API
Strategy Manager - Reinvestment component
Release 25.07 Portfolio Analytics & Reporting
Internal risk module
Axioma Stress test analytics in Asset Manager
It is possible to include Stress test analytics calculated by Axioma in your Asset Manager analytics view. The definition of the stress test scenarios and calculation of the original and shocked unit prices and FX rates are performed in the Axioma application, while the scaling to position level is done inside SimCorp Dimension.
The required unitized stress test data from Axioma is stored in the following windows:
- Axioma Stress Test Analytics
- Axioma FX rates
- Axioma Stress Test FX rates
The shocked scenario market values are calculated according to the following formula inside SimCorp Dimension:
AxR AxR Scenario value RC = AxR Shocked price × Balance nominal/number × Axioma stress test FX rate QC / RC, where the prices and FX rates are provided by Axioma and imported into SimCorp Dimension.
Benefits
- As a Portfolio Manager, you can easily access Axioma Stress test scenarios using SimCorp Dimension for analysis, storage, and reporting.
- A wide analytics list, which covers scenario market value and P/L calculated for the portfolio, model, benchmark, and relative holding scope.
- Data flow is orchestrated by the communication server logic and batch- driven processes, reducing end-user involvement and operational risk.
New risk method: Risk factor P/L Contribution in risk measurement
The new risk method provides detailed analytics on risk factor contributions to profit and loss measurement, making it possible to explain the reasons behind the changes in Theoretical P/L. It also includes contributions from Theta and unexplained artificial risk factor. The results can only be seen by using extraction tools.
Benefits
This functionality makes the resulting analytics available outside the risk measurement back-testing flow, offering standalone value by calculating metrics independently of Parametric or Modified VaR.
Split external fund components by IFRS 9 purpose
You can build the Reporting Structures that group holdings by different IFRS 9 purposes. Now such a dynamic split in the absolute tree structures is more flexible for the external funds. Previously, the split value came from the parent fund, but it is now possible to take the value from the components of the external fund. This is controlled by the Decomposition Profiles and Fund Decomposition Components configuration. The analysis of the risk analytics according to the new grouping value is available in the Risk Analysis Manager.
Benefits
With this enhancement, you can use a split on different IFRS 9 purposes in the risk analysis and reporting flow for all positions, including the decomposed fund holdings.
Subscription based licensing
Risk Analysis Manager
Sales module dependency
Risk Reporting
Various risk model modules
Strategy Manager
Enabled the calculation of decomposed book value with selected accounting balances in position calculation
It is now possible to calculate decomposed book value in scenarios where accounting balances are selected. Previously, decomposition was not supported when we had selected accounting balances, and decomposed book value was only calculated if Solvency 2 was checked in combination with activated reinvestment or flexible analytics services.
Benefits
As an investment or portfolio manager, you now have wider capabilities for building your investment strategies by analyzing calculated accounting analytics for decomposed components.
Subscription based licensing
Strategy Manager & various add-ons
Sales module dependency
Strategy Manager – Calculations
Strategy Manager - Market Data Stress Test
Strategy Manager - What-if and Horizon Analysis
Strategy Manager - Position Calculation API
Strategy Manager - Reinvestment component
Release 25.04 Portfolio Analytics & Reporting
![]()
FX hedging for Performance
Evaluating performance based on synthetically hedged returns is useful for several reasons.
FX hedging can be used to neutralize or manage the effects of currency fluctuations on an investment portfolio. If an investor holds assets in foreign currencies, exchange rate movements can significantly impact the portfolio’s return. By synthetically hedging currency exposure, you can better isolate the performance of the underlying asset and assess the manager’s performance after adjusting for currency risk. SimCorp’s synthetic FX hedge solution allows you to:
- Define currency benchmarks by specification of desired target exposures to currencies'
- Toggle synthetic hedging on/off for analytics in the InvestApp, where virtual FX forwards are made to neutralize currency exposures in both the portfolio and the benchmark
- Request Performance to be calculated hedged or unhedged for reports
Benefits
- Evaluate the performance of your investments in foreign markets on fully FX-hedged returns
- Evaluate the implementation of the actual FX hedge, compare it to the synthetic FX hedge, and analyze the result of potential currency bets.
- Break down active performance and create a full portfolio attribution report.
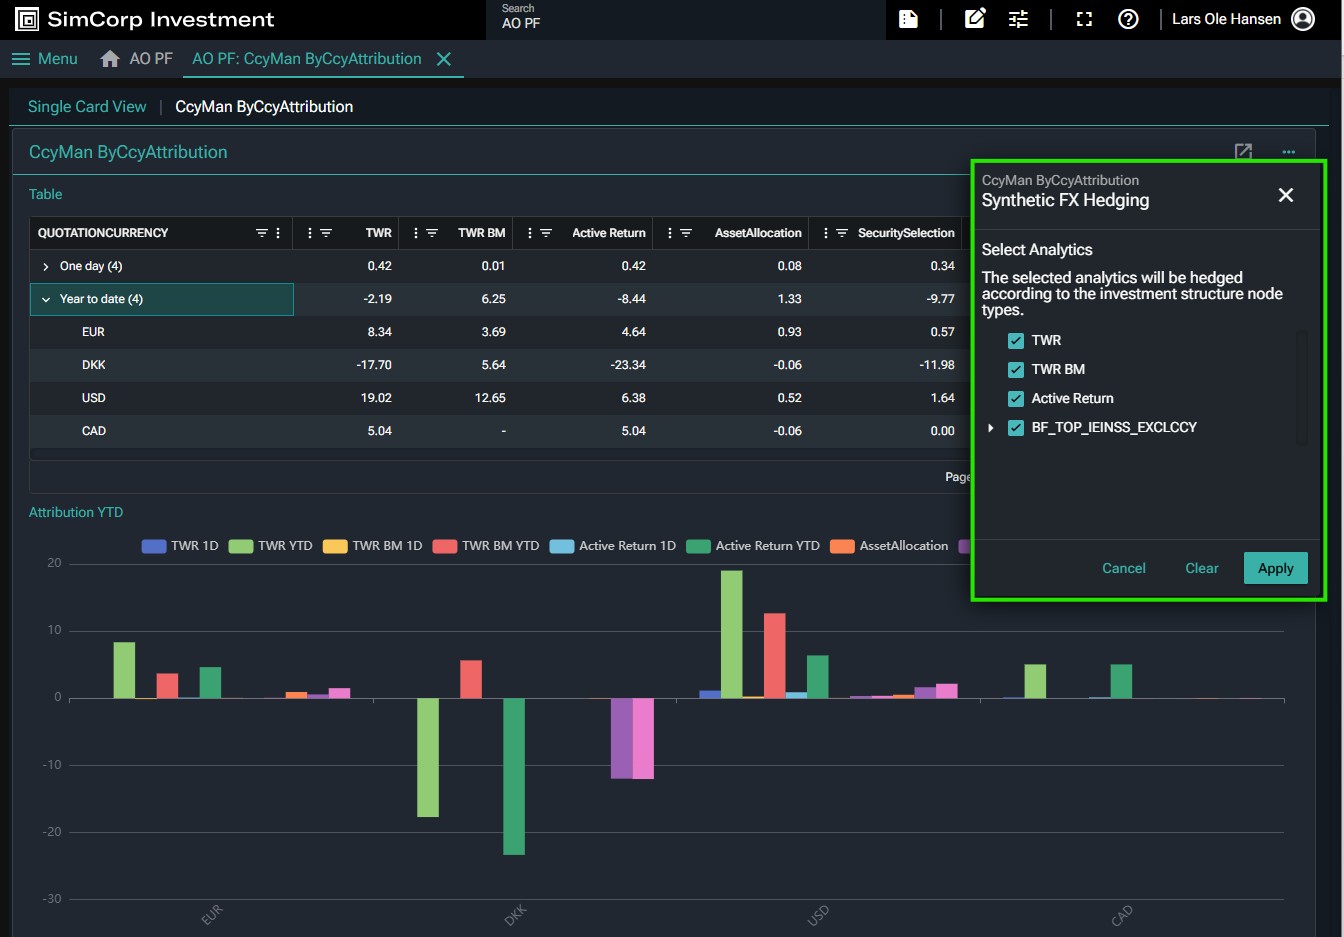
Portfolio managers can now choose to see Performance analytics as if their investments were 100% hedged, while currency managers can measure the effect of their currency hedging decisions.
Subscription based licensing
Investment Analytics Platform - Performance
Sales module dependency
Performance Book of Records
FX Hedging for Performance (new)
![]()
Stand-alone Risk & Performance offer with Axioma Risk+IAP Performance
With the seamless integration of Axioma to IAP-Performance, Axioma clients now have on-the fly performance and performance attribution available at their fingertips.
Upload your positions to Axioma Risk, leverage Axioma’s pricing, benchmark, and risk capabilities, and view performance results in the Investments frontend. Alternatively, generate performance insights by requesting performance results via the exposed APIs.
Benefits
- Get seamless access to performance insights as an Axioma Risk user.
- View performance figures in Investments frontend.
- Call the Performance APIs and integrate performance analytics into your ecosystem.
Subscription based licensing
Axioma Risk
Investment Analytics Platform - Performance
Sales module dependency
N/A
Decomposition of Funds in IAP Performance
Fund look-through makes it possible view the underlying holdings within a fund at a more granular level. This enables you can examine the composition of the fund and for instance get a better understanding of currency or sector exposures. Performance fund look-through will additionally enable you can transparently analyse performance and attribution and understand drivers of performance.
When investments include funds, Fund look-through enables fund instruments to be replaced by the set of constituents and their weights inside the fund. Fund constituents are prepared in SimCorp Dimension’s Generic Fund Decomposition module and synchronized to IAP Performance for on-demand utilization in reports and online analyses
Benefits
- As performance analyst, you are now able to toggle decomposition of funds in the InvestApp, whereby the market value of funds are replaced by that of the underlying constituents
- As a report developer, you can request Performance to be calculated and delivered for reports or DWH either with funds decomposed or not
InvestApp users can now switch on Decomposition of both Funds and Derivatives of the fly and fund constituents grouped in Performance based on the Generic Decomposition module of SimCorp Dimension.
Subscription based licensing
Alternatives Strategy Analysis
Sales module dependency
Alternative Investments Manager
Alternatives Strategy Analysis
Axioma Stress test analytics in Risk Analysis Manager
It is possible to include Stress test analytics calculated by Axioma into your Risk Analysis Manager analytics view. The definition of the stress test scenarios and the calculation of the original and shocked unit prices are performed in the Axioma application, while the scaling to position level and aggregation according to the reporting structure splits are done inside SimCorp Dimension.
The required unitized stress test data from Axioma is stored in the following windows:
- Axioma Stress Test Analytics
- Axioma FX rates
- Axioma Stress Test FX rates
The shocked scenario market values are calculated according to the following formula inside SimCorpDimension:
AxR AxR Scenario value RC = AxR Shocked price × Balance nominal/number ×Axioma stress test FX rate QC / RC,
where the prices and FX rates are provided by Axioma and imported into SimCorp Dimension.
It is possible to schedule regular clean-up of the old Axioma data that is no longer required for calculations. This can be done by using a dedicated batch job group called Cleanup Axioma Stress Test– Execute.
Benefits
- As a Risk Manager, you can easily access Axioma Stress test scenarios using SimCorp Dimension for analysis, storage,and reporting
- A wide analytics list, covering Scenario market value and P/L, is calculated for the portfolio, benchmark, and relative holding scope.
- Additionally, it is also possible to include Start scenarios, which are also based on Axioma prices and FX rates.
- Data flow is orchestrated by the communication server logic and batch-driven processes, reducing end-user involvement and operational risk.
New inflation risk factors for Latin American inflation bonds
The theoretical valuation of Latin American inflation index bonds is based on special inflation yield curves, and it can now be included in the risk valuation. A new risk factor class called “Inflation” has been introduced in the risk module to incorporate the risk associated with Mexican and Brazilian inflation curves into the Risk analytics calculation.
Benefits
This functionality enables accurate risk pricing and valuation by including inflation exposures into the VaR and Stress test calculations.
Disable currency risk in VaR analytics calculated in Asset Manager
It is possible to exclude the currency when calculating Parametric VaR and Ex-ante volatility analytics in Asset Manager. To disable currency risk calculation, select the Disable currency risk check box on the Parametric VaR/Ex-ante volatility tab of the Risk and Performance Analytics Configuration window.
When activating this functionality, the currency risk-related risk factors are excluded from the risk valuation. This setting is particularly useful when you want to analyze risk analytics, assuming the currency risk exposures are to be managed separately.
Another scenario where this option is particularly useful is when you want to use imported risk factor sensitivities from external sources. When Disable currency risk check box is activated, you can use imported risk factor sensitivities for the currency risk factors.
Benefits
- As a risk or portfolio manager, you can choose whether to include currency risk factors into the VaR/ETE calculations or exclude them to meet your analysis needs.
- This option enables the import of currency risk factor sensitivities from other sources (e.g. from Axioma) for use in Parametric VaR/Ex-Ante Volatility calculations within SimCorp Dimension.
Delete specific risk data
It is possible to do the database clean-up storing specific risk volatility and specific risk covariance information inside SimCorp Dimension. Since specific risk volatility and covariances are imported and stored at the security level on a daily basis, big data volumes accumulate quickly in the database. Therefore, it is possible and recommended to schedule regular deletion of the old data that is no longer required for calculations. This can be done by using a dedicated batch job called Cleanup Specific Risk Volatility and Covariance– Execute.
Benefits
- Ability to plan regular cleanup of redundant data, reducing storage costs.
- Reduce operation risk by using dedicated clean up job instead of the manual deletion
Subscription based licensing
Risk Analysis Manager
Sales module dependency
Risk Reporting
Various risk model modules
Investment Forecasting & Solvency – various enhancements
Period closure in the Position calculation
It is now possible to use the period closure functionality in the Position Calculation. The past period can be closed for the backdated transactions, similar to how it is handled elsewhere in the system when the Period closure framework is activated. In Position calculation, this is useful when reporting Solvency II and Accounting Balance Sheets.
Futures in What-if analysis
It is now possible to include futures in your holding change simulated scenarios, created in the Strategy Manager solution. You can buy or sell simulations into the futures that are not part of your portfolio by selecting them in the Extended Position Universe.
Benefits
As an investment or portfolio manager, you now have wider capabilities for building your investment strategies by simulating future instruments, helping identify potential risks and opportunities.
Subscription based licensing
Strategy Manager & various add-ons
Sales module dependency
Strategy Manager - Calculations
Strategy Manager - Market Data Stress Test
Strategy Manager - What-if and Horizon Analysis
Strategy Manager - Position Calculation API
Strategy Manager - Reinvestment component
Release 25.01 Portfolio Analytics & Reporting
Mandates and Investor onboarding
Easily create and manage various types of business entities built from portfolios and model portfolios. Once created, Investment Mandates, Distributed Mandates, and Products can be used across domains such as Performance, Compliance, and ESG
Benefits
Investment Mandates allow operations teams to manage a variety of business entities independently of back-office Portfolios for different use cases, such as:
- Flexible grouping of Portfolios to reflect responsibility over time
- Assign unlimited number of benchmarks to the entity
- Manage lifecycle dates on Investment Mandates
- Use as scope for IAP Performance
- Define compliance rules against the Investment Mandate
- Calculate and report Performance on Entity levels
- Use as central scope selection in Portfolio Analysis and next-generation Web Apps

Defining an Investment Mandate from a set of Portfolios in SimCorp Dimension

Assigning multiple purpose specific benchmarks to an Investment Mandate

Using Investment Mandates as scope for a Performance analysis in the InvestApp
Subscription based licensing
Mandates and Investment onboarding
Sales module dependency
IBOR Manager
![]()
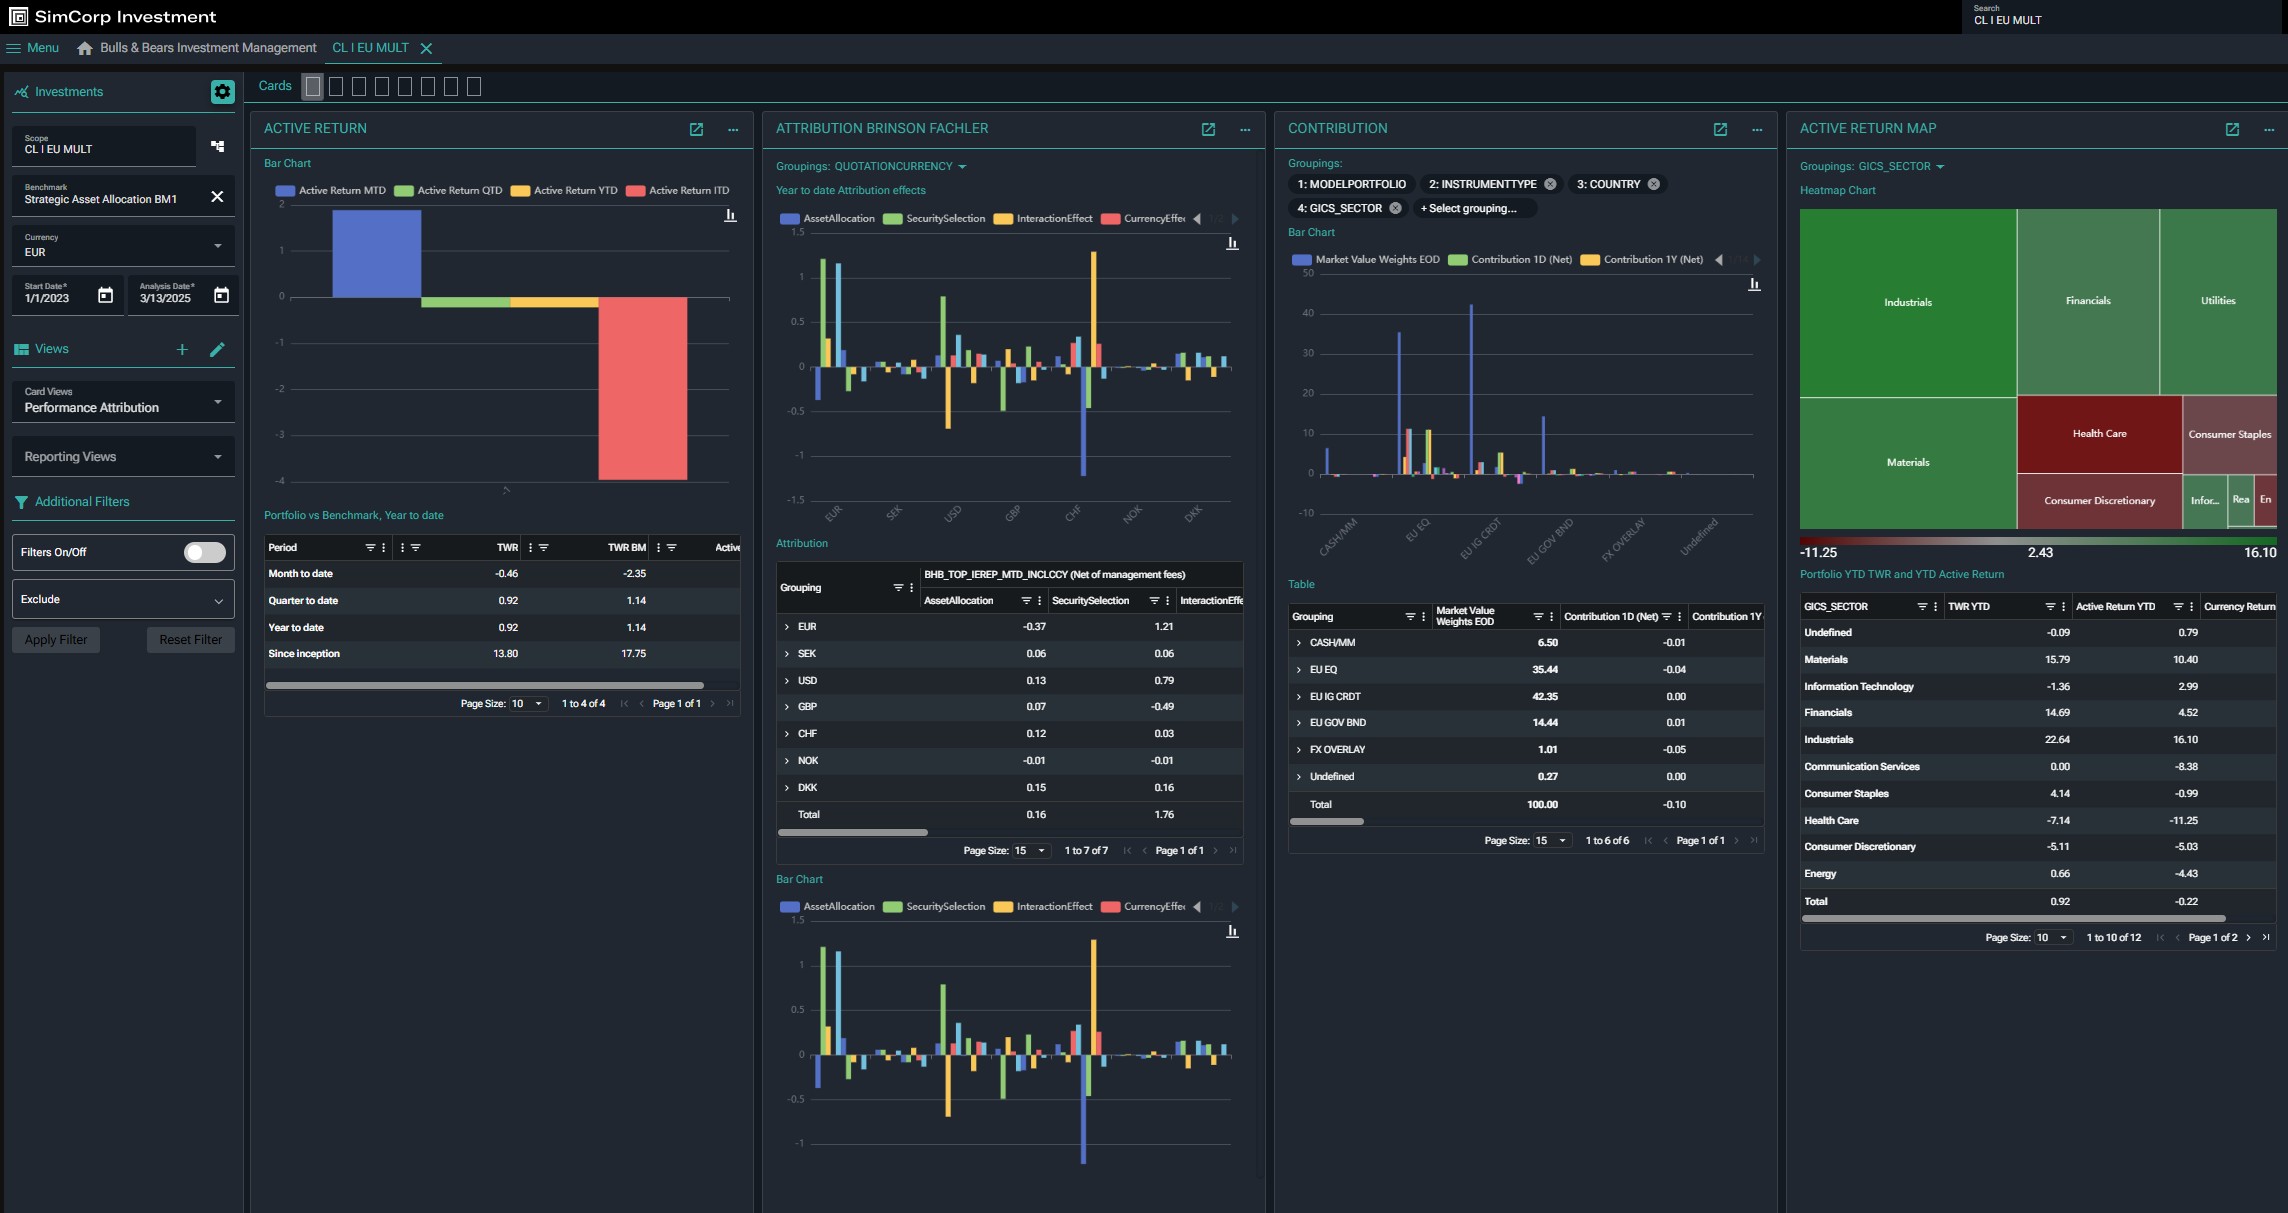
Multi-level groupings and drill-down
Performance Analysts can now create drill-down views on Performance, Contribution, and Attribution while also having the flexibility to dynamically switch grouping hierarchies and add more groupings to the view.
Benefits
- As performance controller, you are now able create content cards with pre-defined grouping hierarchies based on available attributes from SimCorp Dimension
- As a performance analyst, you can use the content cards and change grouping order on the fly
- Scoping of portfolio, benchmark, and Investment Structure node is used to define the top of the hierarchy
Drill-down to any level and dynamically switch hierarchy

Performance contribution and attribution using a dynamic drill-down hierarchy
Subscription based licensing
Investment Analytics Platform - Performance
Sales module dependency
Performance Book of Records
Money Weighted Returns and average market values
We continue to add more performance analytics within the Investment Analytics Platform. While largely independent of SimCorp Dimension versions, here are the newly added analytics from this three-month development cycle.
The new analytics are:
- Internal rate of return for portfolio and benchmark
- Money-Weighted Return variant: Modified Dietz
- Average Market Value and Cashflow over a period
Benefits
- For some investment managers, especially in the North American market, Money-Weighted returns are considered best practice when reporting to clients and stakeholders.

IRR and MD available as new analytics in the InvestApp

Subscription based licensing
Investment Analytics Platform - Performance
Sales module dependency
Performance Book of Records
View Performance according to Investment Structure
View and report performance according to an investment structure to gain insights into active returns from investment decisions. Using the InvestApp on the Investment Analytics Platform is now possible, as well as creating downstream data warehouse and reporting flows using the investment structures. Returns can be compared to any benchmark, either SAAM, blended index, or market index selected on the fly
Benefits
- As performance analyst, you can now see performance broken down by nodes in a selected investment structure
- Compare portfolio returns against any benchmark on the fly
- Select a node in an investment structure as your basis and apply other dynamic groupings from there
Reporting performance according to an investment structure
Subscription based licensing
Investment Analytics Platform - Performance
Sales module dependency
Performance Book of Records - Integrated Investment Processing
Compare Portfolio vs. Portfolio and Benchmark vs Benchmark
Additional flexibility has been added to IAP Performance so users can now compare any scope to any benchmark. Available scopes are Portfolios, SAAM benchmarks of any portfolio, blended indices, or market indices.
Benefits
- As performance analyst, you are now able see Performance for Portfolio vs Portfolio as well as compare any index or benchmark against another
- Flexibility in scoping and benchmarking through the InvestApp and Performance APIs

Compare one SAA benchmark to another SAA benchmark for a Portfolio
Subscription based licensing
Investment Analytics Platform - Performance
Sales module dependency
Performance Book of Records - Integrated Investment Processing
Decomposition of Derivatives
Market value-based performance, i.e. TWR calculated as PnL over Market value, will lead to extreme returns for derivative instruments where market values fluctuate around 0. This is an issue for instrument-level performance and detailed performance. For TWR contributions and total portfolio level returns, market value-based performance will provide meaningful results.
To provide for a better instrument-level performance for derivatives, decomposition of derivatives is introduced. The solution splits derivative positions into fictitious spot and cash positions, keeping the aggregated performance unaffected. The solution allows users to calculate exposure-based performance for the spot position and manage the gearing from taking on extra exposure via the fictitious cash position.
Benefits
- As performance analyst, you can now toggle decomposition of derivates in the InvestApp, whereby the market value of the relevant derivatives is split into a spot and a cash leg with different attributes as described above.
- As a report developer, you can request performance to be calculated and delivered for reports or data warehouse, either with derivatives decomposed or not
- Spot and cash legs are assigned model portfolio and security properties based on the Exposure Distribution Scheme assigned to the Data Source Definition for the Investment Analytics Platform.

InvestApp users can not switch on Decomposition of Derivatives of the fly and have spot/cash legs grouped in Performance based on the Exposure Distribution Scheme of SimCorp Dimension
Subscription based licensing
Investment Analytics Platform - Performance
Sales module dependency
Performance Book of Records - Decomposition of Derivatives
Internal risk module
In the Risk module, several enhancements have been made to improve usage of imported risk factor sensitivities from external sources in the SimCorp Dimension Risk analytics calculation:
- The risk positions for Parametric VaR and Ex-Ante Volatility calculated using imported sensitivities are now scaled using exposure value for the following instrument types: futures, forwards, options, OTC options, warrants, CFD, and covered warrants. The exposure accounts for underlying price, delta, and balance nominal/number, and gives better insights into the risk valuation for those instruments compared to previously used Dirty Value Total scaling. Those changes are available from 24.10 SimCorp Dimension version.
- FINCAD credit derivatives price method can now be used alongside externally calculated sensitivities for the Credit Default Swaps and CDS options.
- Disable currency risk option has been introduced in the Risk Measurement calculation for Parametric VaR and Ex-Ante Volatility models. This functionality enables you to make the choice if you want to calculate currency risk sensitivities using SimCorp Dimension logic or import them from external sources. This can be also useful when you want to exclude currency related risk factors from the calculation completely and analyse risk analytics without currency risk exposures.
“Lowest price to call” maturity convention in the risk calculation.
As of version 25.01, you can ensure consistent effective maturity data calculations in the basic analytics and risk simulated scenarios for FRN and MIT callable bonds with the following price methods: - Theoretical price
- Quoted price + yield curve.
To use this enhancement, you can apply new “Lowest price to call” maturity convention to indicate when to calculate maturity. To ensure a consistent approach for determining the optimal call date in a base scenario and a scenario with market data shifts, this new maturity convention minimizes the NPV for both scenarios.
SimCorp Dimension estimates the optimal call date for the issuer:
- In base scenarios, by finding the lowest adjustment spread to minimise the NPV
- In scenarios with market data shifts, by considering the adjustment spread from the base scenario.
The simulated scenarios with the market data shifts are used in Simulated VaR, and the Stress Test scenarios and the calculated analytics can be analyzed in the Risk Analysis Manager.
New convention can also be used in the Market Data Stress Test available in the Strategy Manager solutions and Market Data Scenarios calculated in the Portfolio Calculation.
Previously, SimCorp Dimension used the different methods with the “yield-to-worse” maturity convention for estimating the optimal call date for the issuer:
- In base scenarios, SimCorp Dimension estimated the optimal call date for the issuer thereby minimizing the yield.
- In scenarios with market data shifts, SimCorp Dimension re-estimated the optimal call date for the issuer minimizing the NPV in the simulated scenarios. Alternatively, the optimal call date determined in the base scenario may remain unchanged.
Minimizing both yield and NPV can lead to significantly different exercise dates in the base scenario, resulting in different adjustment spreads. As a result, you can see significant jumps in the maturity date and NPV, even with small market data shifts, which can affect risk calculations. If the optimal call date in shifted market data environments remains unchanged, there could be a significant underestimation of risks, as it would fail to capture potential increases in expected maturity for long bond positions in the event of rising credit spreads. The aim of the new “lowest price to call” maturity convention is to minimise the NPV for both scenarios, ensuring a consistent approach for determining the optimal call date.
Subscription based licensing
Risk Analysis Manager
Sales module dependency
Risk Reporting
Various risk model modules
Hedge Accounting
The new enhancement improves calculation of the of the hedge effectiveness and related EOP transactions under BilMoG regulation. We have improved the handling of the combination of low/negative interests in the past (at hedge-inception) and significantly higher interest rates today.
Specifically, we have improved the handling of the specific case, where there were no fixings in the descriptive data of the instrument between the issue date and the first coupon. In this case, the reference rate (used for the calculation of clean price, excluding pull-to-par (CV (ct,y0,s0,ro ) for the floating legs of swaps and floating-rate bonds) will now be calculated based on the the forward rate from the yield curve.
Additionally, the rate used for this calculation can be viewed in the reference rate field, excluding pull-to –par, in the Hedge Effectiveness Monitor window and in the dedicated database tables.
Subscription based licensing
Hedge Accounting
Sales module dependency
No dependencies
Release 24.10 Portfolio Analytics & Reporting
Stress scenarios for illiquid alternative funds
The two new enhancements are aimed at improving the user experience in forecasting and data management efficiency.
-
Automatic deletion of external cash flow. We've introduced a simple tool that allows you to delete external cash flows directly in the External Cash Flows window. This prevents unnecessary market data from cluttering the database during forecasting exercises. Now, you can clean it up immediately in the same window where it's entered, without needing a batch job.

Automatic deletion of external cash flow
- Extended Position Universe - enhanced functionality for holding splits. We've enhanced the Extended Position Universe window to give you more flexibility when managing securities. You can now create multiple rows for the same Security ID and Portfolio ID combination with distinct holding split values. This functionality goes beyond the previous version, which only allowed multiple rows for specific attributes such as Model Portfolio, Purpose, Special Holding Mark, Transaction Free Codes 1-4, Counterparty, Reserve Mark, and Maturity Date (Drown Bonds).
Subscription based licensing
Strategy Manager & various add-ons
Sales module dependency
Strategy Manager – Calculations, Strategy Manager - Market Data Stress Test, Strategy Manager - What-if and Horizon Analysis, Strategy Manager - Position Calculation API, Strategy Manager - Reinvestment component
Add-on - Hedge Accounting
The new enhancement improves the calculation of the hedge effectiveness and related EOP-transaction under BilMoG regulation. We have improved handling of the low/negative interests in the past (at hedge-inception) and significantly higher interest rates as of today.
Specifically, when calculating Clean price, excluding Pull-to-par (CV (ct,y0,s0,ro ) for the floating legs of swaps and floating rate bonds, you can now do this without including the reference rates after hedge inceptions. This allows for more accurate hedge effectiveness calculations and EOPadjustments by excluding the effects of floating rates post-hedge inception.
The hedge effectiveness, by using Dollar-offset retrospective (constant spread and curve) method, is calculated as:

Clean price, excluding Pull-to-par, CV (ct,y0,s0,ro ) is the clean value of a specific hedge i or hedged item e in portfolio currency on the reporting date with a constant spread, excluding pull-to-par effect and fixings after the reporting date of the hedge. It is based on cash flows from the reporting date, along with curves and spreads from the reporting date.
Subscription based licensing
Hedge Accounting
Sales module dependency
No dependencies.
Release 24.07 Portfolio Analytics & Reporting
Investment Forecasting & Solvency – various enhancements
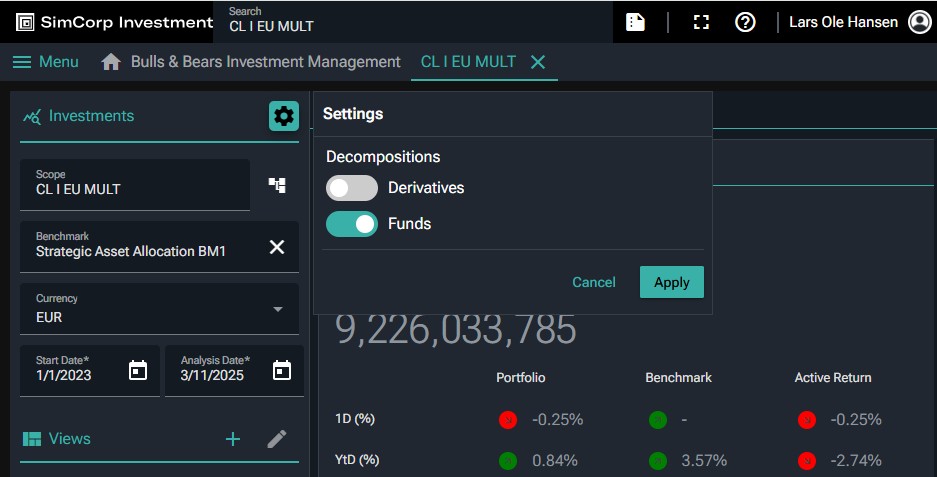
You can now calculate Solvency II Pillar 1, ORSA, ESG and forecasting figures for the components of the index. To be precise, you can decompose index contracts by using the Decomposition Profile window. This functionality enables you to decompose an index contract by executing a Position Calculation Definition setup with Decomposition type set to Index contracts.
The following instruments are supported in decomposition of index contracts:
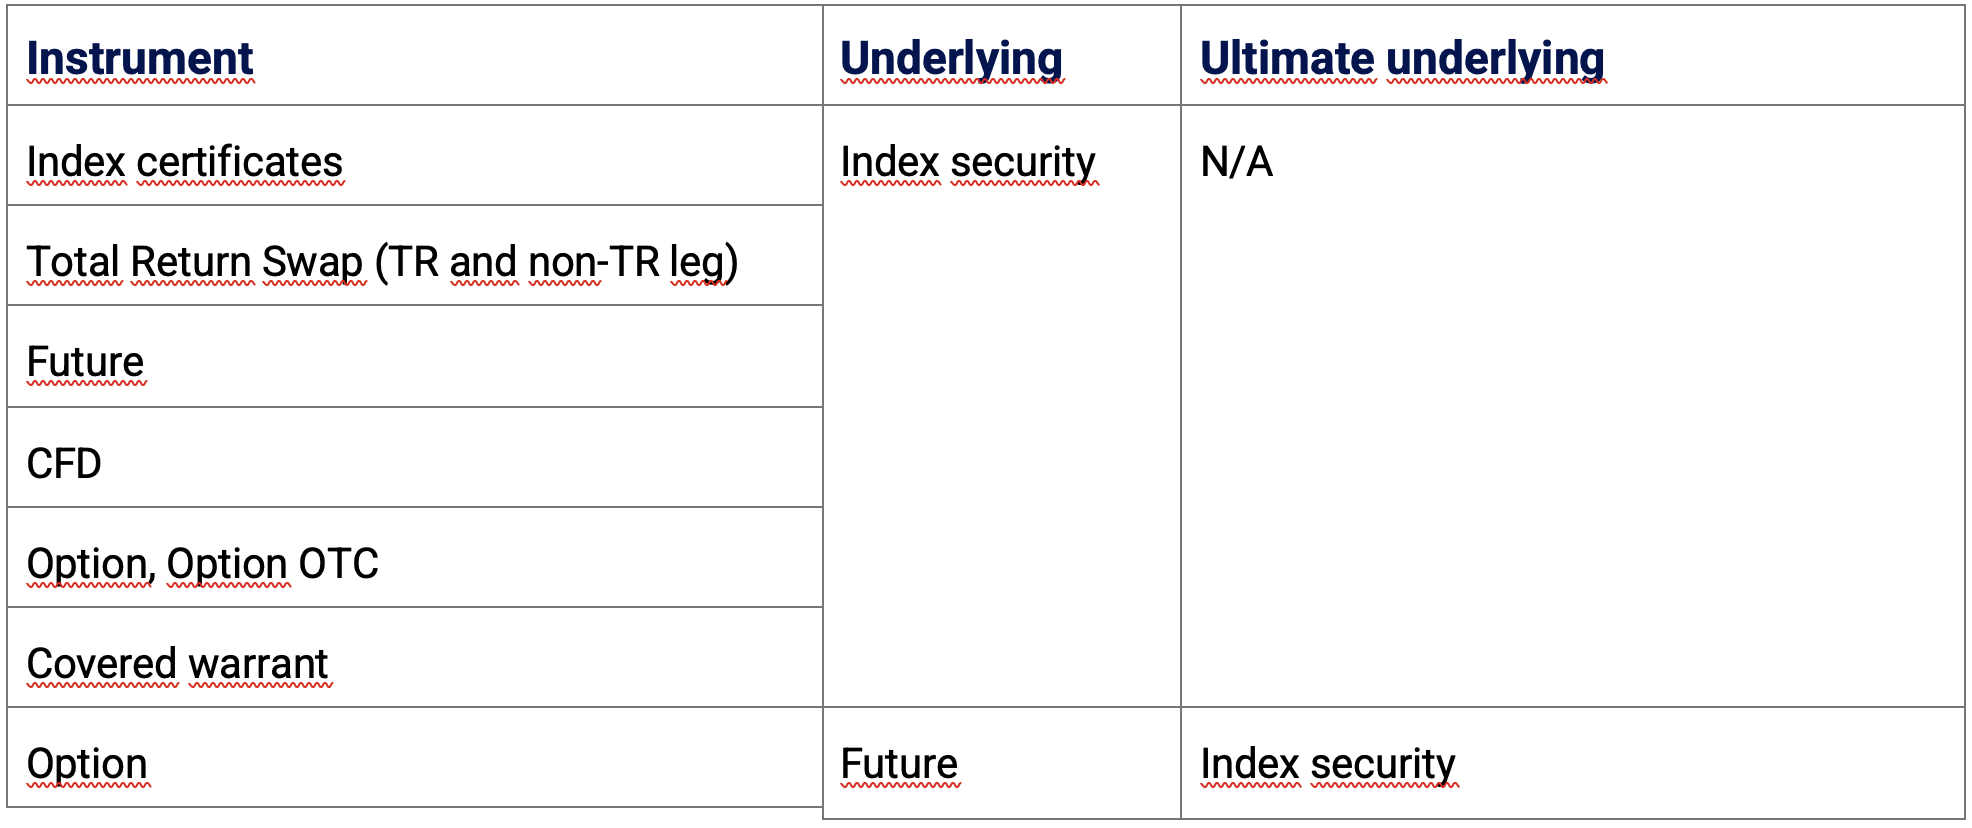
Also, you can now delete external cash flows using an automated batch job, which is particularly useful for accounting or cash flow forecasting. Previously, you had to manually delete the cash flow records in the External Cash Flows window. To delete an external cash flow, run a batch job with the Batch task field set to External Cash Flow - Delete.
Additionally, we have enhanced the support for BSM reports. Starting from 24.07, you can also model maturity cash flows for call money.
Lastly, we have increased the security of the reinvestment service. The certificates for the reinvestment service's secure connection are now sourced from the Windows Store, a secure repository within the Windows operating system that stores digital certificates and cryptographic keys.

Reinvestment service – secure connection
Subscription based licensing
Strategy Manager & various add-ons
Sales module dependency
Strategy Manager – Calculations, Strategy Manager - Market Data Stress Test, Strategy Manager - What-if and Horizon Analysis, Strategy Manager - Position Calculation API, Strategy Manager - Reinvestment component
Internal risk module – major enhancements
Configure weekly returns in Covariance Manager
From 24.07 version you can ease configuration of the Covariance Manger to calculate Weekly returns taking market data from Wednesdays. Now you can use the dedicated setting called “Next Wednesday” basis date in the Reference dates window and apply it as the anchor date in the Covariance Manager calculations.
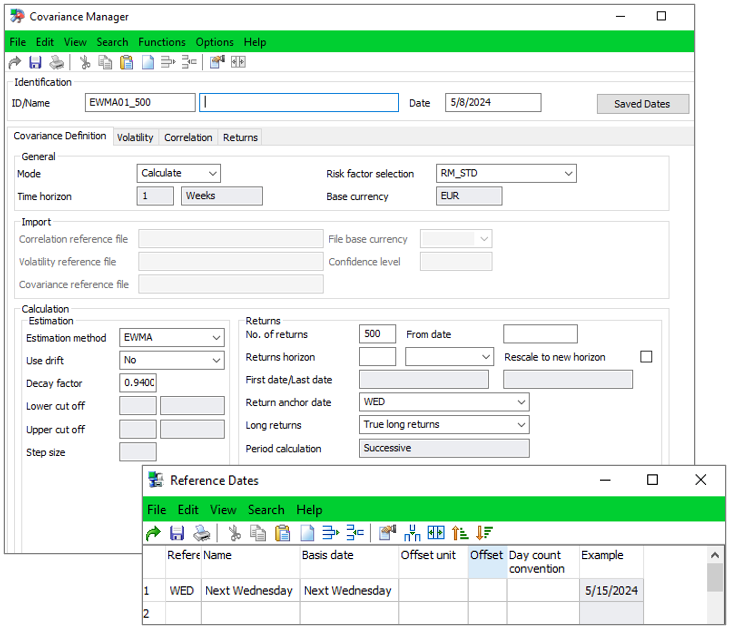
Wednesday returns in the Covariance Manager calculations
Securities descriptive fields for the time comparison analysis in the Risk Analysis Manager
From 24.07 version you can select security descriptive fields in the Time Comparison applet of the Risk Analysis Manager when analyzing security level results. This enables you to view more information about the holdings that you analyze. The fields are populated with the values when viewing results on the “Security ID” split defined in the Reporting Structure.
Following fields can be selected:
- Quotation Currency to display the defined holding currency when the transaction was created.
- Instrument type to enable grouping and filtering by this field inside the applet.
- Security Name to display the security descriptive name that is defined in the static data.
- Issuer ID and Name to view the issuers’ information which was defined in the security static data.
- Security Free Codes ID and Name to check additional security information and classifications.
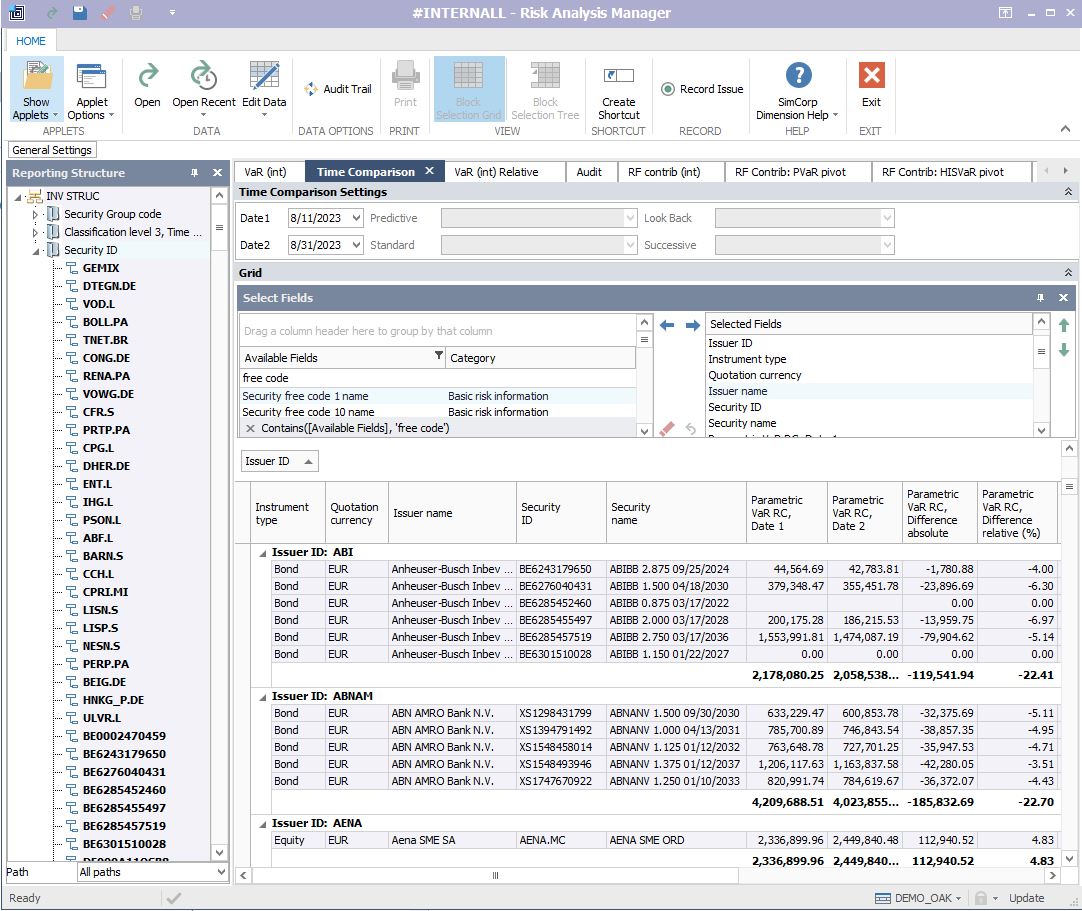
Selection of more fields in the Time Comparison applet
Subscription based licensing
Risk Analysis Manager
Sales module dependency
Risk Reporting
Various risk model modules
Release 24.04 Portfolio Analytics & Reporting
Risk Measurement MSCI RiskMetrics interface
Data processing - volume optimization
With this feature you can reduce number of benchmark constituents sent from SimCorp Dimension to MSCI. If several indexes are based on the same Index Universe Definition, then the constituents of those indexes are sent only once. This is especially useful when you have the same hedged and not hedged benchmarks in the same risk measurement calculation. This functionality is now supported in the Risk Measurements with the Relative tree Reporting Structure type and can be enabled through the special configuration setting called “Blend over index universe definition”.
Benefits
This enhancement enables you to send less positions through MSCI interface, which consequently results in the cost reduction.
Subscription based licensing
Risk Analysis Manager and add-ons
Sales module dependency
Risk Reporting
MSCI RiskMetrics – Adaptor
Risk Management – Internal risk enhancements
Risk Analysis Manager - View long names for Portfolio and Portfolio Free Code nodes
In the Risk Analysis Manager, it is now possible to view long descriptive names in the Reporting Structure for the Portfolio Free Codes splits only or for the Portfolio split only. The long names of the Portfolio Free Codes provide better description of the free code than the short name (ID) which has limited amount of the digits.
By selecting new options, such as: Show long names in the tree for the Portfolio Free Code nodes and Show long names in the tree for the Portfolio nodes, you can view long descriptive names for those nodes but other nodes viewed as the Short names/IDs.
Benefits
This enhancement provides more flexibility and convenience in viewing reporting trees in the Risk Analysis Manager.
Monte Carlo Value at Risk scenario generation enhancements
- The Monte Carlo Value at Risk SimCorp Dimension internal model has been enhanced to generate scenario values using Sobol sequence methodology. Sobol sequence is one of the Quasi-random low-discrepancy sequences which has wide application in Monte Carlo Value at Risk computation. It is proved to be well-suited for the high-dimensional spaces, in particular the risk modelling for the scenarios with the high number of the risk factors.
The distribution of the scenario values obtained using Sobol methodology has the quantiles close to the analytical quantiles, which consequently leads to more accurate Value-at-Risk values. Sobol scenario generation method can be used with both Normal and Student-T distribution. - In addition to the new scenario generation method, the improvement to Student-T distribution has been introduced in the Internal Risk module. As of version 24.04, when using Student-T distribution configuration the scenarios are generated using multivariate T-distribution which is better for modelling of multivariate data allowing for more accurate modelling of dependencies between the risk factor returns.
This is one of the robust and reliable approaches to handle correlated variables widely used in finance and well suited for the Monte Carlo VaR scenario generation process. The application of new computation approach helps to avoid systematic overestimation and underestimation of the Value at Risk analytics. This is not a configurable change, thus new methodology is now applied to all supported scenario generation methods (Faure, Sobol, Generalized Faure, Random) generated using Student-T distribution.
Subscription based licensing
Risk Analysis Manager
Sales module dependency
Risk Reporting
Various Risk Modules
Investment Forecasting & Solvency – various enhancements
Accounting forecasting, particularly projecting future balance sheet reports over 3-5 and more years, is crucial in the financial realm as it allows businesses to anticipate and prepare for potential financial challenges, manage risks, and make informed strategic decisions. The inclusion of Credit Loss Allowance (CLA) in these forecasts is particularly vital as it helps mitigate the impact of credit risk by estimating potential losses from non-performing loans, ensuring financial stability and regulatory compliance.
As of version 24.04, when forecasting credit loss allowance (CLA) in the Strategy Manager, SimCorp Dimension can also calculate CLA balances based on the cash flow reduced by a Cash flow adjustment factor (i.e. “full” cash flow assumption). A factor for each term unit equals to Loss Given default multiplied by the Probability of Default . A term unit in this scenario is time left to maturity on calculation date. For example, if your term unit is one year, the cash flows that are due in one year from the calculation date are adjusted.
Considering the Cash flow adjustment factor in the CLA calculations helps to dissolve the CLA balances, if the expected loss is not going to be realized, in small steps.
Furthermore, we've enhanced support for the local German legal requirement Branchen Simulations Model (BSM) to streamline reporting of the future cash flows. You can now simulate cash flows of external fund components including dividends, coupons, redemptions, and maturity payments. Some transactions, such as redemptions, can also affect the position.
Cash flows for external fund components are derived from description of securities during position calculation. Simulated transactions are generated solely for passive strategies, not for what-if scenarios.
Following position calculation execution in the Position Results applet, you can review simulated cash flows and their effects for securities marked as Constituent. Results are accessible in Payments QC/PC, Balance nominal/number fields, and related analytics fields, with transaction details available in the Transactions since inception sub-window. Additionally, you can extract these cash flows from the database table using the Data Extractor.
Finally, you can include accrued interest for shocked and unshocked values when you calculate SSD Solvency II analytics using the external price. This allows to treat SSD more accurately when you calculate Solvency II figures for them using external price methodology.
Subscription based licensing
Strategy Manager & various add-ons
Sales module dependency
Strategy Manager - Calculations
Strategy Manager - Market Data Stress Test
Strategy Manager - What-if and Horizon Analysis
Strategy Manager - Position Calculation API
Strategy Manager - Reinvestment component
Release 24.01 Portfolio Analytics & Reporting
Risk Measurement MSCI RiskMetrics interface
Instrument coverage for MSCI RiskMetrics
The MSCI RiskMetrics interface solution has been enhanced to support the new Inflation swap model for inflation swap instruments in MSCI. Previously, the Swaps were covered by the Generic Bond model and Rate Swap models only.
Benefits
Possibility to use additional model for the Swap instrument types.
Transparency for FX Swap positions
According to new workflow the FX swaps are booked as separate FX forwards. The Contract execution reference can be used to identify FX forward pairs which belong to one contract. Now it is possible include Contract execution reference tag through the custom bucket definition of a holding in the XML position file sent to the MSCI RiskMetrics.
Benefits
This enhancement enables easier analysis of the FX positions in the MSCI interface.
Data processing - volume optimization
With this feature you can reduce number of benchmark constituents sent from SCD to MSCI. If several indexes are based on the same Index Universe Definition, then the constituents of those indexes are sent only once. This is especially useful when you have the same hedged and not hedged benchmarks in the same risk measurement calculation. This functionality is supported in the Risk Measurements with the Investment structure reporting tree types and can be enabled through the special configuration setting called “Blend over index universe definition”.
Benefits
This enhancement enables you to send less positions through MSCI interface, which consequently results in the cost reduction.
Subscription based licensing
Risk Analysis Manager and add-ons
Sales module dependency
Risk Reporting
MSCI RiskMetrics – Adaptor
Internal risk enhancements
New price method for the structured bonds with embedded caps and floors
The “Quoted price + yield curve, structured products” price method can be used to calculate the risk analytics for the quoted Floating rate notes and Multiple interest type bonds with cap/floors. In the risk calculations, you get exposures from the risk factors related to both yield and volatility curves used in the pricing.
Benefits
This enhancement enables you to use improved pricing valuation of structured bonds in the internal risk model.
Automatic update of the Risk Factor Selection with new factors
It is now possible to schedule automatic job which ensures that all factors which belong to the certain factor group are added to relevant risk factor selection. You can add the additional risk factors based on conditions in the Risk Factor Segment window and risk factor free codes.
Benefits
This functionality helps to design the workflow which automatically includes the risk factors from third-party models into specific Risk Factor Selection setups.
Split fund components by IFRS 9 purpose
You can build the Reporting Structures which groups holdings by different IFRS 9 purposes. Now such dynamic split in the absolute tree structures is more flexible for the internal funds. Previously, the split value came from the fund share, while now it is possible to take the value from the asset portfolio of the internal fund. This is controlled by the Decomposition Profiles configuration. The analysis of the risk analytics according to new grouping value is available in the Risk Analysis Manager.
Benefits
With this enhancement, you can use a split on different IFRS 9 purposes in the risk analysis and reporting flow for all positions including the decomposed fund holdings.
Subscription based licensing
Risk Analysis Manager
Sales module dependency
Risk Reporting
Various risk model modules
Investment analytics service for performance
Investment analytics service for performance is SimCorp’s next generation solution for investment performance. The powerful cloud native calculation service is exposed for usage via API’s as well via a cloud native frontend.
The calculation service has been improved with
- Ability to scope and group the analysis on descriptive data of choice such as security descriptive data, GICS business classifications, ratings etc.
- Support of performance, net and gross of costs and taxes
- Support of multiple currencies as base currency for reporting
- Ex post risk analytics such as Volatility, Sharpe ratio, Tracking error etc.
All of these capabilities are contributing to an increasingly powerful performance analytics offering
Benefits
- Enable users to analyze investment performance according to criteria of choice with ease.
- Avoid time consuming reconfigurations and integrations to get to analytical insights.
- Enable users to report account level investment performance according to reporting needs for stakeholders and clients.
Subscription based licensing
Part of Investment analytics service - Performance
Sales module dependency
Part of Investment analytics service - Performance
Release 23.10 Portfolio Analytics & Reporting
Risk Measurement MSCI RiskMetrics interface – major enhancements
Instrument coverage for MSCI RiskMetrics
The MSCI RiskMetrics interface solution has been enhanced to support Interest Rate Swaps and Cross Currency Swaps with the Rate Swap model. The use of the new model can be configured through model override functionality; therefore, it is still possible to use the Generic Bond model for those instrument types.
Benefits
Possibility to use additional models for the Swap instrument types.
Security Proxy enhancement
This enhancement of the MSCI interface provides an additional option of proxying the holdings. Within the MSCI interface a holding is linked to a security model by pricedSecurityName. During the translation and mapping process, some positions may fail to be validated and recognized successfully. To avoid this, it is now possible to define in the SimCorp Dimension configuration “proxyPricedSecurityName” tag for the selected securities holding, so that such holdings will use the same model as defined for the security used as a proxy. This functionality follows the proxy logic available on MSCI side.
Benefits
Wider possibilities of how the security can be proxied to another security for which the model data is available.
Subscription based licensing
Risk Analysis Manager and add-ons
Sales module dependency
Risk Reporting
MSCI RiskMetrics – Adaptor
Investment Forecasting & Solvency – various enhancements
We are pleased to announce the latest Strategy Manager enhancements, which can benefit all solutions based on the Position Calculation (e.g. Solvency II, forecasting, ESG). In this release, we have made the following operational improvements:
You can control whether you want to see the Explain Price in the Position Results.
- A new option, Never, allows not to store explains at all. This enhancement improves database storage efficiency.However, it is important to note that selecting this option means there will be a lack of transparency regarding how price was calculated
Also, you can use Look-through as a decomposition type for position calculation setups. Previously, you could use Look-through as a decomposition type for portfolio calculations, but not for position calculations.
- You can use decomposition data to report, for example, ESG data based on metrics for portfolio companies and underlying investments or for Solvency II reporting.
Additionally, we improved handling of XpressInstruments in the Market Data Stress. This is relevant not only for the Position Calculation, but also for the Risk Measurement and potentially Front office. From now on, you can calculate shocked valued based on risk factors for XpressInstruments priced with a method "XpressInstrument“. For example, this allows to apply duration approach for these securities in Solvency II.
The next group of enhancement will benefit mainly forecasting solution:
Exclude simulations of fixings for floating rate notes (FRNs) after the Forecast from date during forecasting in position calculation. Once you select Exclude fixings after the forecast from date in the Calculation settings the fixings/coupons being generated using the fixing curve.
- This functionality ensures that we can provide same results for floaters for accounting and cash forecasting, after the forecast from date, independent of fixings defined on the static data of the bonds.
You can use finance schemes based on period closure (PCL) frameworks to simulate finance transactions in the Middle Office Calculation Manager.
- Previously, simulated finance transactions were always based on the profit/loss (P/L) framework specified on the Settings tab in the Position Calculation Definition window.
Subscription based licensing
Strategy Manager & various add-ons
Sales module dependency
Strategy Manager – Calculations
Strategy Manager – Market Data Stress Test
Strategy Manager – What-if and Horizon Analysis
Strategy Manager – Position Calculation API
Strategy Manager – Reinvestment component
Release 23.07 Portfolio Analytics & Reporting
Investment Analytics Service for Performance
The Investment Analytics Service - Performance solution enables investment managers to deliver effective and accurate performance analytics for portfolio analysis, clients, and stakeholder reporting.
The Investment Analytics Service - Performance is a cloud native calculation service and is part of SimCorp’s open ecosystem. SimCorp is responsible for the operations of the calculation service. Your only responsibility is to upload data to the service. You can schedule and automate batch jobs to extract up-to-date data from SimCorp Dimension’s IBOR.
The service provides fast, dynamic, and granular performance analytics, and the results are exposed via web APIs.
The service capabilities include:
- Quick on-the fly calculations
- Scope and group by any criteria made available to the service
- Portfolio, benchmark and active performance results
The calculation service is a central aspect of making a single performance solution for:
- Official reporting for investors and internal stakeholders
- GIPS compliant reporting
- Front-office performance attribution analysis
The API end-points can be integrated into different workflows. The following are some examples of how the Investment analytics service can be integrated into workflows:
- View performance analytics in a modern SimCorp web-based user interface. The Investment Analytics Service - Performance frontend makes it easy to view, and get insights related to, performance.
- Persist official performance results with SimCorp’s cloud Data Warehouse
- Integrate directly into spreadsheets, data warehouses, business intelligence or in-house software applications
Benefits:
- Enable more flexible performance analysis and reporting workflows
- Optimize for value creating tasks rather than operational work
- Minimize costs
Subscription based licensing
Investment Analytics Service - Performance
Sales module dependency
Performance base
MSCI RiskMetrics interface solution enhancements
Instrument coverage for MSCI RiskMetrics
The MSCI RiskMetrics interface solution has been enhanced to cover the equity options and index options that are created in the Trade Manager (XpressInstruments templates) by the Option+ model. The Index Options created using Trade Manager workflow can also be covered using Equity Option model in MSCI RiskMetrics interface. This functionality enables you to use a wider list of the securities that you create through Trade Manager in the MSCI RiskMetrics interface.
Danish MBS positions can now be covered by the General Sensitivity model. It is another option of Secondary model applied to a Bond instrument type according to the defined priorities. Note, if you use the general sensitivity model, it is required to create a MSCI Risk Factors and Sensitivities Definitions setup to specify the risk factors that are used to define first and second order sensitivities for bonds.
Enable blending of blended indexes that have the same indexes composites
Benchmark blend representation functionality avoids sending the same benchmark positions that belong to the same index several times. From 23.07 this functionality also reduces the number of benchmark positions sent through MSCI interface when the same index is a component of several blended indexes.
For example, if two or more blended indices have the same underlying indexes then the constituents of those indices are sent only once through the position file. This functionality can be used in the Risk Measurement setups with the investment tree structure and the relative tree type. The main benefit is the data volume optimization sent to MSCI and consequently cost saving.
Subscription based licensing
Risk Analysis Manager and add-ons
Sales module dependency
Risk Reporting
MSCI RiskMetrics – Adaptor
Investment Forecasting & Solvency – various enhancements
We are pleased to announce the latest enhancements to our Solvency II Pillar 1 and ORSA solutions. In this release, we have made the following improvements:
- Improved FX shocks in the Market Data Stress Test
- It is now possible to exclude certain securities from the FX rate shock for Solvency II and Market Data Stress Tests in Reporting Currency.
- This feature allows for the omission of FX rate double shocking in specific cases, such as when pricing securities using sensitivity approximation, for both historical and forecasted scenarios
- Selective Solvency II Analytics Calculation:
- Previously, the Position Calculation always calculated all pre-defined analytics for Solvency II.
- With this update, you can select specific Solvency II analytics to be calculated. This enhancement is particularly useful for investigating specific Solvency II analytics of interest.
The next enhancement with benefits both Solvency II and forecasting solution.
- Starting from version 23.07, you can control whether you want to see the Explain Market Data Stress Test and Explain Market Data Forecast in the Position Results.
- A new option, Never, allows not to store explains at all. This enhancement improves database storage efficiency and overall calculation time.However, it is important to note that selecting this option means there will be a lack of transparency regarding how the Market Data Stress Test and Market Data Forecast were calculated
Subscription based licensing
Strategy Manager & various add-ons
Sales module dependency
Strategy Manager – Calculations
Strategy Manager – Market Data Stress Test
Strategy Manager – What-if and Horizon Analysis
Strategy Manager – Position Calculation API
Strategy Manager – Reinvestment component