

EQUITY RISK MONITOR HIGHLIGHTS
WEEK ENDED OCTOBER 23, 2026
Concerns about a potential market correction are starting to mount, driven by:
- High and rising rates accompanied by higher-than-desired inflation
- Sharply declining trading volume
- Intense market concentration
- Avoiding the “buy the dip” trade and
- Higher Statistical vs. Fundamental model risk
I recently watched a TV show called “Is it Cake”, where contestants baked and assembled cake components to look like something real (it being near Halloween, one such choice was of a monster’s head). Judges then had to decide which was real and which was made out of cake – and some of the bakers were so good the judges could not tell!
It got me thinking, is this what seems to be looking like the start of a correction? Could be, as investors’ enthusiasm about the endless growth possibilities of AI companies starts to fade, oil prices continue to rise exacerbating inflation, and US long rates hover around 5%. This level of rates offers a potentially attractive alternative to equities while also raising costs for companies issuing debt and driving mortgage rates to 25-year highs (with a short exception in 2023). But is it truly a correction, or just a pause?
On top of the above there are several other risk-related issues that keep us concerned, among them
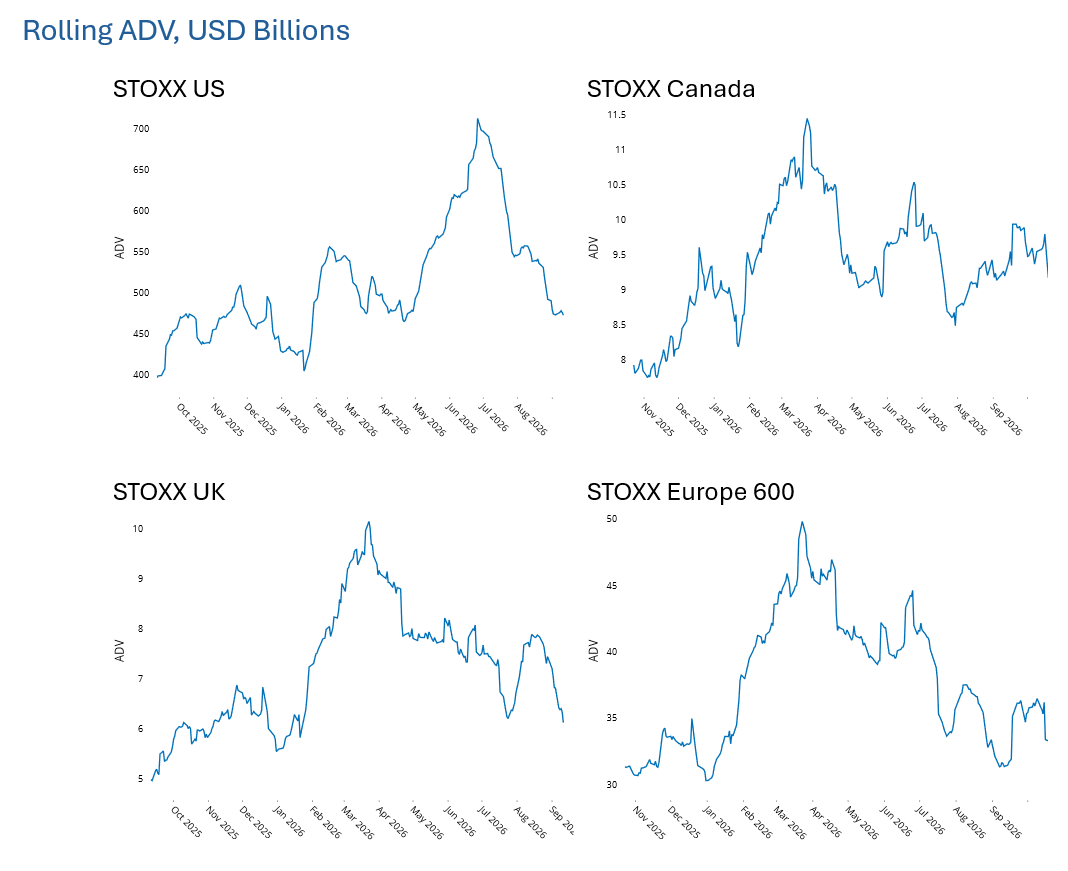
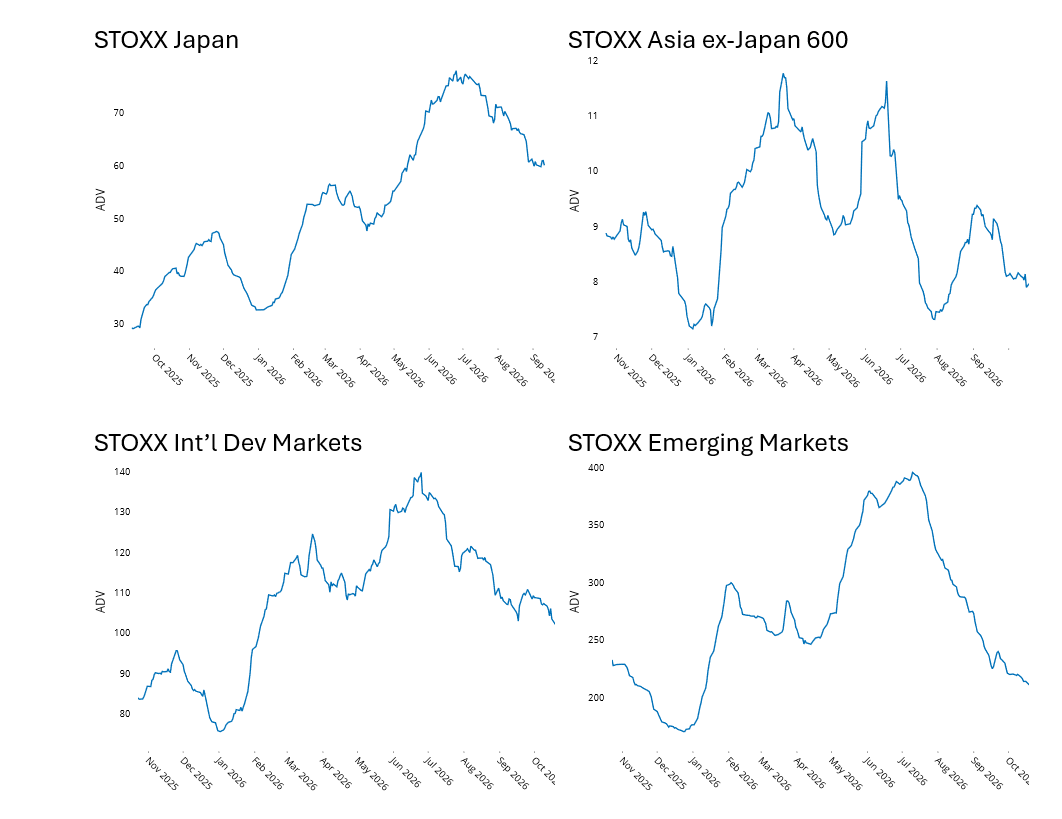
- Low dollar trading volume that continues across most benchmarks, suggesting there is little support when there are rallies. Volume is significantly off its peak in most major markets; for some, like STOXX Europe 600, it is down more than 30% from its peak at the end of March 2026, while the European market (in USD) was roughly flat over the same period. Similarly, STOXX US volume ended last week 28% lower than at the end-of-June peak while the market rose 4% over the same period, STOXX Emerging Markets volume fell 47% since mid-July vs. a market decline of 6%, STOXX International Developed Markets saw volume fall 27% from the end of June when the market was roughly flat: this is the case for most of the indices we follow closely.
See charts from STOXX US, STOXX Canada, STOXX UK, STOXX Europe 600, STOXX Japan, STOXX Asia Pacific 600 ex-Japan, STOXX International Developed Markets and STOXX Emerging Markets Equity Risk Monitors as of October 23, 2026
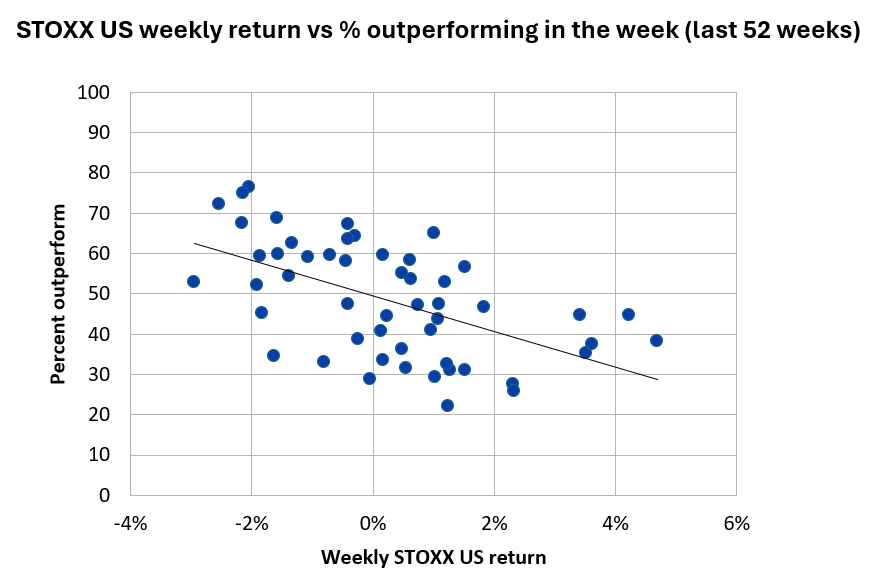
- Continued low market breadth, which we covered last week. We looked at this once again and note that the US market sees higher breadth when the market is down. This relationship has been strong and consistent this year. Somehow, a majority of stocks beating a down market does not feel as positive as when many stocks are rising and buoying the market.
The following chart does not appear in the Equity Risk Monitors but is available on request
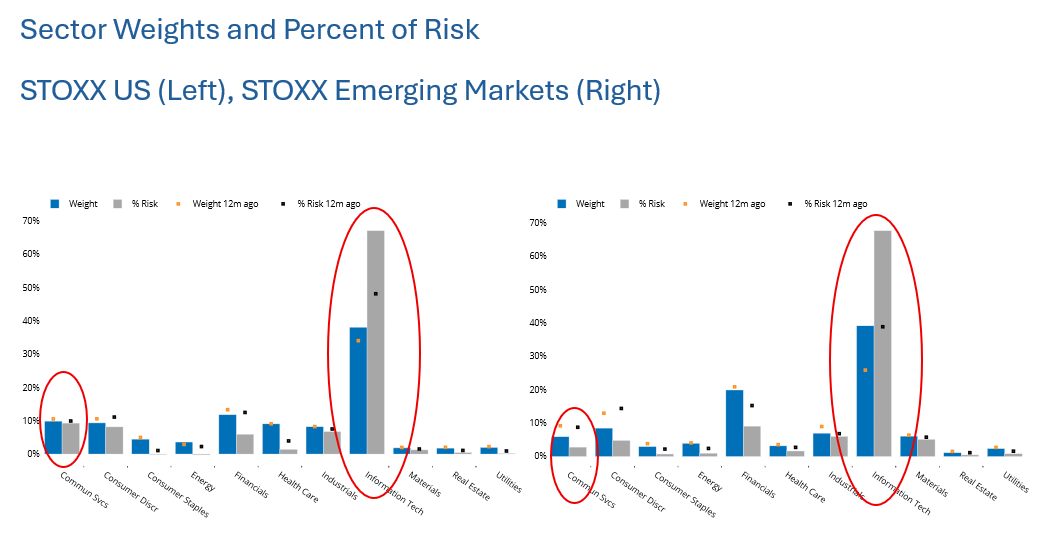
- Intense market concentration. As we all know, the market this year has been driven up by relatively few large names, mostly in the Information Technology sector, and their weights in some indices, especially those in the US and Emerging Markets, have increased dramatically. The current level of concentration is unlikely to be sustainable over the long term. Bank of America recently published a report showing that market concentration tends to peak at about 40% during major bubbles (which they examined back to the era of big railroads, and covered every major episode of unusually high concentration since then). We note that Information Technology is currently about 48% of the STOXX US index and almost 40% of STOXX Emerging Markets. Add Communication Services weight to those and we are looking at almost 50% of the weight in each index. Even more striking, however, is the risk concentration: the two sectors account for almost 80% of the risk in the US, and 70% in Emerging Markets. Those weights and risk contributions are up substantially over the past year, and we believe that can’t continue forever. If history is any guide, and we believe it is, we are getting to the point of unsustainable concentration which is likely to be fixed by a market downturn. Of course there are other parts of the world that are not dominated by this one sector; that is perhaps one small tick mark in favor of a continued market expansion, if only outside the US and Emerging Markets.
See charts from the STOXX US and STOXX Emerging Markets Equity Risk Monitors of October 23, 2026
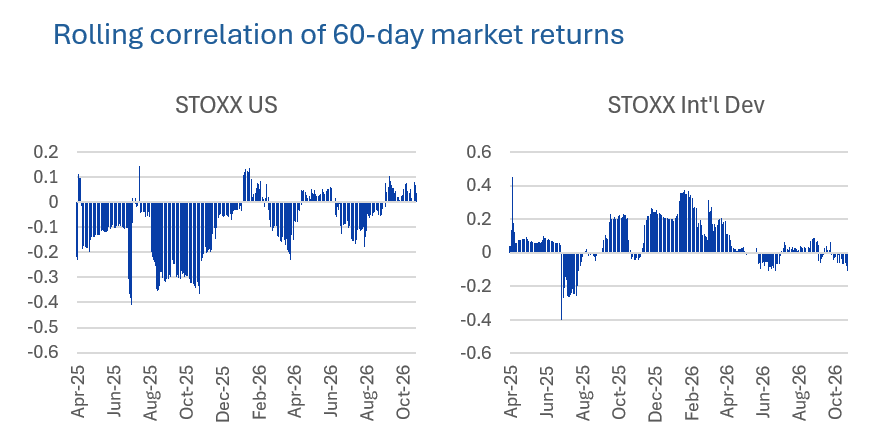
- US investors do not seem to be buying the dip. We devised a simple (probably too simple) measure for whether investors are “buying the dip”. If they are, the recent downturn is more likely to be short-lived. Our back-of-the-envelope measure just looks at the 60-day correlation of returns, with the notion that if correlations from one day to the next are getting more negative, then investors may be buying the dip (market falls one day but rises the next). Our most recent calculation finds that correlations have been positive in the US since early September, meaning that the market is continuing in the same direction and investors are not buying and pushing the market up after a down day. We do not see the same outside the US – investors do seem to be buying after down days more. Of course this is hardly a definitive answer.
The following charts do not appear in the Equity Risk Monitors but are available on request
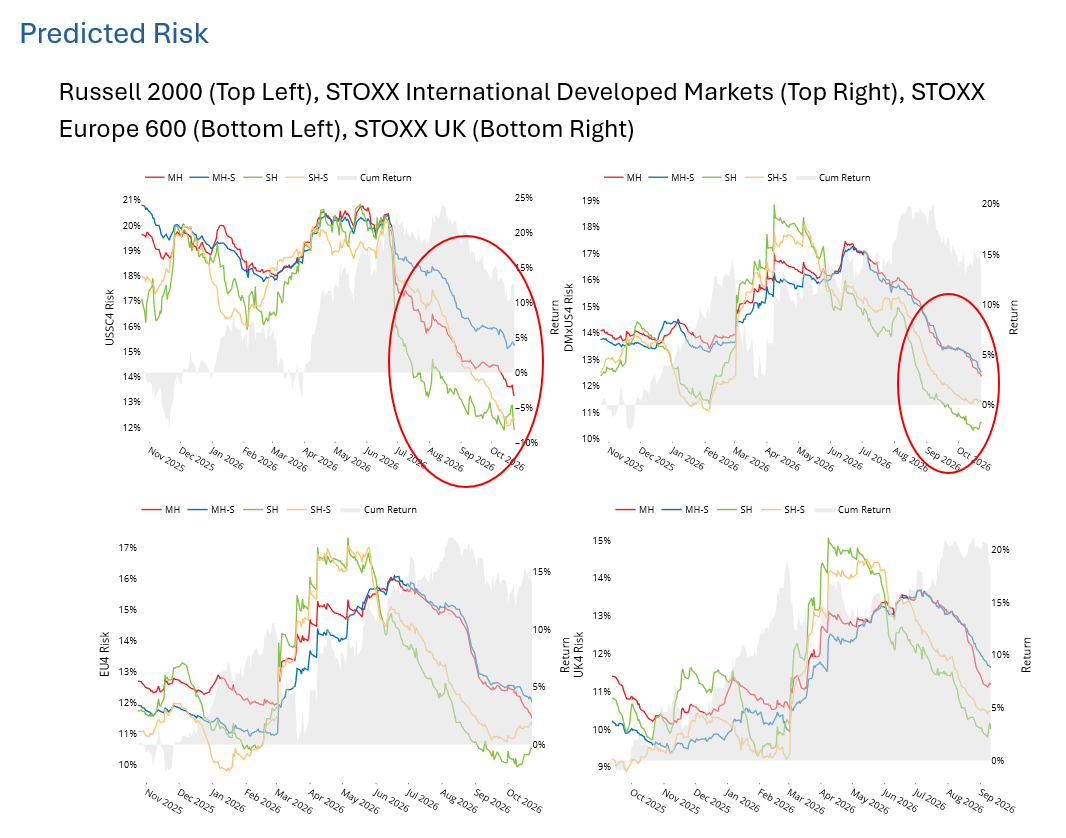
- Finally, several indices are seeing risk according to the short-horizon statistical model that is higher than that coming from the corresponding fundamental model. We often view this is a signal that there is a risk unidentified by the fundamental model that is bubbling under the surface. Our colleagues have identified one possible explanation for this, a somewhat transient AI factor (see here and here). To be sure, a hidden AI risk is not the only reason the statistical model may see more risk than a fundamental one. In particular, we note that the statistical forecast is lower than the fundamental in the US and Emerging Markets, which as we just mentioned are the most heavily weighted in the major sectors affected by AI. While several indices have seen a positive spread for months (STOXX Developed World, STOXX UK, STOXX Europe 600 and STOXX International Developed Markets), the Russell 2000 , experienced a wide gap throughout the third quarter as the market slid, reverted and then just reverted again.
See charts from the Russell 2000, STOXX International Developed Markets, STOXX Europe ‘600 and STOXX UK Equity Risk Monitors of October 23, 2026
As investors work to determine whether the decline is the real thing, or just cake, these are just a few of the extra risks they should keep in mind.
You may also like


